Explore
 Validate
 Learn
Learn Western blot
Antibody data
- Antibody Data
- Antigen structure
- References [1]
- Comments [0]
- Validations
- Western blot [2]
- Immunocytochemistry [1]
- Immunohistochemistry [1]
- Other assay [3]
Submit
Validation data
Reference
Comment
Report error
- Product number
- PA5-72927 - Provider product page

- Provider
- Invitrogen Antibodies
- Product name
- MAT2A Polyclonal Antibody
- Antibody type
- Polyclonal
- Antigen
- Synthetic peptide
- Reactivity
- Human, Mouse, Rat, Bovine, Porcine
- Host
- Rabbit
- Isotype
- IgG
- Vial size
- 100 μL
- Concentration
- 1 mg/mL
- Storage
- Store at 4°C short term. For long term storage, store at -20°C, avoiding freeze/thaw cycles.
Submitted references Novel copper complex CTB regulates methionine cycle induced TERT hypomethylation to promote HCC cells senescence via mitochondrial SLC25A26.
Jin C, Li Y, Su Y, Guo Z, Wang X, Wang S, Zhang F, Zhang Z, Shao J, Zheng S
Cell death & disease 2020 Oct 11;11(10):844
Cell death & disease 2020 Oct 11;11(10):844
No comments: Submit comment
Supportive validation
- Submitted by
- Invitrogen Antibodies (provider)
- Main image

- Experimental details
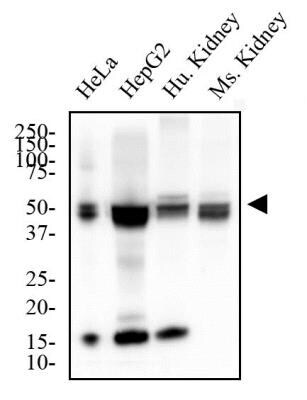
- Western blot analysis of MAT2A in HeLa and HepG2 cells and human and mouse Kidney. Samples were incubated in MAT2A polyclonal antibody (Product # PA5-72927) using a dilution of 2 µg/mL followed by an anti-rabbit HRP secondary antibody. Separated on a 12% gel by SDS-PAGE, transferred to PVDF membrane and blocked in 5% non-fat milk in TBST. Detection: chemiluminescence.
- Submitted by
- Invitrogen Antibodies (provider)
- Main image

- Experimental details
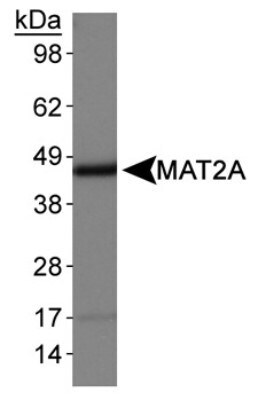
- Western blot analysis of MAT2A in HepG2 whole cell lysates. Sample was incubated in MAT2A polyclonal antibody (Product # PA5-72927).
Supportive validation
- Submitted by
- Invitrogen Antibodies (provider)
- Main image
- Experimental details
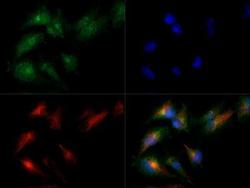
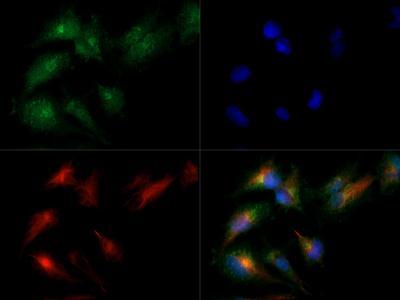
- Immunocytochemistry analysis of MAT2A in HepG2 cells. Samples were incubated in MAT2A polyclonal antibody (Product # PA5-72927) followed by DyLight 488 (green). Nuclei and alpha-tubulin were counterstained with DAPI (blue) and DyLight 550 (red).
Supportive validation
- Submitted by
- Invitrogen Antibodies (provider)
- Main image
- Experimental details
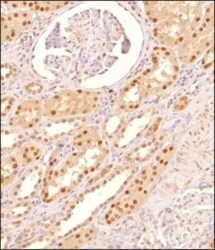
- Immunohistochemical analysis of MAT2A in formalin-fixed paraffin-embedded tissue section of human kidney. Samples were incubated in MAT2A polyclonal antibody (Product # PA5-72927) using a dilution of 1:200 followed by HRP labeled anti-rabbit secondary antibody and DAB reagent. Nuclei of cells were counter-stained with hematoxylin.

Supportive validation
- Submitted by
- Invitrogen Antibodies (provider)
- Main image

- Experimental details
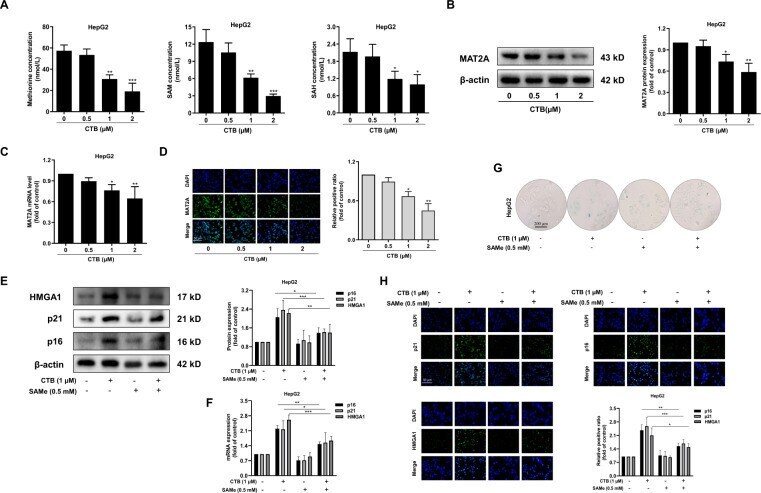
- Fig. 2 CTB-induced HCC cells senescence by inhibiting methionine cycle metabolism. HepG2 cells were incubated with the prescribed concentration of CTB or SAMe for 24 h. A Measurements of methionine circulating metabolites via HPLC; B The protein expression of MAT2A was detected by western blot; C Real-time PCR was used to quantify the mRNA level of MAT2A; D Immunofluorescence analysis of MAT2A. Scale bars are 50 mum; E , F Western blot and real-time PCR were used to quantify the protein and mRNA levels of senescent markers p16, p21, and HMGA1. Graphic imprinting results were derived from three separate experiments; G beta-galactosidase staining kits were used to determine the relative content of senescent cells. Scale bars are 200 mum; H Immunofluorescence in situ analysis of the expression of p16, p21, and HMGA1. The nucleus was stained by DAPI. Scale bars are 50 mum. Statistical significance for this graph, data are represented as mean +- S.D. ( n = 3); * P < 0.05 vs. control, ** P < 0.01 vs. control, and *** P < 0.001 vs. control.
- Submitted by
- Invitrogen Antibodies (provider)
- Main image

- Experimental details
- Fig. 5 The accumulation of SLC25A26 was necessary for CTB to inhibit methionine cycle metabolism. HepG2 cells were incubated with the prescribed concentration of CTB or transfected with SLC25A26 siRNA for 24 h. A - C Measurements of methionine circulating metabolites via HPLC; D Western blot analysis of MAT2A protein expression with quantification; E Real-time PCR analysis of MAT2A mRNA level; F Immunofluorescence analysis of MAT2A. Scale bars are 50 mum. Statistical significance for this graph, data are represented as mean +- S.D. ( n = 3); * P < 0.05 vs. control, ** P < 0.01 vs. control.

- Submitted by
- Invitrogen Antibodies (provider)
- Main image
- Experimental details
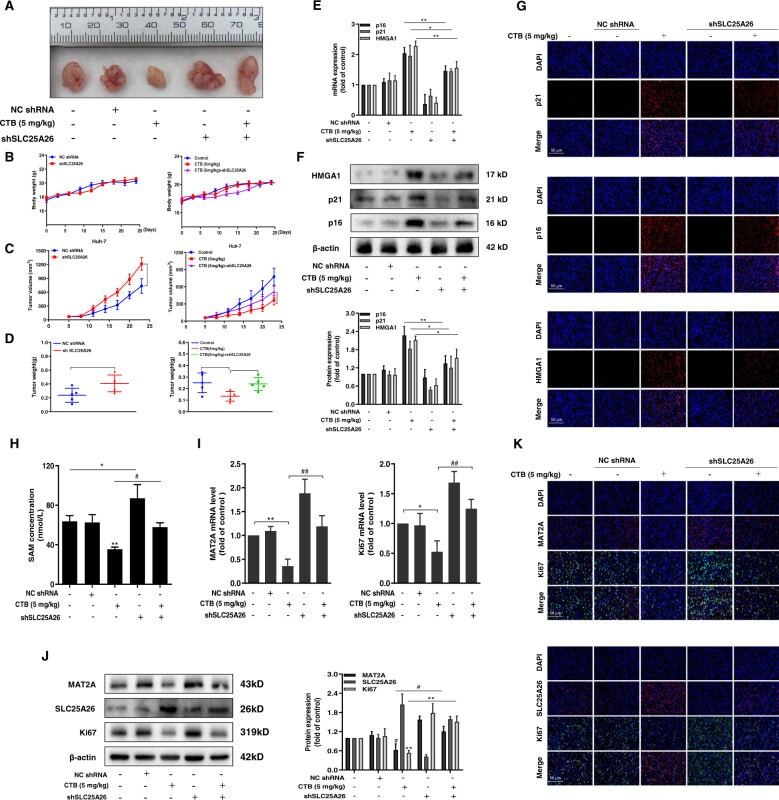
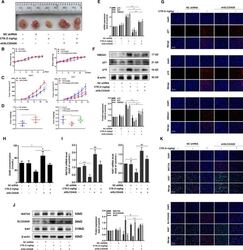
- Fig. 7 CTB repressed tumorigenesis in vivo by regulating SLC25A26. HCC cell line Huh-7 was used to construct subcutaneous xenografts. A Representative images of BALB/c nude mice tumors stripped from different groups ( n = 6); B The body weight change curves of mice in each group during the whole experiment period ( n = 6); C Tumor volume growth curves of mice in each group throughout the experimental period ( n = 6); D Tumor weight was obtained after executing mice on the last day ( n = 6); E Real-time PCR analysis of p16, p21, HMGA1 mRNA levels in tumor tissues; F Western blot was used to analyze the protein expression of p16, p21, HMGA1 in tumor tissues. Representative blots were from three independent experiments; G Immunofluorescence analyses of senescent makers p16, p21, HMGA1 in the tumor tissue; H Elisa kit analyzes SAM levels in the tumor tissue; I Real-time PCR analyses of MAT2A, Ki67 mRNA levels in tumor tissues. J Western blot was used to analyze the protein expression of MAT2A, SLC25A26, Ki67 in tumor tissues. Representative blots were from three independent experiments; K Immunofluorescence analyses of MAT2A, SLC25A26, Ki67 in tumor tissues; Scale bars are 50 mum. Statistical significance for this graph: * P < 0.05 vs. control, ** P < 0.01 vs. control, # P < 0.05 vs. CTB (5 mg/kg) + shSLC25A26, ##P < 0.01 vs. CTB (5 mg/kg) + shSLC25A26.