Explore
 Validate
 Learn
LearnMA5-34796
antibody from Invitrogen Antibodies
Targeting: ADAMTS13
C9orf8, DKFZp434C2322, FLJ42993, MGC118899, MGC118900, TTP, vWF-CP, VWFCP
 Western blot
 Immunohistochemistry
Antibody data
- Antibody Data
- Antigen structure
- References [1]
- Comments [0]
- Validations
- Immunohistochemistry [2]
- Flow cytometry [1]
- Other assay [2]
Submit
Validation data
Reference
Comment
Report error
- Product number
- MA5-34796 - Provider product page

- Provider
- Invitrogen Antibodies
- Product name
- ADAMTS13 Recombinant Rabbit Monoclonal Antibody (JG39-21)
- Antibody type
- Monoclonal
- Antigen
- Synthetic peptide
- Description
- Positive Control: SiHa cell, PC-3M, A549, HepG2, human liver tissue, human colon tissue.
- Reactivity
- Human
- Host
- Rabbit
- Isotype
- IgG
- Antibody clone number
- JG39-21
- Vial size
- 100 μL
- Concentration
- 1 mg/mL
- Storage
- -20°C, Avoid Freeze/Thaw Cycles, store in dark
Submitted references A spoonful of L-fucose-an efficient therapy for GFUS-CDG, a new glycosylation disorder.
Feichtinger RG, Hüllen A, Koller A, Kotzot D, Grote V, Rapp E, Hofbauer P, Brugger K, Thiel C, Mayr JA, Wortmann SB
EMBO molecular medicine 2021 Sep 7;13(9):e14332
EMBO molecular medicine 2021 Sep 7;13(9):e14332
No comments: Submit comment
Supportive validation
- Submitted by
- Invitrogen Antibodies (provider)
- Main image
- Experimental details
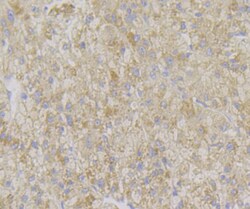
- Immunohistochemistry analysis of ADAMTS13 in paraffin-embedded human liver tissue. Samples were incubated with ADAMTS13 monoclonal antibody (Product # MA5-34796), and followed by hematoxylin.

- Submitted by
- Invitrogen Antibodies (provider)
- Main image
- Experimental details
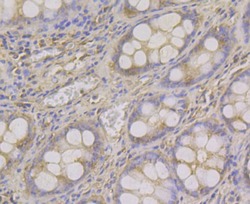
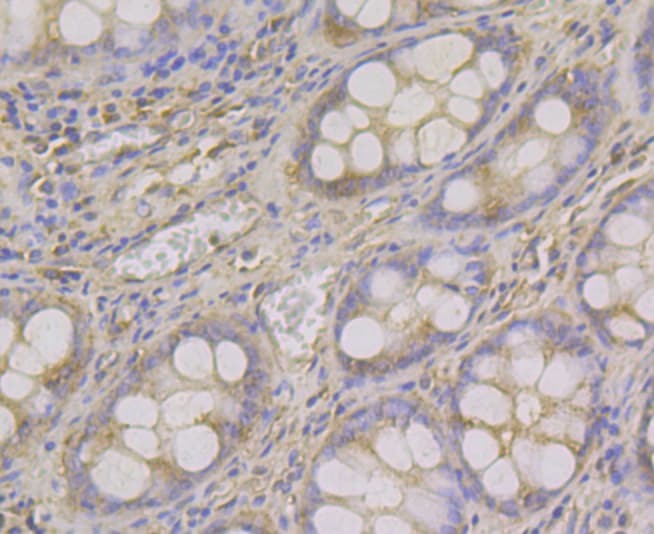
- Immunohistochemistry analysis of ADAMTS13 in paraffin-embedded human colon tissue. Samples were incubated with ADAMTS13 monoclonal antibody (Product # MA5-34796), and followed by hematoxylin.
Supportive validation
- Submitted by
- Invitrogen Antibodies (provider)
- Main image
- Experimental details
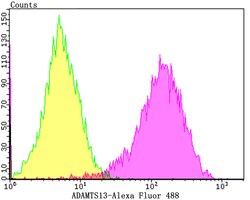
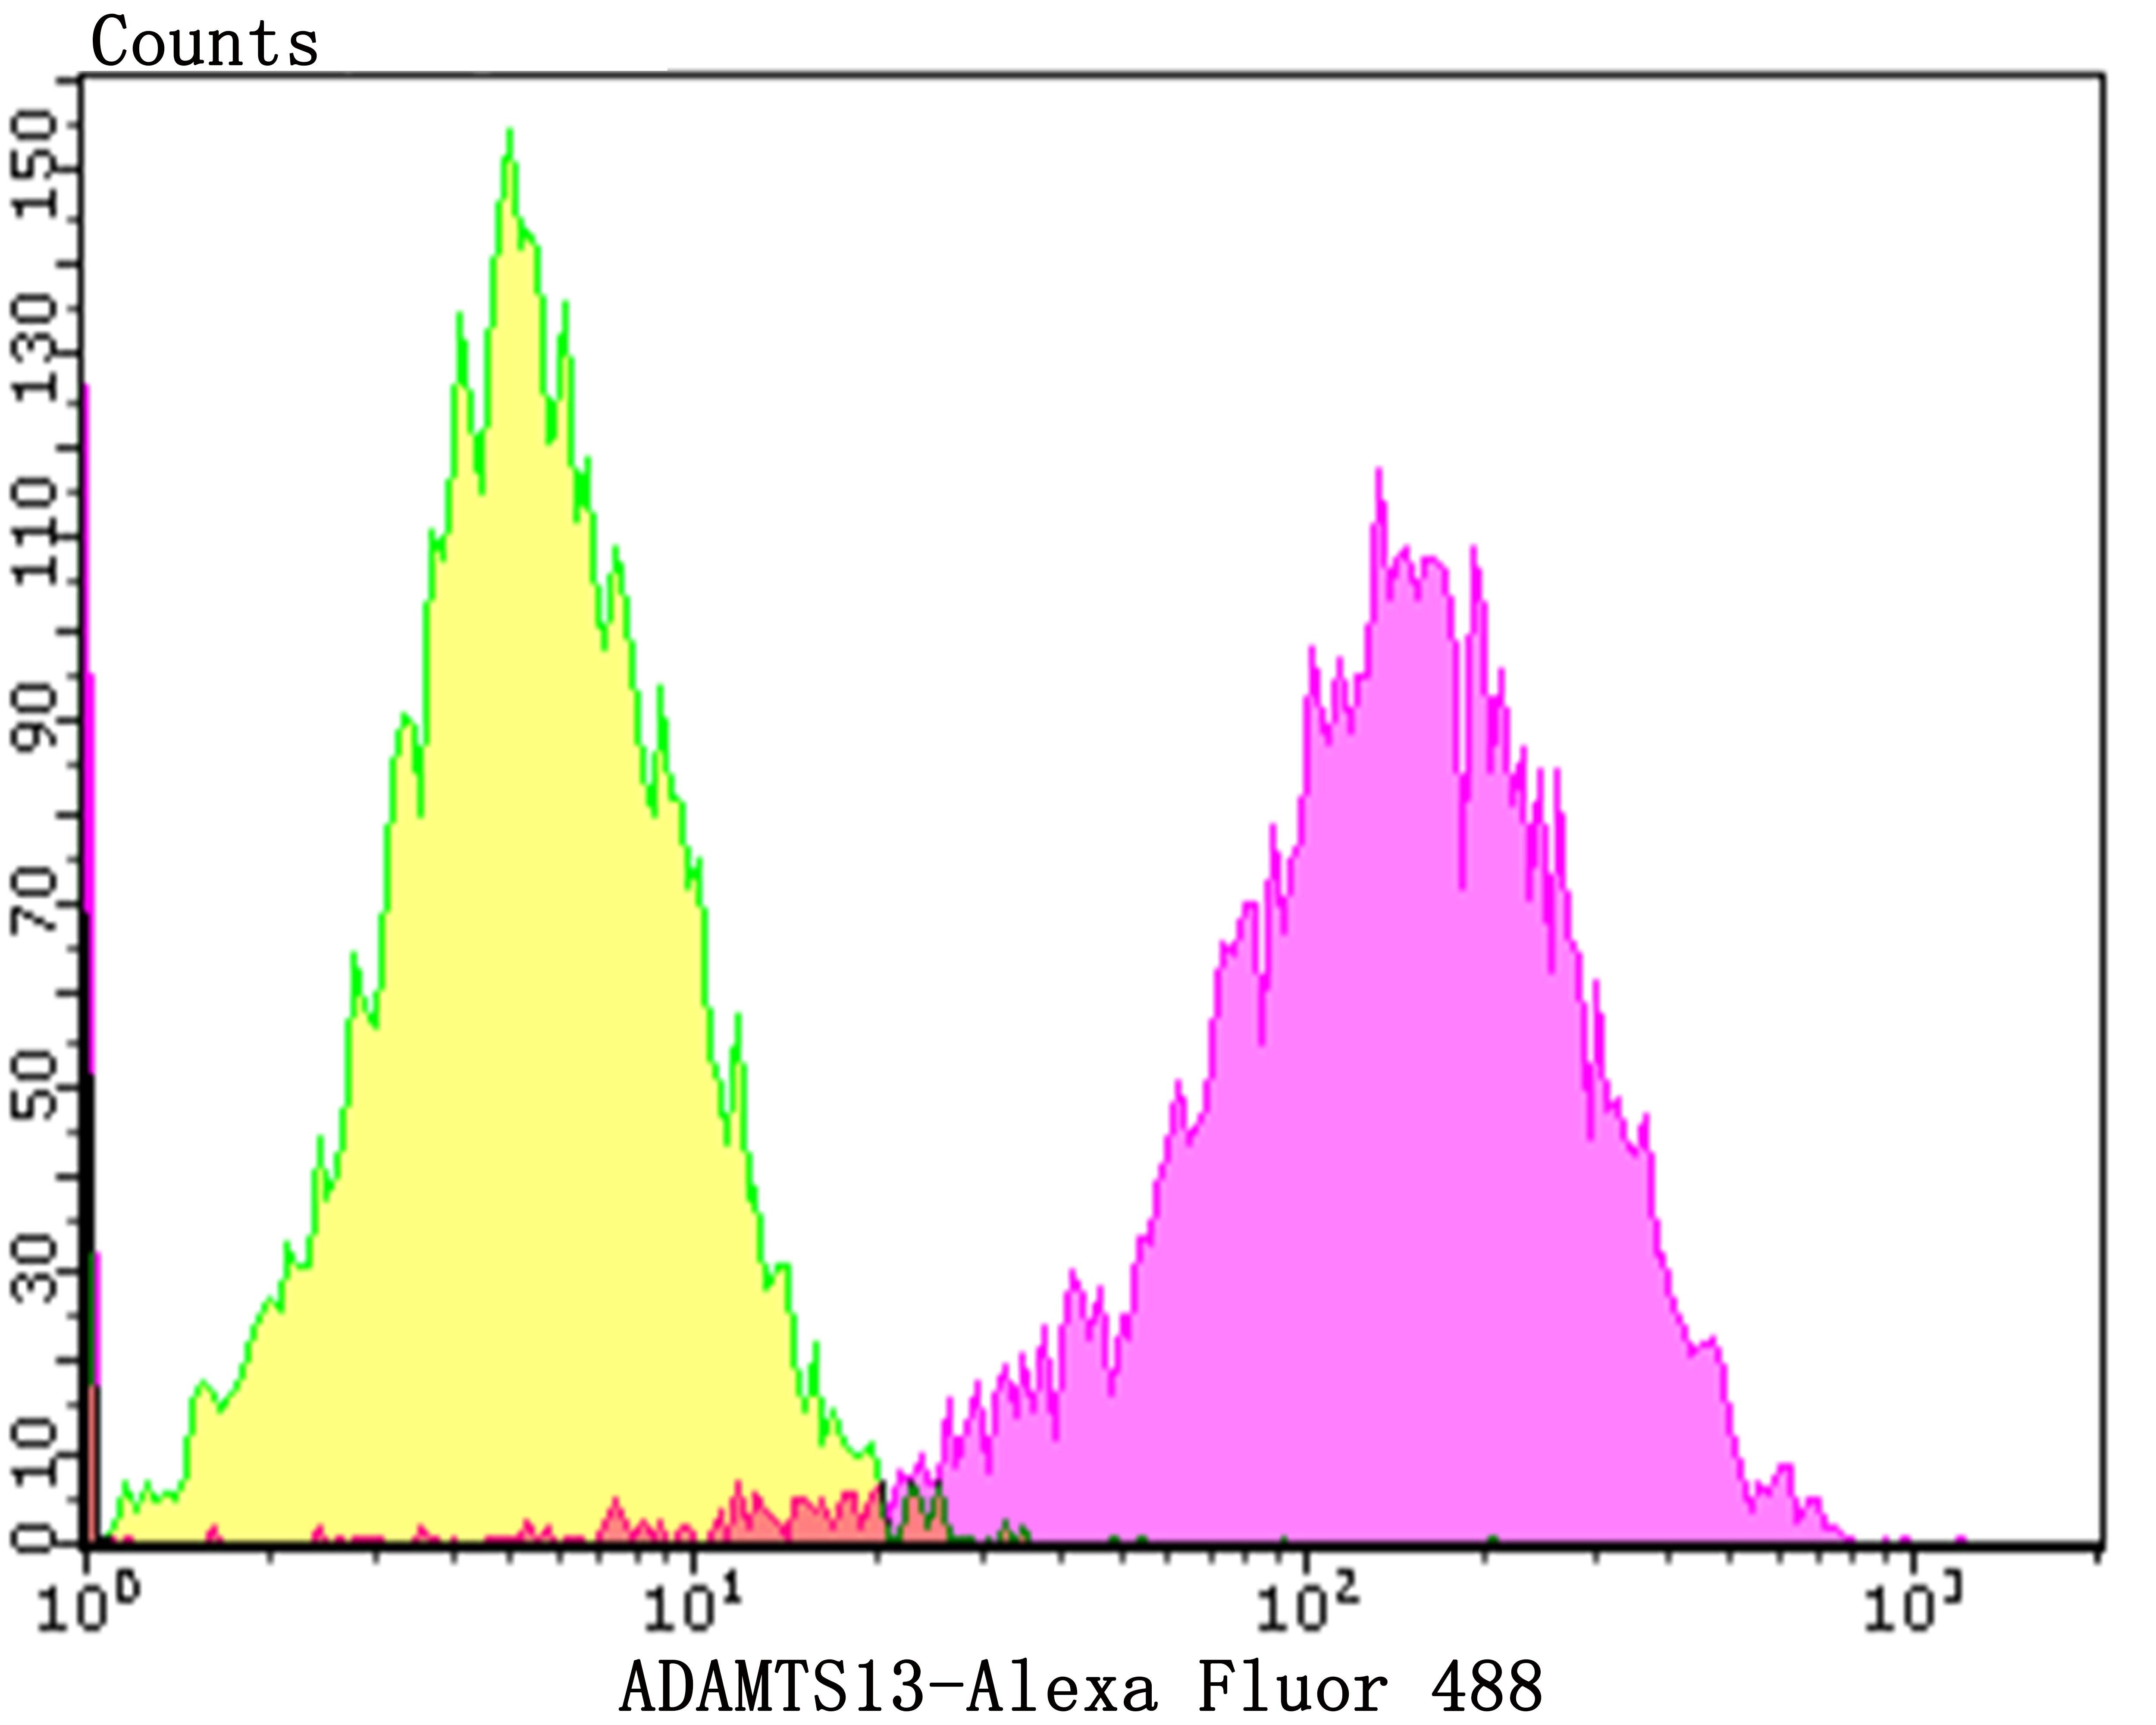
- Flow cytometry of ADAMTS13 in HepG2 cells (purple) compared with an unlabelled control (cells without incubation with primary antibody; yellow). Samples were incubated with ADAMTS13 monoclonal antibody (Product # MA5-34796) at a dilution of 1:100, followed by Alexa Fluor 488-conjugated goat anti-rabbit IgG.
Supportive validation
- Submitted by
- Invitrogen Antibodies (provider)
- Main image
- Experimental details
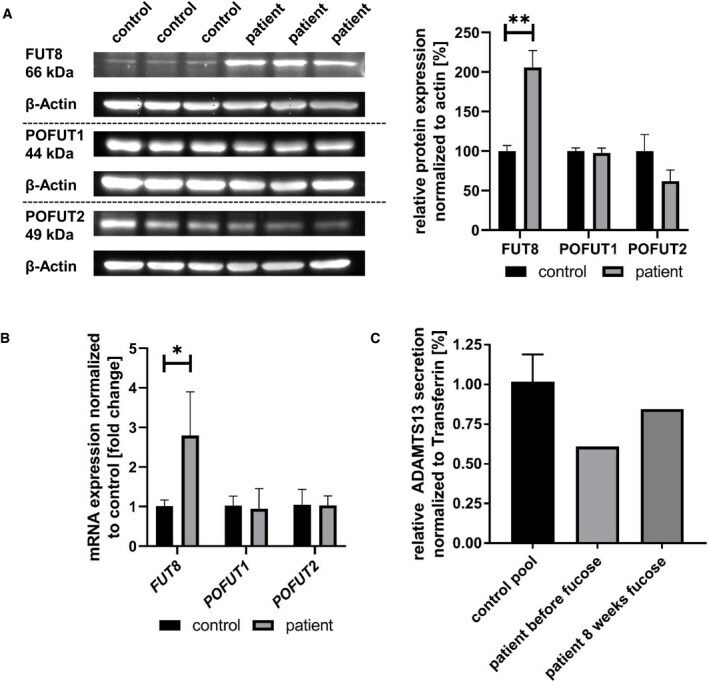
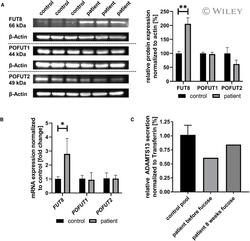
- EV3 Figure Effects of GFUS deficiency on the expression of fucosyltransferases and ADAMTS13 Western blot analysis of FUT8, POFUT1 and POFUT2. Expression of the proteins was analysed by western blotting on a 10% SDS-PAGE with cytosolic fractions derived from control and patient fibroblasts. Data were obtained from fibroblasts; n = 3, for statistics an unpaired t -test was performed. qPCR studies on FUT8, POFUT1 and POFUT2 . mRNA expression revealed a significantly increased transcript level of FUT8 (2.79 fold change; +- 1,10 fold change; * P = 0.0498) normalized to a control. Expression of POFUT1 and POFUT2 was not changed significantly. Data were obtained from fibroblasts; n = 9; experiment was independently repeated three times, for statistics an ANOVA was performed. Expression of ADAMTS13 in sera. The amount of ADAMTS13 secreted into sera of controls and the patient before and after 8 weeks of L-fucose treatment was detected by western blot and normalized to transferrin. Data were obtained from serum; n = 12 for controls. Data information: * P < 0.05; ** P < 0.01. Bars and error bars represent mean +- SD. Exact P -values are reported in the results part.

- Submitted by
- Invitrogen Antibodies (provider)
- Main image

- Experimental details
- Figure EV3 Effects of GFUS deficiency on the expression of fucosyltransferases and ADAMTS13 Western blot analysis of FUT8, POFUT1 and POFUT2. Expression of the proteins was analysed by western blotting on a 10% SDS-PAGE with cytosolic fractions derived from control and patient fibroblasts. Data were obtained from fibroblasts; n = 3, for statistics an unpaired t -test was performed. qPCR studies on FUT8, POFUT1 and POFUT2 . mRNA expression revealed a significantly increased transcript level of FUT8 (2.79 fold change; +- 1,10 fold change; * P = 0.0498) normalized to a control. Expression of POFUT1 and POFUT2 was not changed significantly. Data were obtained from fibroblasts; n = 9; experiment was independently repeated three times, for statistics an ANOVA was performed. Expression of ADAMTS13 in sera. The amount of ADAMTS13 secreted into sera of controls and the patient before and after 8 weeks of L-fucose treatment was detected by western blot and normalized to transferrin. Data were obtained from serum; n = 12 for controls. Data information: * P < 0.05; ** P < 0.01. Bars and error bars represent mean +- SD. Exact P -values are reported in the results part.