Explore
 Validate
 Learn
Learn Western blot
 Immunohistochemistry
Antibody data
- Antibody Data
- Antigen structure
- References [2]
- Comments [0]
- Validations
- Immunohistochemistry [1]
- Other assay [1]
Submit
Validation data
Reference
Comment
Report error
- Product number
- PA5-18931 - Provider product page

- Provider
- Invitrogen Antibodies
- Product name
- GluR4 Polyclonal Antibody
- Antibody type
- Polyclonal
- Antigen
- Synthetic peptide
- Description
- This antibody is predicted to react with bovine, mouse and rat based on sequence homology. This antibody is tested in Peptide ELISA: antibody detection limit dilution 128,000.
- Reactivity
- Human
- Host
- Goat
- Isotype
- IgG
- Vial size
- 100 μg
- Concentration
- 0.5 mg/mL
- Storage
- -20°C, Avoid Freeze/Thaw Cycles
Submitted references Colorectal cancer promoter methylation alteration affects the expression of glutamate ionotropic receptor AMPA type subunit 4 alternative isoforms potentially relevant in colon tissue.
Colorectal Cancer Early Detection in Stool Samples Tracing CpG Islands Methylation Alterations Affecting Gene Expression.
Vega-Benedetti AF, Loi E, Moi L, Restivo A, Cabras F, Deidda S, Pretta A, Ziranu P, Orrù S, Scartozzi M, Zorcolo L, Zavattari P
Human cell 2022 Jan;35(1):310-319
Human cell 2022 Jan;35(1):310-319
Colorectal Cancer Early Detection in Stool Samples Tracing CpG Islands Methylation Alterations Affecting Gene Expression.
Vega-Benedetti AF, Loi E, Moi L, Orrù S, Ziranu P, Pretta A, Lai E, Puzzoni M, Ciccone L, Casadei-Gardini A, Cabras F, Fortunato F, Restivo A, Zorcolo L, Scartozzi M, Zavattari P
International journal of molecular sciences 2020 Jun 24;21(12)
International journal of molecular sciences 2020 Jun 24;21(12)
No comments: Submit comment
Supportive validation
- Submitted by
- Invitrogen Antibodies (provider)
- Main image
- Experimental details
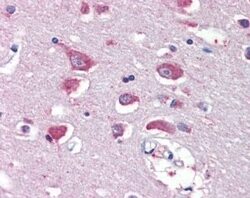
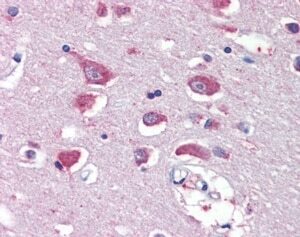
- Immunohistochemistry (PFA fixed) analysis of GluR4 using GluR4 Polyclonal Antibody (Product # PA5-18931) (5 µg/mL) in staining of paraffin embedded Human Cortex. Steamed antigen retrieval with citrate buffer pH 6, AP-staining.
Supportive validation
- Submitted by
- Invitrogen Antibodies (provider)
- Main image
- Experimental details
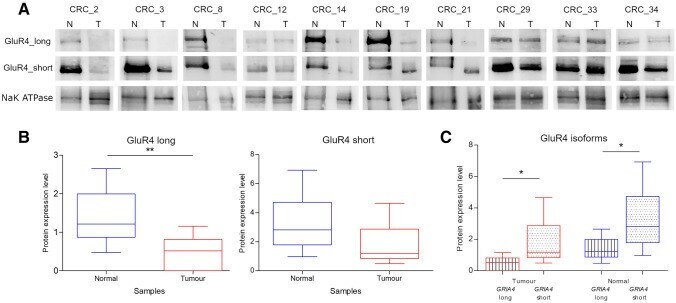
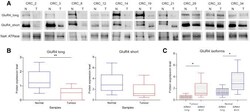
- Fig. 5 GluR4 protein expression analysis. A Representative blots of GluR4 isoforms in ten CRC paired tissue samples. NaK ATPase was used as loading control. B Box plots of GluR4 long and short expression in normal vs tumour samples. C Box plots of GluR4 isoforms within tumour and normal samples groups. Asterisks indicate statistically significant differences (* p value < 0.05, ** p value < 0.01)