Explore
 Validate
 Learn
Learn Western blot
 Immunohistochemistry
Antibody data
- Antibody Data
- Antigen structure
- References [2]
- Comments [0]
- Validations
- Immunohistochemistry [1]
- Other assay [2]
Submit
Validation data
Reference
Comment
Report error
- Product number
- PA5-42000 - Provider product page

- Provider
- Invitrogen Antibodies
- Product name
- SFTPB Polyclonal Antibody
- Antibody type
- Polyclonal
- Antigen
- Synthetic peptide
- Description
- Peptide sequence: PGALQARPGP HTQDLSEQQF PIPLPYCWLC RALIKRIQAM IPKGALAVAV Sequence homology: Cow: 86%; Dog: 100%; Guinea Pig: 100%; Human: 100%; Mouse: 92%; Rabbit: 85%; Rat: 100%; Sheep: 79%
- Reactivity
- Human, Mouse, Rat
- Host
- Rabbit
- Isotype
- IgG
- Vial size
- 100 μL
- Concentration
- 0.5 mg/mL
- Storage
- -20°C, Avoid Freeze/Thaw Cycles
Submitted references Defined conditions for long-term expansion of murine and human alveolar epithelial stem cells in three-dimensional cultures.
Human Lung Stem Cell-Based Alveolospheres Provide Insights into SARS-CoV-2-Mediated Interferon Responses and Pneumocyte Dysfunction.
Konishi S, Tata A, Tata PR
STAR protocols 2022 Jun 17;3(2):101447
STAR protocols 2022 Jun 17;3(2):101447
Human Lung Stem Cell-Based Alveolospheres Provide Insights into SARS-CoV-2-Mediated Interferon Responses and Pneumocyte Dysfunction.
Katsura H, Sontake V, Tata A, Kobayashi Y, Edwards CE, Heaton BE, Konkimalla A, Asakura T, Mikami Y, Fritch EJ, Lee PJ, Heaton NS, Boucher RC, Randell SH, Baric RS, Tata PR
Cell stem cell 2020 Dec 3;27(6):890-904.e8
Cell stem cell 2020 Dec 3;27(6):890-904.e8
No comments: Submit comment
Supportive validation
- Submitted by
- Invitrogen Antibodies (provider)
- Main image
- Experimental details
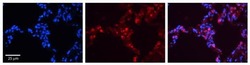
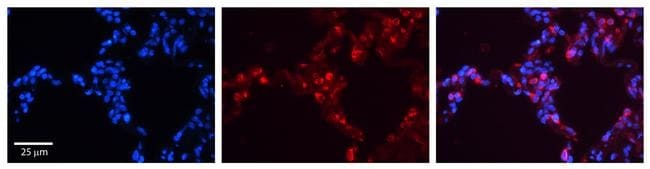
- Immunohistochemistry (paraffin-embedded) analysis of human lung tissue using an anti-Surfactant Protein B polyclonal antibody (Product # PA5-42000).; Secondary Antibody: Donkey anti-Rabbit-Cy3.
Supportive validation
- Submitted by
- Invitrogen Antibodies (provider)
- Main image
- Experimental details
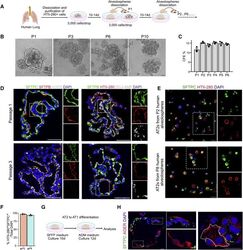
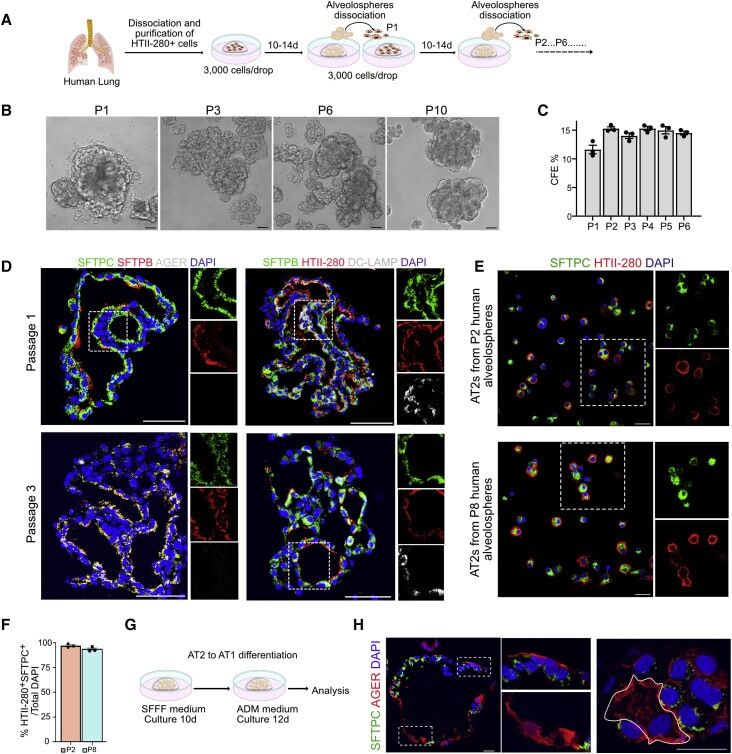
- Figure 1 Establishment of Chemically Defined Human Lung Alveolosphere Culture System (A) Schematic representation of human alveolosphere cultures and passaging in SFFF medium. (B) Representative images of human alveolospheres from different passages. Scale bar: 100 mum. (C) Quantification of the colony formation efficiency (CFE) of human alveolospheres at different passages. (D) Immunostaining for SFTPC (green), SFTPB (red), and AGER (gray) (left panel) or SFTPB (green), HTII-280 (red), and DC-LAMP (gray) (right panel) at P1 and P3 human alveolospheres cultured in SFFF medium for 14 days. (E) Immunostaining for SFTPC (green) and HTII-280 (red) in cells dissociated from alveolospheres at P2 (top) and P8 (bottom). (F) Quantification of HTII-280 + SFTPC + cells/total 4',6-diamidino-2-phenylindole (DAPI) + cells derived from alveolospheres dissociation from P2 (orange) and P8 (blue). (G) Schematic representation of human AT2 to AT1 differentiation in alveolospheres. AT2s were cultured in SFFF medium for 10 days, followed by culture in ADM for 14 days. (H) Immunostaining for SFTPC (green) and AGER (red) in human alveolospheres cultured under ADM condition for 14 days. Scale bars: 100 mum (B); 50 mum (D); 20 mum (E); 20 mum (H). DAPI (blue) shows nuclei in (D), (E), and (H). Data are presented as mean +- SEM.
- Submitted by
- Invitrogen Antibodies (provider)
- Main image
- Experimental details
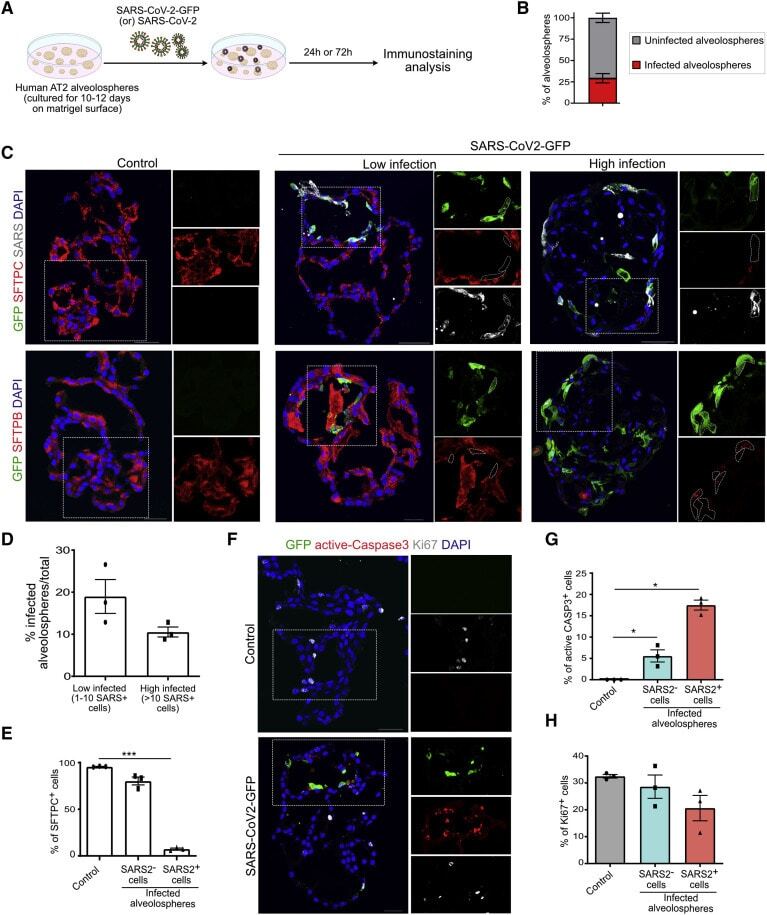
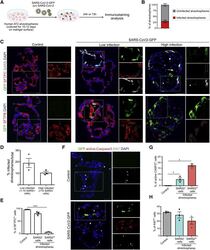
- Figure 4 SARS-CoV-2 Infection Induces Loss of Surfactants and AT2 Death (A) Schematic for SARS-CoV-2-GFP infection in human alveolospheres. Alveolospheres were cultured in SFFF medium, infected with SARS-CoV-2 virus, and collected for histological analysis. (B) Quantification of the percentage of SARS-CoV-2-infected alveolospheres. (C) Immunostaining for GFP (green), SFTPC (red), and SARS (gray) (top panel) and GFP (green) and SFTPB (red) (bottom panel) in control, ""low,"" and ""high"" SARS-CoV-2-GFP-infected human lung alveolospheres at 72 h post-infection. Scale bar: 50 mum. (D) Quantification of low-infected (1-10 SARS-CoV-2 + cells) and high-infected (10 or more SARS-CoV-2 + cells) alveolospheres. (E) Quantification of SFTPC + cells in uninfected control and SARS - and SARS + cells in virus-infected alveolospheres. (F) Immunostaining for GFP (green) in combination with the apoptotic marker active caspase 3 (red) and proliferation marker Ki67 (gray) in control and SARS-CoV-2-GFP-infected alveolospheres. Scale bar: 30 mum. (G and H) Quantification of active caspase-3 (CASP3) + (G) and Ki67 + (H) cells in uninfected control (gray), SARS-CoV-2 - cells (blue), and SARS-CoV-2 + cells in infected alveolospheres. The white box in the merged image indicates the region of single-channel images. DAPI stains nuclei (blue). All quantification data are presented as mean +- SEM.