Explore
 Validate
 Learn
Learn Western blot
 Other assay
Antibody data
- Antibody Data
- Antigen structure
- References [1]
- Comments [0]
- Validations
- Other assay [3]
Submit
Validation data
Reference
Comment
Report error
- Product number
- PA5-76145 - Provider product page

- Provider
- Invitrogen Antibodies
- Product name
- SMO Polyclonal Antibody
- Antibody type
- Polyclonal
- Antigen
- Recombinant full-length protein
- Description
- The antibody was affinity-purified from rabbit antiserum by affinity-chromatography using epitope-specific immunogen and the purity is > 95% (by SDS-PAGE).
- Reactivity
- Human, Mouse
- Host
- Rabbit
- Isotype
- IgG
- Vial size
- 100 µL
- Concentration
- 1 mg/mL
- Storage
- Store at 4°C short term. For long term storage, store at -20°C, avoiding freeze/thaw cycles.
Submitted references LncRNA MEG3 restrained pulmonary fibrosis induced by NiO NPs via regulating hedgehog signaling pathway-mediated autophagy.
Gao Q, Chang X, Yang M, Zheng J, Gong X, Liu H, Li K, Wang X, Zhan H, Li S, Feng S, Sun X, Sun Y
Environmental toxicology 2022 Jan;37(1):79-91
Environmental toxicology 2022 Jan;37(1):79-91
No comments: Submit comment
Supportive validation
- Submitted by
- Invitrogen Antibodies (provider)
- Main image
- Experimental details
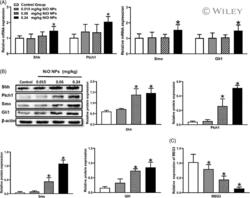
- 1 FIGURE The effects of NiO NPs on Hh pathway and MEG3 in rat lung tissues. The relative mRNA (A) and protein (B) levels of Shh, Ptch1, Smo, and Gli1 were measured by RT-qPCR ( n = 5) and Western blot ( n = 3), respectively. RT-qPCR was used to detect the expression of MEG3 (C) in rat lung tissue ( n = 5). The data are presented as mean +- SD. * P < .05, versus the control group

- Submitted by
- Invitrogen Antibodies (provider)
- Main image

- Experimental details
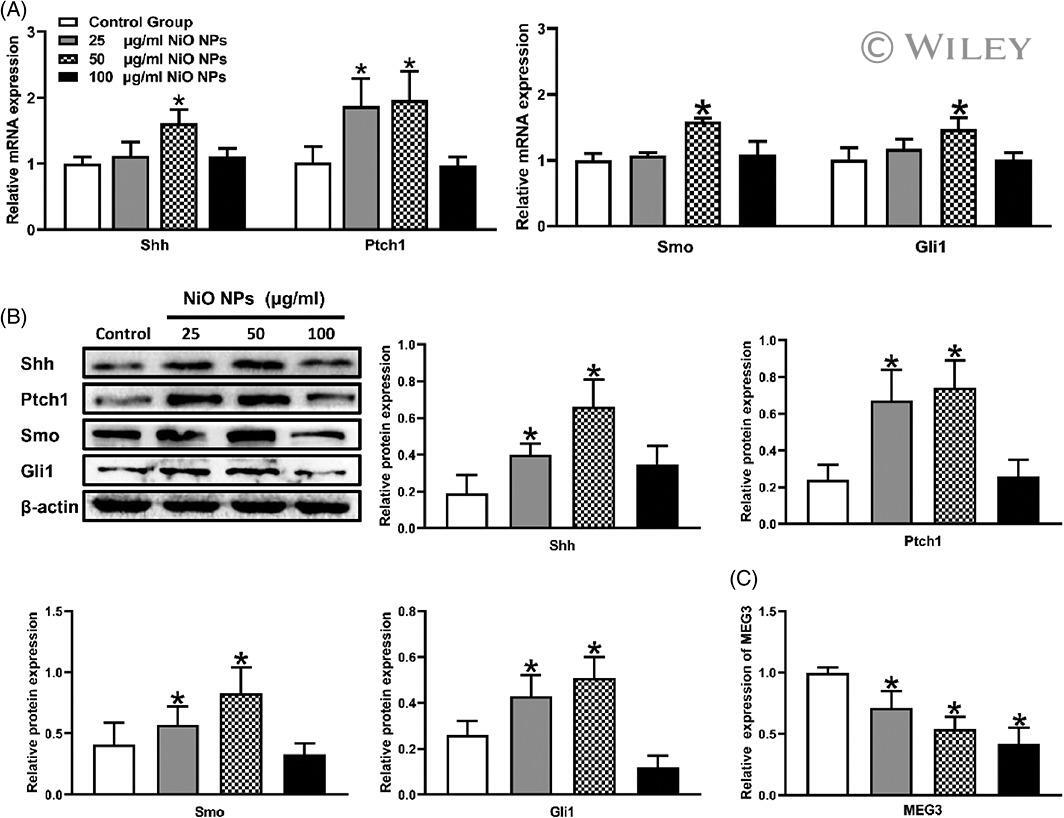
- 3 FIGURE The effects of NiO NPs on Hh pathway and MEG3 in A549 cells. The relative mRNA (A) and protein (B) levels of Shh, Ptch1 Smo, and Gli1 were measured by RT-qPCR ( n = 5) and Western blot ( n = 3), respectively. The expression of MEG3 (C) was detected by RT-qPCR in A549 cells ( n = 5). The data are presented as mean +- SD. * P < .05, versus the control group
- Submitted by
- Invitrogen Antibodies (provider)
- Main image

- Experimental details
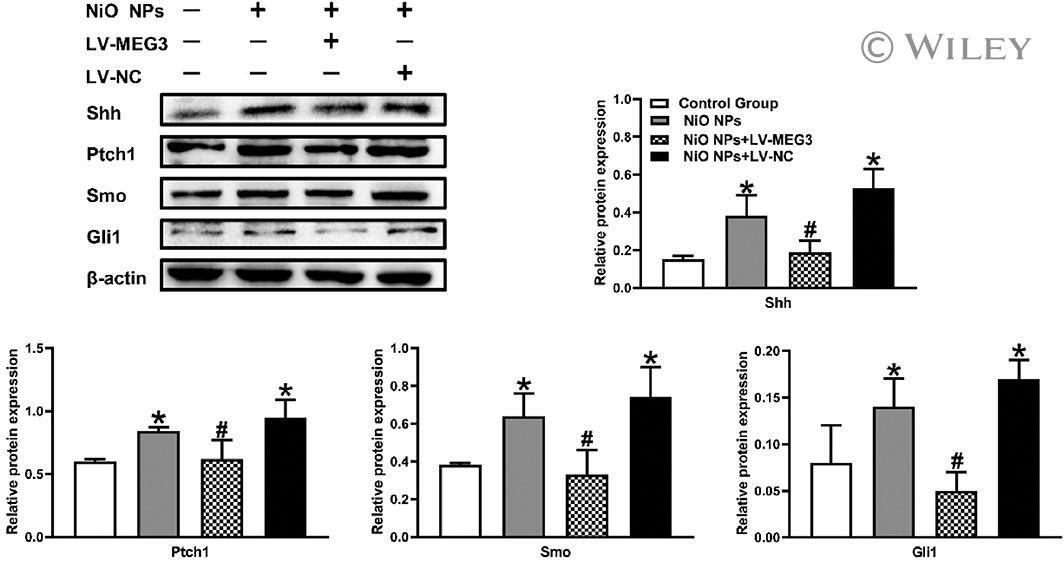
- 7 FIGURE The effects of MEG3 on Hh pathway in A549 cells treated with NiO NPs. LV-MEG3 represented A549 cells infected with lentivirus carrying full-length MEG3, and LV-NC represented A549 cells infected with lentivirus carrying empty plasmid. The relative protein levels of Shh, Ptch1, Smo, and Gli1 (A) were detected by Western blot ( n = 3). The data are presented as mean +- SD. * P < .05, versus the control group, # P < .05, versus the NiO NPs group