Explore
 Validate
 Learn
Learn Western blot
 Immunocytochemistry
 Immunohistochemistry
Antibody data
- Antibody Data
- Antigen structure
- References [19]
- Comments [0]
- Validations
- Immunocytochemistry [5]
- Other assay [16]
Submit
Validation data
Reference
Comment
Report error
- Product number
- 48-2400 - Provider product page

- Provider
- Invitrogen Antibodies
- Product name
- VGLUT1 Polyclonal Antibody
- Antibody type
- Polyclonal
- Antigen
- Synthetic peptide
- Description
- This antibody is specific for the VGLUT1 protein. On western blots, it identifies the target band at ~55 kDa. Reactivity has been confirmed with mouse brain homogenates by western blotting, with mouse hippocampus frozen sections by immunohistochemistry, and in immunofluorescence analysis with human glutamate neurons derived from iPSCs.
- Reactivity
- Human, Mouse, Rat
- Host
- Rabbit
- Isotype
- IgG
- Vial size
- 100 μg
- Concentration
- 0.25 mg/mL
- Storage
- -20°C
Submitted references Synaptosome microRNAs regulate synapse functions in Alzheimer's disease.
Olivocochlear Changes Associated With Aging Predominantly Affect the Medial Olivocochlear System.
Primary brain cell infection by Toxoplasma gondii reveals the extent and dynamics of parasite differentiation and its impact on neuron biology.
Activation of proline biosynthesis is critical to maintain glutamate homeostasis during acute methamphetamine exposure.
Astrocytic Ephrin-B1 Controls Synapse Formation in the Hippocampus During Learning and Memory.
Astrocytic Ephrin-B1 Controls Excitatory-Inhibitory Balance in Developing Hippocampus.
Direct conversion of human fibroblasts into dopaminergic neuron-like cells using small molecules and protein factors.
Small molecular compounds efficiently convert human fibroblasts directly into neurons.
Noise exposure alters MMP9 and brevican expression in the rat primary auditory cortex.
Protein kinase N1 critically regulates cerebellar development and long-term function.
Functional Consequences of Synapse Remodeling Following Astrocyte-Specific Regulation of Ephrin-B1 in the Adult Hippocampus.
Central Compensation in Auditory Brainstem after Damaging Noise Exposure.
3D Culture Method for Alzheimer's Disease Modeling Reveals Interleukin-4 Rescues Aβ42-Induced Loss of Human Neural Stem Cell Plasticity.
Neurovascular Interaction Promotes the Morphological and Functional Maturation of Cortical Neurons.
Glutamate Deregulation in Ketamine-Induced Psychosis-A Potential Role of PSD95, NMDA Receptor and PMCA Interaction.
Astrocytic Ephrin-B1 Regulates Synapse Remodeling Following Traumatic Brain Injury.
Auditory nerve synapses persist in ventral cochlear nucleus long after loss of acoustic input in mice with early-onset progressive hearing loss.
Genetic removal of matrix metalloproteinase 9 rescues the symptoms of fragile X syndrome in a mouse model.
Directing human induced pluripotent stem cells into a neurosensory lineage for auditory neuron replacement.
Kumar S, Orlov E, Gowda P, Bose C, Swerdlow RH, Lahiri DK, Reddy PH
NPJ genomic medicine 2022 Aug 8;7(1):47
NPJ genomic medicine 2022 Aug 8;7(1):47
Olivocochlear Changes Associated With Aging Predominantly Affect the Medial Olivocochlear System.
Vicencio-Jimenez S, Weinberg MM, Bucci-Mansilla G, Lauer AM
Frontiers in neuroscience 2021;15:704805
Frontiers in neuroscience 2021;15:704805
Primary brain cell infection by Toxoplasma gondii reveals the extent and dynamics of parasite differentiation and its impact on neuron biology.
Mouveaux T, Roger E, Gueye A, Eysert F, Huot L, Grenier-Boley B, Lambert JC, Gissot M
Open biology 2021 Oct;11(10):210053
Open biology 2021 Oct;11(10):210053
Activation of proline biosynthesis is critical to maintain glutamate homeostasis during acute methamphetamine exposure.
Jones B, Balasubramaniam M, Lebowitz JJ, Taylor A, Villalta F, Khoshbouei H, Grueter C, Grueter B, Dash C, Pandhare J
Scientific reports 2021 Jan 14;11(1):1422
Scientific reports 2021 Jan 14;11(1):1422
Astrocytic Ephrin-B1 Controls Synapse Formation in the Hippocampus During Learning and Memory.
Nguyen AQ, Koeppen J, Woodruff S, Mina K, Figueroa Z, Ethell IM
Frontiers in synaptic neuroscience 2020;12:10
Frontiers in synaptic neuroscience 2020;12:10
Astrocytic Ephrin-B1 Controls Excitatory-Inhibitory Balance in Developing Hippocampus.
Nguyen AQ, Sutley S, Koeppen J, Mina K, Woodruff S, Hanna S, Vengala A, Hickmott PW, Obenaus A, Ethell IM
The Journal of neuroscience : the official journal of the Society for Neuroscience 2020 Sep 2;40(36):6854-6871
The Journal of neuroscience : the official journal of the Society for Neuroscience 2020 Sep 2;40(36):6854-6871
Direct conversion of human fibroblasts into dopaminergic neuron-like cells using small molecules and protein factors.
Qin H, Zhao AD, Sun ML, Ma K, Fu XB
Military Medical Research 2020 Nov 1;7(1):52
Military Medical Research 2020 Nov 1;7(1):52
Small molecular compounds efficiently convert human fibroblasts directly into neurons.
Yang J, Cao H, Guo S, Zhu H, Tao H, Zhang L, Chen Z, Sun T, Chi S, Hu Q
Molecular medicine reports 2020 Dec;22(6):4763-4771
Molecular medicine reports 2020 Dec;22(6):4763-4771
Noise exposure alters MMP9 and brevican expression in the rat primary auditory cortex.
Park SS, Lee DH, Lee SM, Lee CH, Kim SY
BMC neuroscience 2020 Apr 25;21(1):16
BMC neuroscience 2020 Apr 25;21(1):16
Protein kinase N1 critically regulates cerebellar development and long-term function.
zur Nedden S, Eith R, Schwarzer C, Zanetti L, Seitter H, Fresser F, Koschak A, Cameron AJ, Parker PJ, Baier G, Baier-Bitterlich G
The Journal of clinical investigation 2018 May 1;128(5):2076-2088
The Journal of clinical investigation 2018 May 1;128(5):2076-2088
Functional Consequences of Synapse Remodeling Following Astrocyte-Specific Regulation of Ephrin-B1 in the Adult Hippocampus.
Koeppen J, Nguyen AQ, Nikolakopoulou AM, Garcia M, Hanna S, Woodruff S, Figueroa Z, Obenaus A, Ethell IM
The Journal of neuroscience : the official journal of the Society for Neuroscience 2018 Jun 20;38(25):5710-5726
The Journal of neuroscience : the official journal of the Society for Neuroscience 2018 Jun 20;38(25):5710-5726
Central Compensation in Auditory Brainstem after Damaging Noise Exposure.
Schrode KM, Muniak MA, Kim YH, Lauer AM
eNeuro 2018 Jul-Aug;5(4)
eNeuro 2018 Jul-Aug;5(4)
3D Culture Method for Alzheimer's Disease Modeling Reveals Interleukin-4 Rescues Aβ42-Induced Loss of Human Neural Stem Cell Plasticity.
Papadimitriou C, Celikkaya H, Cosacak MI, Mashkaryan V, Bray L, Bhattarai P, Brandt K, Hollak H, Chen X, He S, Antos CL, Lin W, Thomas AK, Dahl A, Kurth T, Friedrichs J, Zhang Y, Freudenberg U, Werner C, Kizil C
Developmental cell 2018 Jul 2;46(1):85-101.e8
Developmental cell 2018 Jul 2;46(1):85-101.e8
Neurovascular Interaction Promotes the Morphological and Functional Maturation of Cortical Neurons.
Wu KW, Mo JL, Kou ZW, Liu Q, Lv LL, Lei Y, Sun FY
Frontiers in cellular neuroscience 2017;11:290
Frontiers in cellular neuroscience 2017;11:290
Glutamate Deregulation in Ketamine-Induced Psychosis-A Potential Role of PSD95, NMDA Receptor and PMCA Interaction.
Lisek M, Ferenc B, Studzian M, Pulaski L, Guo F, Zylinska L, Boczek T
Frontiers in cellular neuroscience 2017;11:181
Frontiers in cellular neuroscience 2017;11:181
Astrocytic Ephrin-B1 Regulates Synapse Remodeling Following Traumatic Brain Injury.
Nikolakopoulou AM, Koeppen J, Garcia M, Leish J, Obenaus A, Ethell IM
ASN neuro 2016 Jan-Feb;8(1):1-18
ASN neuro 2016 Jan-Feb;8(1):1-18
Auditory nerve synapses persist in ventral cochlear nucleus long after loss of acoustic input in mice with early-onset progressive hearing loss.
McGuire B, Fiorillo B, Ryugo DK, Lauer AM
Brain research 2015 Apr 24;1605:22-30
Brain research 2015 Apr 24;1605:22-30
Genetic removal of matrix metalloproteinase 9 rescues the symptoms of fragile X syndrome in a mouse model.
Sidhu H, Dansie LE, Hickmott PW, Ethell DW, Ethell IM
The Journal of neuroscience : the official journal of the Society for Neuroscience 2014 Jul 23;34(30):9867-79
The Journal of neuroscience : the official journal of the Society for Neuroscience 2014 Jul 23;34(30):9867-79
Directing human induced pluripotent stem cells into a neurosensory lineage for auditory neuron replacement.
Gunewardene N, Bergen NV, Crombie D, Needham K, Dottori M, Nayagam BA
BioResearch open access 2014 Aug 1;3(4):162-75
BioResearch open access 2014 Aug 1;3(4):162-75
No comments: Submit comment
Supportive validation
- Submitted by
- Invitrogen Antibodies (provider)
- Main image

- Experimental details
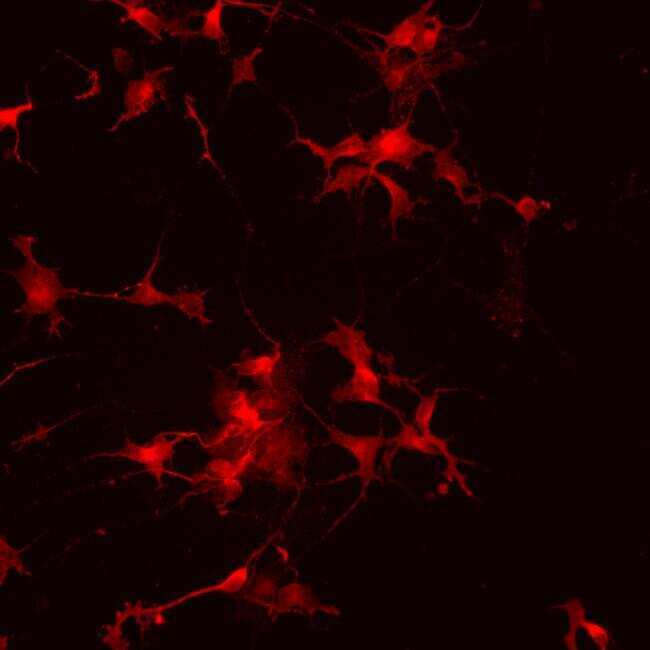
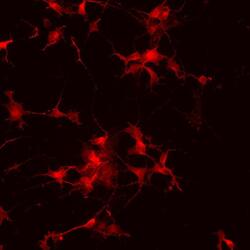
- Immunofluorescence analysis of vGlut1 (red) in human glutamate neurons derived from iPSCs. The cells were fixed with 4% paraformaldehyde for 10 minutes, permeabilized with 0.2% Triton X-100 in PBS for 10 minutes, and blocked with 5% donkey serum in PBS for 15 minutes at room temperature. Cells were stained with a vGlut1 rabbit polyclonal antibody (Product # 48-2400) diluted at 1:1000 in 5% donkey serum overnight at 4°C, and then incubated with a Goat anti-Rabbit IgG (H+L) Secondary Antibody, Alexa Fluor® 546 conjugate (Product # A-11010) at a dilution of 1:1000 for 1 hour at room temperature (green). Note: Data courtesy of Innovators Program.

- Submitted by
- Invitrogen Antibodies (provider)
- Main image
- Experimental details
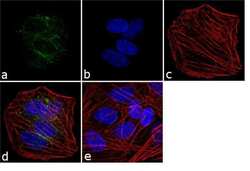
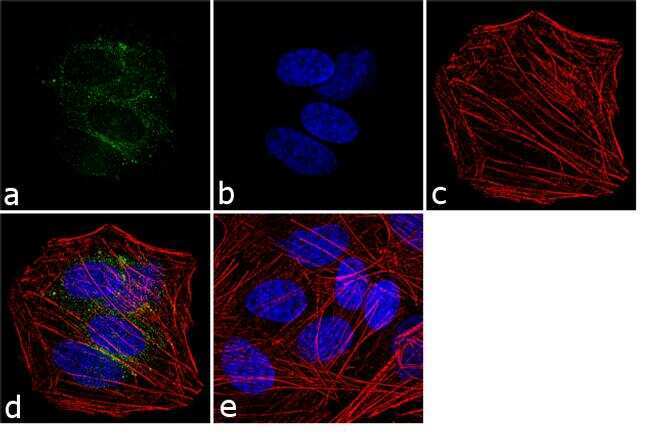
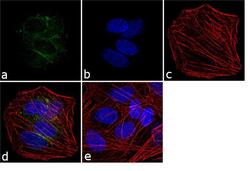
- Immunofluorescence analysis of VGLUT1 was performed using 70% confluent log phase SH-SY5Y cells. The cells were fixed with 4% paraformaldehyde for 10 minutes, permeabilized with 0.1% Triton™ X-100 for 10 minutes, and blocked with 1% BSA for 1 hour at room temperature. The cells were labeled with VGLUT1 Rabbit Polyclonal Antibody (Product # 48-2400) at 2 µg/mL in 0.1% BSA and incubated for 3 hours at room temperature and then labeled with Goat anti-Rabbit IgG (H+L) Superclonal™ Secondary Antibody, Alexa Fluor® 488 conjugate (Product # A27034) at a dilution of 1:2000 for 45 minutes at room temperature (Panel a: green). Nuclei (Panel b: blue) were stained with SlowFade® Gold Antifade Mountant with DAPI (Product # S36938). F-actin (Panel c: red) was stained with Alexa Fluor® 555 Rhodamine Phalloidin (Product # R415, 1:300). Panel d represents the merged image showing cytoplasmic localization. Panel e shows the no primary antibody control. The images were captured at 60X magnification.
- Submitted by
- Invitrogen Antibodies (provider)
- Main image

- Experimental details
- Immunofluorescence analysis of vGlut1 (red) in human glutamate neurons derived from iPSCs. The cells were fixed with 4% paraformaldehyde for 10 minutes, permeabilized with 0.2% Triton X-100 in PBS for 10 minutes, and blocked with 5% donkey serum in PBS for 15 minutes at room temperature. Cells were stained with a vGlut1 rabbit polyclonal antibody (Product # 48-2400) diluted at 1:1000 in 5% donkey serum overnight at 4°C, and then incubated with a Goat anti-Rabbit IgG (H+L) Secondary Antibody, Alexa Fluor® 546 conjugate (Product # A-11010) at a dilution of 1:1000 for 1 hour at room temperature (green). Note: Data courtesy of Innovators Program.
- Submitted by
- Invitrogen Antibodies (provider)
- Main image
- Experimental details
- Immunofluorescence analysis of vGlut1 (red) in human glutamate neurons derived from iPSCs. The cells were fixed with 4% paraformaldehyde for 10 minutes, permeabilized with 0.2% Triton X-100 in PBS for 10 minutes, and blocked with 5% donkey serum in PBS for 15 minutes at room temperature. Cells were stained with a vGlut1 rabbit polyclonal antibody (Product # 48-2400) diluted at 1:1000 in 5% donkey serum overnight at 4°C, and then incubated with a Goat anti-Rabbit IgG (H+L) Secondary Antibody, Alexa Fluor® 546 conjugate (Product # A-11010) at a dilution of 1:1000 for 1 hour at room temperature (green). Note: Data courtesy of Innovators Program.

- Submitted by
- Invitrogen Antibodies (provider)
- Main image
- Experimental details
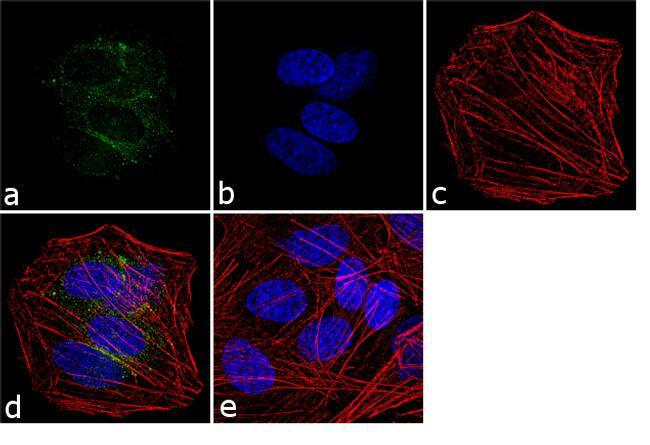
- Immunofluorescence analysis of VGLUT1 was performed using 70% confluent log phase SH-SY5Y cells. The cells were fixed with 4% paraformaldehyde for 10 minutes, permeabilized with 0.1% Triton™ X-100 for 10 minutes, and blocked with 1% BSA for 1 hour at room temperature. The cells were labeled with VGLUT1 Rabbit Polyclonal Antibody (Product # 48-2400) at 2 µg/mL in 0.1% BSA and incubated for 3 hours at room temperature and then labeled with Goat anti-Rabbit IgG (Heavy Chain) Superclonal™ Secondary Antibody, Alexa Fluor® 488 conjugate (Product # A27034) at a dilution of 1:2000 for 45 minutes at room temperature (Panel a: green). Nuclei (Panel b: blue) were stained with SlowFade® Gold Antifade Mountant with DAPI (Product # S36938). F-actin (Panel c: red) was stained with Alexa Fluor® 555 Rhodamine Phalloidin (Product # R415, 1:300). Panel d represents the merged image showing cytoplasmic localization. Panel e shows the no primary antibody control. The images were captured at 60X magnification.
Supportive validation
- Submitted by
- Invitrogen Antibodies (provider)
- Main image
- Experimental details
- NULL
- Submitted by
- Invitrogen Antibodies (provider)
- Main image
- Experimental details
- NULL
- Submitted by
- Invitrogen Antibodies (provider)
- Main image
- Experimental details
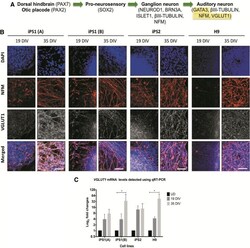
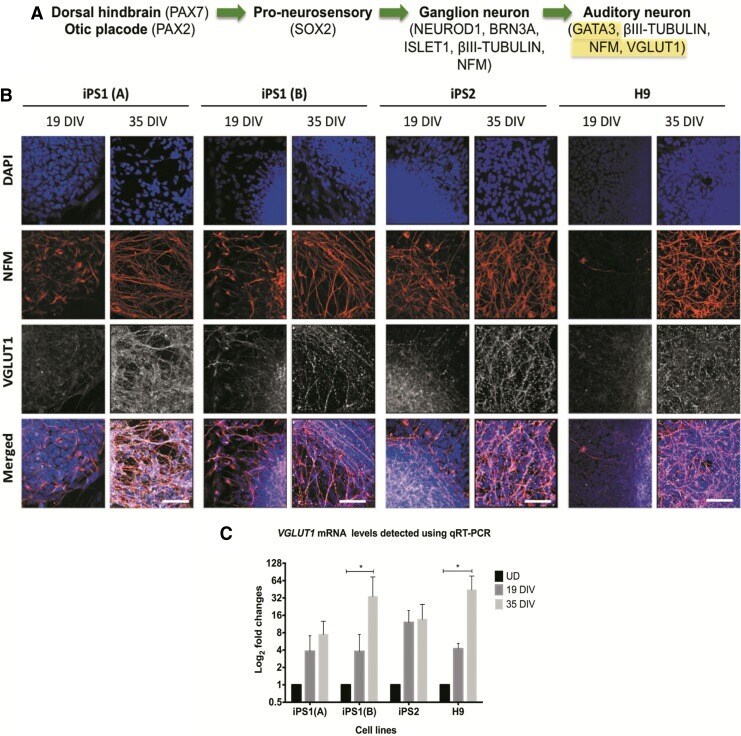
- FIG. 6. Expression of VGLUT1 in the hiPSC and hESC neurospheres at 19 and 35 DIV. (A) VGLUT1 is expressed in developing ANs. (B) Using immunostaining, an increase in the expression of VGLUT1 was observed at 35 DIV. Scale bar=50mum (relative to all images). (C) The qRT-PCR data show the fold changes of the gene encoding VGLUT1 ( SLC17A7 ) at 19 and 35 DIV. The results are presented as fold changes relative to the endogenous control ss-ACTIN and the undifferentiated controls. Each point on the graph represents mean+-SD ( n =3). * p
- Submitted by
- Invitrogen Antibodies (provider)
- Main image
- Experimental details
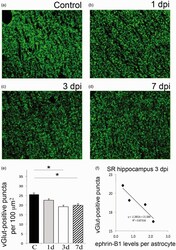
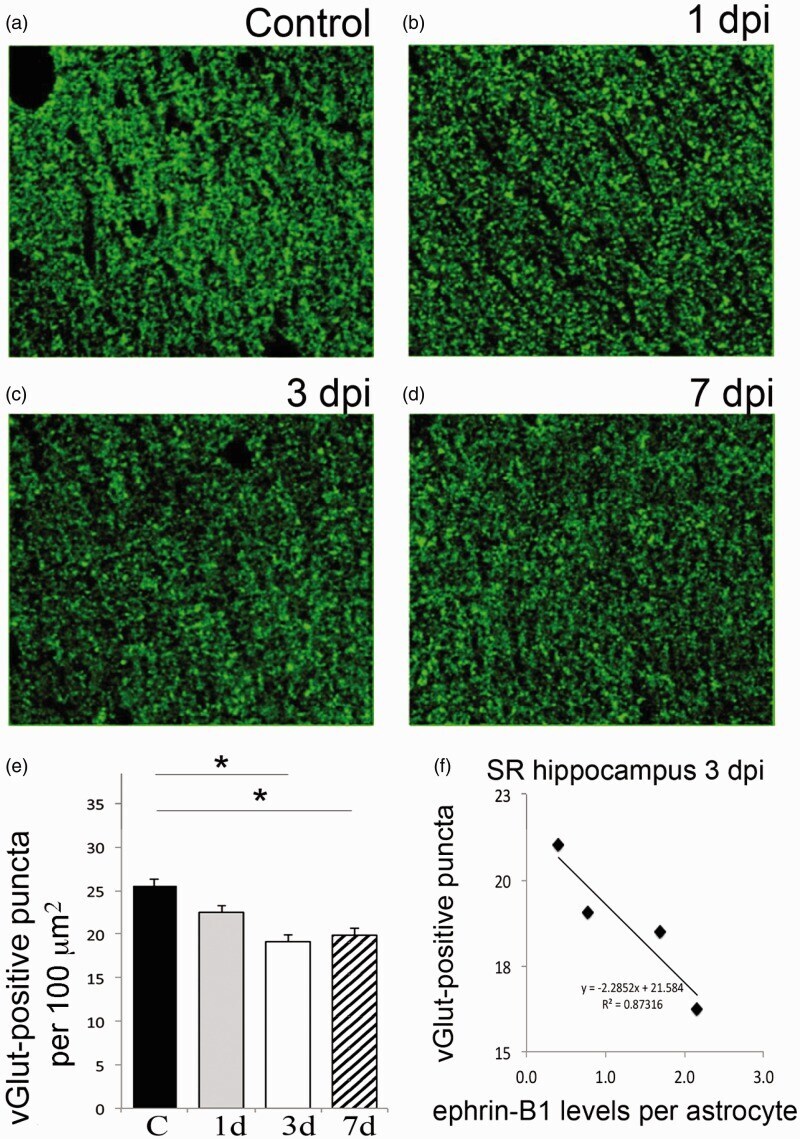
- Figure 4. Moderate CCI triggers a significant downregulation of vGlut1-positive glutamatergic innervation of CA1 hippocampal neurons. We have analyzed vGlut1-positive puncta in SR area of the CA1 hippocampus, which immunolabels terminals of CA3 neurons innervating dendrites of CA1 neurons. (a-d) Fluorescent images show a reduced vGlut1-positive puncta in SR at 3 (c) and 7 dpi (d) as compared with control (a), suggesting a reduction in excitatory innervation of CA1 neurons following TBI. (e) Graph shows vGlut1-positive puncta per 100 um 2 area (mean +- SEM ; n = 3-4 mice, one-way ANOVA followed by Tukey's post hoc analysis, * p < .05). (f) Graph shows a negative correlation between the mean levels of ephrin-B1 per ephrin-B1-positive astrocyte ( x axis, n = 100-300 astrocytes per animal) and the average number of vGlut1-positive puncta per 100 um 2 area ( y axis, n = 50-100 images per animal) in SR area of CA1 hippocampus of four mice at 3 dpi. SR = stratum radiatum.
- Submitted by
- Invitrogen Antibodies (provider)
- Main image
- Experimental details
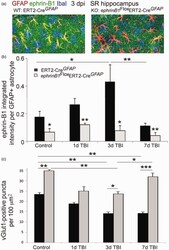
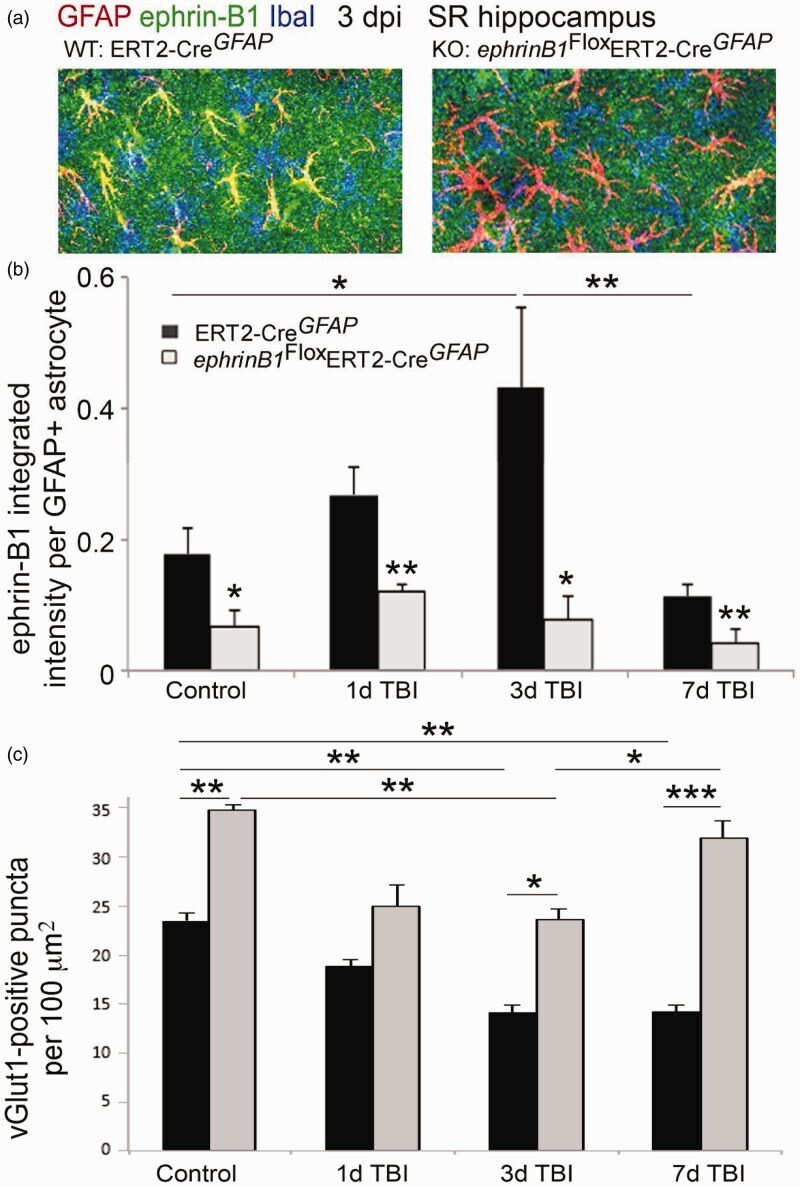
- Figure 5. Astrocyte-specific deletion of ephrin-B1 triggers accelerated recovery of vGlut1-positive excitatory presynaptic sites in SR area of CA1 hippocampus at 7 dpi. (a) Confocal images show increased ephrin-B1 immunoreactivity (green) in WT (left panel), but not ephrin-B1 KO astrocytes (right panel) in the SR at 3 dpi. Note that the remaining ephrin-B1-positive immunoreactivity (green) in ephrin-B1 KO (right panel) represent ephrin-B1 expression in dendrites of CA1 neurons. (b, c) Graphs show integrated intensity of ephrin-B1 immunoreactivity per GFAP-positive astrocyte (b) and vGlut1-positive puncta per 100 um 2 area (mean +- SEM ; n = 3-4 mice, two-way ANOVA, followed by Bonferroni post hoc analysis * p < .05, ** p < .01, *** p < .001).
- Submitted by
- Invitrogen Antibodies (provider)
- Main image
- Experimental details
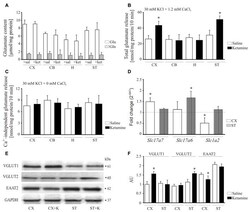
- Figure 8 Effect of ketamine on synaptosomal glutamate concentration and release. Synaptosomal glutamate and glutamine content (A) . Total glutamate release evaluated by fluorometric assay over 10 min in the presence of 2 mM CaCl 2 (B) . Ca 2+ -independent glutamate release measured in the absence of calcium in the reaction mixture (C) . The expression of Slc17a7 , Slc17a6 and Slc1a2 evaluated using real-time PCR (D) . The fold change was calculated using comparative 2 Ct method following normalization to endogenous Gapdh expression used as an internal control. The expression level in saline-treated control was taken as 1 and is presented as a dotted line. The level of VGLUT1, VGLUT2 and excitatory amino acid transporters 2 (EAAT2) was analyzed by Western blot (E) and the intensity of bands was quantified densitometrically (F) . The results are presented as AU obtained after normalization to endogenous GAPDH level. * P < 0.05 ketamine treated vs. saline, n = 5. CX, cortex; CB, cerebellum; H, hippocampus; ST, striatum. CX + K; cortex + ketamine, ST + K, striatum + ketamine.
- Submitted by
- Invitrogen Antibodies (provider)
- Main image

- Experimental details
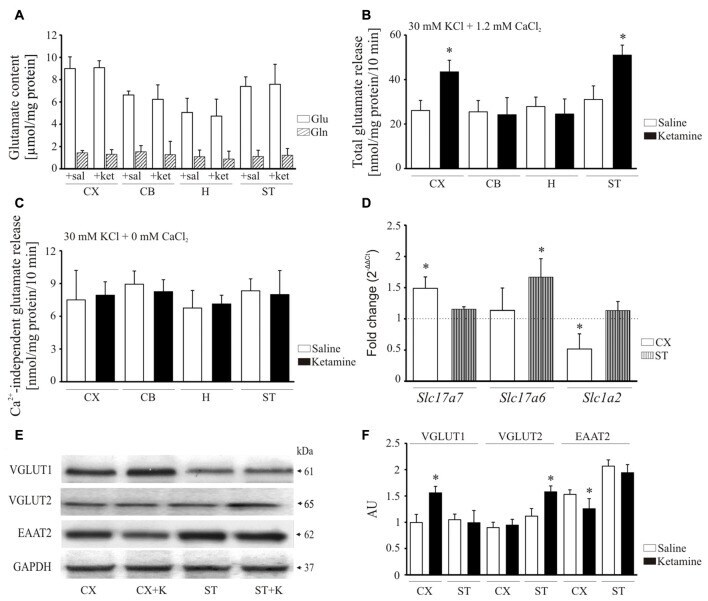
- Fig. 3 The expression of vesicular neural transporters in the primary auditory cortex and the inferior colliculus. a The mRNA expression levels demonstrated a decrease in VGLUT1 in the primary auditory cortex and an increase in VGLUT2 in the inferior colliculus in the noise group compared with the control group. b The protein expression levels showed a decrease in VGLUT1 in the primary auditory cortex in the noise group compared with the control group. ( LT left, RT right, AUD auditory cortex, IC inferior colliculus) (*P < 0.05)
- Submitted by
- Invitrogen Antibodies (provider)
- Main image
- Experimental details
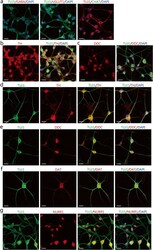
- Fig. 3 The expression of neuronal markers for subtype identification in the induced neuron-like cells. a-c Immunocytochemical analysis of induced neurons for the gamma-aminobutyric acid (GABA), and vesicular glutamate transporter 1 (vGlut1), choline acetyltransferase (CHAT), tyrosine hydroxylase (TH), and dopa decarboxylase (DDC) in induced neurons after 4 days of chemical induction. Scale bars = 25 mum. d-g Immunocytochemical analysis of the expression of TH, DDC, DAT, and NURR1 in induced neurons after 14 days of chemical induction. Scale bars = 25 mum

- Submitted by
- Invitrogen Antibodies (provider)
- Main image

- Experimental details
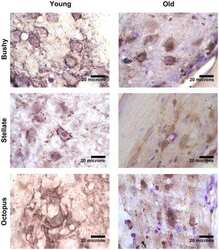
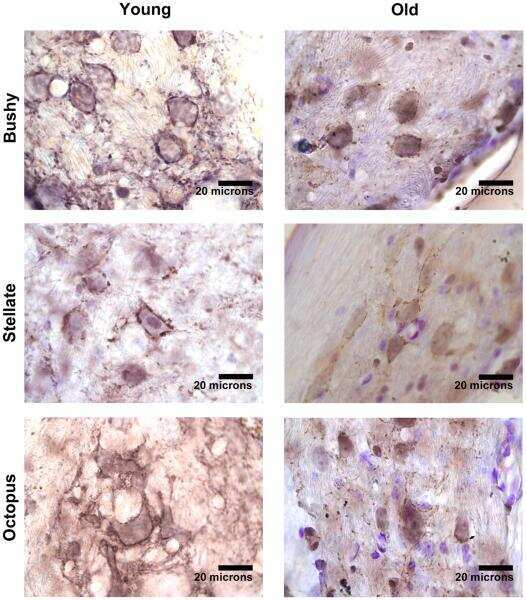
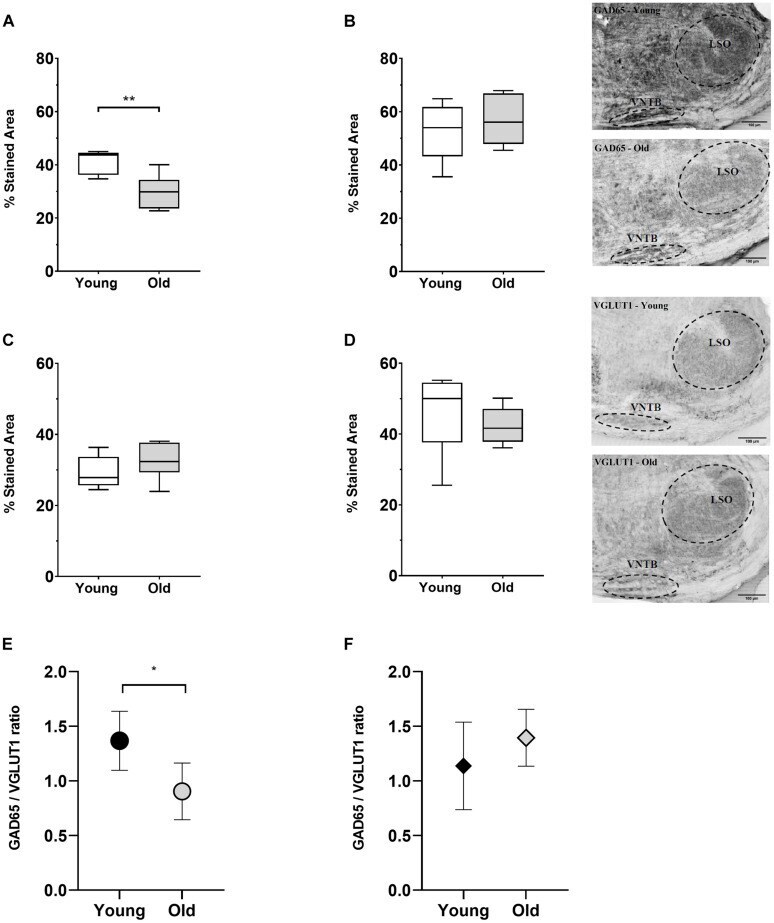
- FIGURE 8 Age-associated changes of inhibitory and excitatory synaptic markers. The first row shows boxplots representing the fraction of GAD65-immunoreactive area of young ( n = 5) and old mice ( n = 6, gray-filled boxes) in the VNTB (A) and LSO (B) . For the VNTB in (A) , a significant difference was found between young and old mice (unpaired t test with Welch's correction, p = 0.0081, t = 3.401, df = 8.850). The images on the right correspond to an example of GAD65 staining at 10x in a young male mouse (top, 3 m.o.) and an old male mouse (bottom, 26 m.o.). The second row is showing boxplots that represent the fraction of VGLUT1-immunoreactive area of young ( n = 5) and old mice ( n = 6, gray-filled boxes) in the VNTB (C) and LSO (D) . On the right, there are two examples of staining of VGLUT1 at 10x for a young female mouse (top, 2 m.o.) and an old female mouse (bottom, 28 m.o.). The last row shows a comparison of the GAD65/VGLUT1 ratio between young and old animals, where (E) represents the VNTB and (F) the LSO, and the error bars indicate the standard error of the mean. In the case of VNTB (E) , a significant difference was found between the two groups (unpaired t test with Welch's correction, p = 0.0192, t = 2.881, df = 8.507). GAD65, glutamic acid decarboxylase 65-kilodalton isoform; LSO, lateral superior olive; VGLUT1, vesicular glutamate transporter 1; VNTB, ventral nucleus of the trapezoid body. The p -values are defined as: * p < 0.05 and ** p < 0.001.
- Submitted by
- Invitrogen Antibodies (provider)
- Main image
- Experimental details
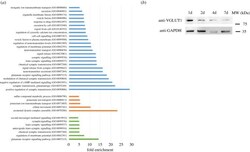
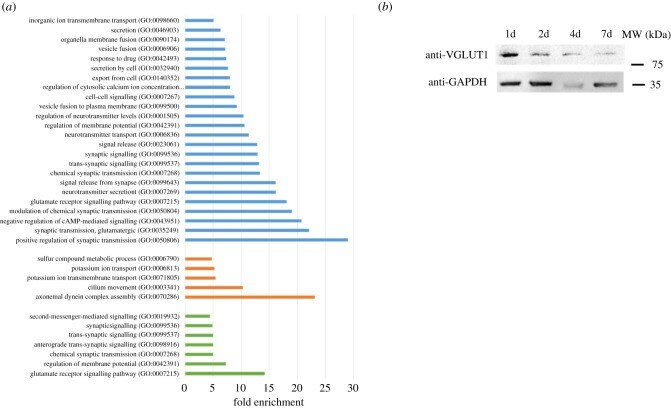
- Figure 5 . Gene ontology analysis of enriched downregulated pathways in brain cells. ( a ) Enriched GO pathways for downregulated DEGs that are shared for all time point infected brain cells (blue bars), shared for 1d and 2d time points (orange bars) and shared for 7d and 14d time points (green bars). Pathways were selected with an FDR of 0.05 and a minimum enrichment of 4. The name of each GO pathway is indicated on the left part of the figure. Bars represent the enrichment fold. ( b ) Western blot showing the expression of Grm1 (VGLUT1) in neurons after 1, 2, 4 and 7 days of infection. GAPDH is used as a loading control.
- Submitted by
- Invitrogen Antibodies (provider)
- Main image
- Experimental details
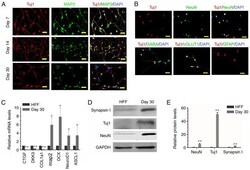
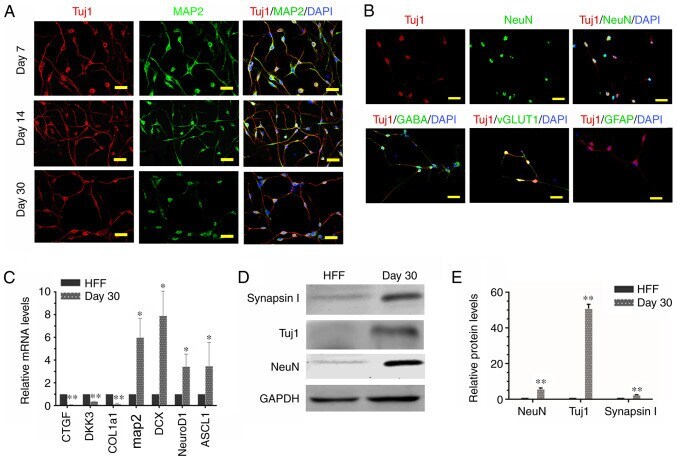
- Figure 3. Characteristics of iNs. (A) iNs exhibited bipolar neuronal morphologies and expressed tuj1 (red) and MAP2 (green) at different phases (day 7, 14 and 30). (B) iNs were stained for NeuN, GABA, vGLUT1 and GFAP (all green) on day 30. Scale bar, 50 um. (C) Reverse transcription-quantitative PCR analysis revealed that in comparison with HFFs, there was a significant increase in gene expression levels of MAP2, DCX, NeuroD1 and ASCL1 in iNs, whereas human fibroblast-specific genes were downregulated in iNs on day 30. Data are presented as the mean +- SD. (D) Western blot analysis of the protein expression levels of Tuj1, NeuN and GAPDH in HFFs and iNs. (E) Graphs show the semi-quantification of the western blot analysis. n=3 independent experiments. Data are presented as the mean +- SD. Unpaired Student's t-tests were used to compare data. *P
- Submitted by
- Invitrogen Antibodies (provider)
- Main image

- Experimental details
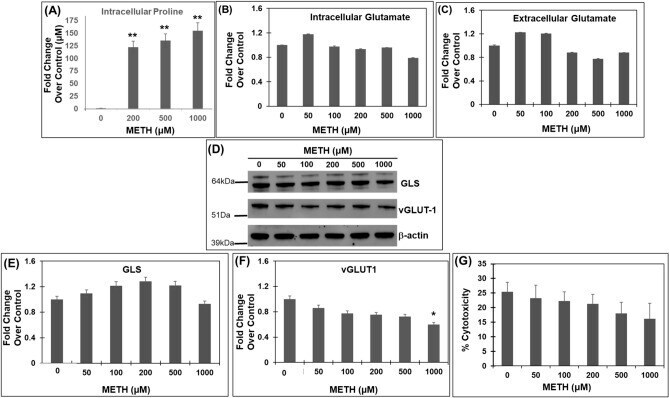
- Figure 3 Acute METH exposure increases levels of proline without increasing glutamate levels. ( A ) Effect of acute METH treatment on proline levels-SH-SY5Y cells were treated acutely with METH at concentrations 200, 500, and 1000 uM. After treatment, the cells were harvested and the intracellular proline levels were measured by the acid-ninhydrin assay, that specifically detects proline. ( B , C ) Effect of Acute METH treatment on glutamate levels. SH-SY5Y cells were treated with increasing concentrations of METH for 24 h. Post-treatment cells were centrifuged and the cell extracts were used to measure intracellular glutamate while the cell-free supernatants were used to measure extracellular glutamate. Data are plotted as fold change in glutamate levels in METH-treated cells compared to control cells. ( D - F ) Effects of acute METH treatment on GLS and vGLUT1 expression--SH-SY5Y cells were treated with varying concentrations of METH under acute conditions. Cells were then harvested and cellular lysates were subjected to immunoblot analyses. ( D ) Representative immunoblot of GLS and vGLUT1 expression (n = 3). Densitometry analysis of GLS-1 expression in ( E ) and vGLUT1 expression in ( F ) normalized to beta-actin. ( G ) Acute METH treatment does not induce cytotoxicity--SH-SY5Y cells were treated with increasing concentrations of METH for 24 h, following which the cells were centrifuged and culture supernatant were collected. Cytotoxicity was measured by LDH release assay
- Submitted by
- Invitrogen Antibodies (provider)
- Main image
- Experimental details
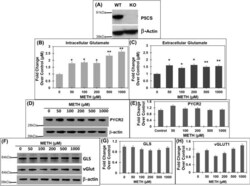
- Figure 4 METH treatment of P5CS knockout ( P5CS -KO) SH-SY5Y cells significantly increases glutamate levels. The P5CS- KO SH-SY5Y cells were generated from wild-type SH-SY5Y cells using CRISPR/Cas9 system. Following which the P5CS -KO cells were treated with METH for 24 h and cellular lysates and cell-free supernatants were collected. ( A ) Western blot showing a lack of P5CS expression in P5CS -KO vs. WT SH-SY5Y cells (n = 3). beta-actin was used as a loading control. ( B , C ) Effect of METH on glutamate in P5CS -KO cells. ( B ) The cell extracts were used to measure intracellular glutamate while ( C ) the cell-free supernatants were used to measure extracellular glutamate (n = 3). A marked increase in levels of both intracellular and extracellular glutamate was obtained in P5CS -KO cells after METH treatment. ( D,E ) Effect of acute METH treatment on PYCR2 in P5CS -KO cells. Representative western blot of PYCR2 in ( D ) following acute METH treatment (n = 3). beta-actin was used as a loading control. ( E ) Densitometric analyses of PYCR2 normalized to beta-actin. ( F - H ) Effect of acute METH treatment on GLS and vGlut1 in P5CS -KO cells. ( F ) Representative western blot of GLS and vGLUT1 in METH-treated P5CS -KO SH-SY5Y cells (n = 3). beta-actin was used as a loading control. ( G , H ) Densitometric analyses of GLS and vGLUT1 western blot normalized to beta-actin. Data are presented as the mean +- SEM of at least three independent experiments. *p < 0.05, **p < 0.005 rep

- Submitted by
- Invitrogen Antibodies (provider)
- Main image
- Experimental details
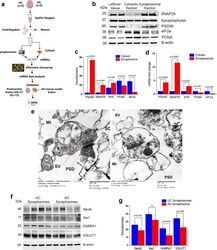
- Extraction and characterization of synaptosomes. a Brief workflow of the current study. b Immunoblotting analysis of synaptic (SNAP25, synaptophysin and PSD95) and cytosolic (elF1a and PCNA) proteins in cytosolic fraction, synaptosomal fraction and leftover tissue debris of unaffected control postmortem brain tissues. c Densitometry analysis of synaptic and cytosolic proteins. Synaptic proteins levels (PSD95; P = 0.003), (SNAP25; P = 0.0061), (Synaptophysin; P = 0.026) were significantly higher in synaptosomes and cytosolic proteins (elF1a; P = 0.012) and (PCNA; P = 0.018) levels were significantly lower in synaptosomes relative to cytosol. d qRT-PCR analysis for mRNA fold change analysis of synaptic and cytosolic genes in cytosolic and synaptosomal fractions ( n = 5). e TEM analysis of synapse assembly in synaptosomal fraction from unaffected control and AD patients' postmortem brains (scale bar 500 nm magnification). Electron micrograph shows synapse components: Mt mitochondria, SV synaptic vesicles, PSD postsynaptic density, SC synaptic cleft. f Immunoblotting analysis of brain cells markers (Neuron-NeuN; Microglia-Iba1), excitatory synapse marker (VGLUT1) and inhibitory synapse marker (GABARA1) proteins in unaffected controls ( n = 4) and AD ( n = 4) synaptosomes. g Densitometry analysis of NeuN, Iba1, VGLUT1, and GABARA1 proteins in unaffected controls and AD synaptosomes. All blots are driven from the same experiment and were proceed parallelly ( b , f ). Values in the

- Submitted by
- Invitrogen Antibodies (provider)
- Main image
- Experimental details
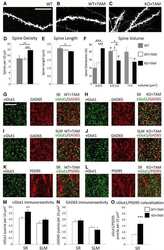
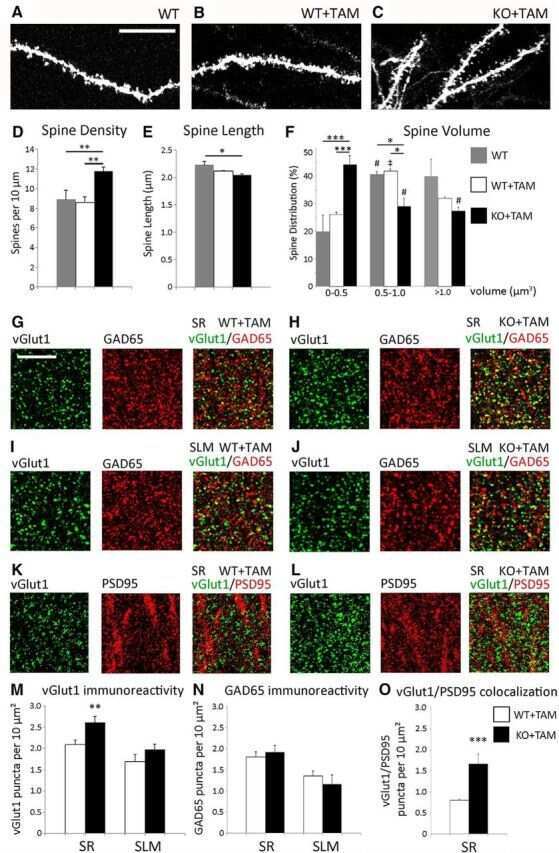
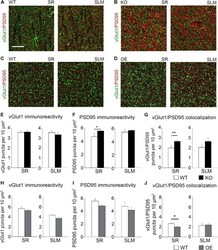
- FIGURE 5 Astrocytic ephrin-B1 negatively regulates the number of excitatory synaptic sites in CA1 hippocampus after fear conditioning. (A-D) Confocal images showing vGlut1 (green) and PSD95 (red) immunolabeling in WT (A,C) , KO (B) , and OE (D) in SR and SLM areas of the adult CA1 hippocampus 1 h after contextual recall. Scale bar is 20 mum. (E-G) Graphs show the density of vGlut1-positive puncta (E) , PSD95-postive puncta (F) , and vGlut1/PSD95 co-localization (G) per 10 mum 2 in the SR and SLM areas of the CA1 hippocampus of WT and KO mice. There was no difference in vGlut1 positive puncta between WT and KO mice. However, KO mice showed a significant increase in PSD95 puncta ( F , t- test, t ( 32 ) = 2.104, p = 0.043) and vGlut1/PSD95 colocalization ( G , t- test, t ( 29 ) = 2.828, p = 0.008) in the SR CA1 hippocampus. Graphs show mean values and error bars represent SEM. (H-J) Graphs show the density of vGlut1-positive puncta (H) , PSD95-positive puncta (I) , and vGlut1/PSD95 co-localization (J) in the SR and SLM areas of the CA1 hippocampus of WT and OE mice. There was no significant difference in vGlut1 (H) or PSD95 (I) puncta between WT and OE mice. OE mice showed a significant decrease in vGlut1/PSD95 colocalization ( J , t- test, t ( 32 ) = 2.433, p = 0.022). Graphs show mean values and error bars represent SEM; * p < 0.05, ** p < 0.01.

- Submitted by
- Invitrogen Antibodies (provider)
- Main image

- Experimental details
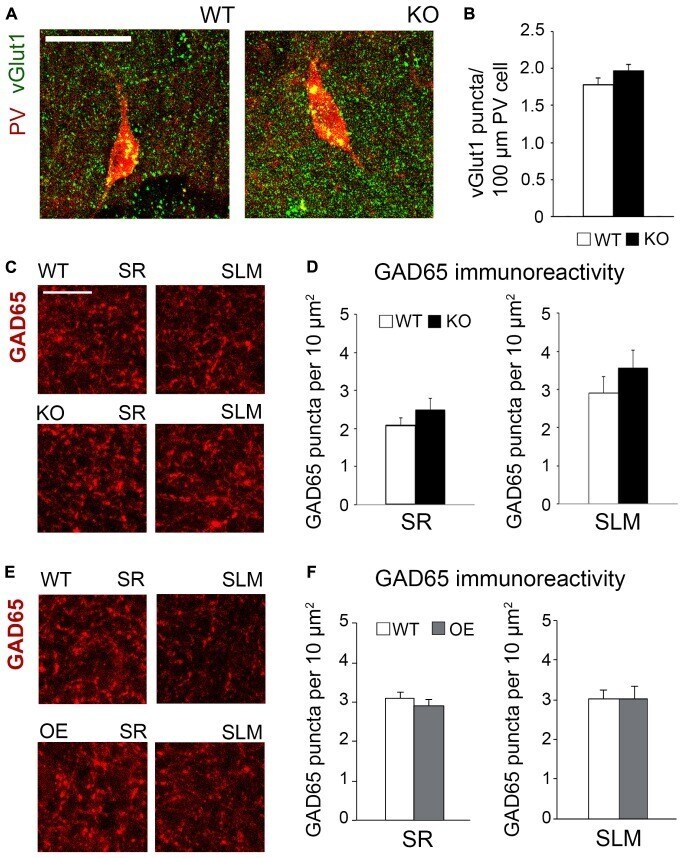
- FIGURE 6 Changes in astrocytic ephrin-B1 levels did not affect the excitatory vGlut1-positive puncta on PV interneurons in SP areas of CA1 hippocampus and inhibitory GAD65-positive puncta. (A) Confocal images showing vGlut1 (green) and PV (red) co-immunolabeling in the dorsal CA1 hippocampus of WT and KO adult mice 1 h after contextual recall. Scale bar is 100 mum. (B) Graphs show immunoreactivity of vGlut1 positive puncta per 100 mum PV cell in dorsal CA1 hippocampus of trained WT and KO mice. There was no significant difference in vGlut1/PV colocalization between trained WT and KO mice. (C,E) Confocal images showing GAD65 (red) immunolabeling in SR and SLM areas of the CA1 hippocampus of KO (C) or OE (E) mice and their WT counterparts 1 h after contextual recall. Scale bar is 50 mum. (D) Graphs show GAD65-positive puncta in the SR and SLM area of the CA1 hippocampus of trained WT and KO mice. There was no significant difference in the number of inhibitory GAD65-positive puncta between WT and KO mice. (F) Graphs show GAD65 puncta in the SR and SLM area of the CA1 hippocampus of trained WT and OE mice. No significant differences were seen in GAD65 immunoreactivity between WT and OE mice. Graphs show mean values and error bars represent SEM.