 Explore
 Validate
 Learn
Learn Western blot
 ELISA
ELISA Immunocytochemistry
Antibody data
- Antibody Data
- Antigen structure
- References [6]
- Comments [0]
- Validations
- Immunocytochemistry [2]
- Immunoprecipitation [1]
- Immunohistochemistry [1]
- Chromatin Immunoprecipitation [6]
- Other assay [9]
Submit
Validation data
Reference
Comment
Report error
- Product number
- MA1-46093 - Provider product page

- Provider
- Invitrogen Antibodies
- Product name
- Phospho-RNA pol II CTD (Ser5) Monoclonal Antibody (4H8)
- Antibody type
- Monoclonal
- Antigen
- Other
- Description
- MA1-46093 reacts with DNA-directed RNA Polymerase II Largest Subunit in human, yeast and mouse samples. Expected to cross-react with Drosophilia melanogaster, hamster, S. pombe, and Arabidopsis thaliana due to sequence homology. MA1-46093 has been successfully used in Western Blot, Chromatin Immunoprecipitation, ELISA, Immunocytochemistry/Immunofluorescence, IHC (P) and Immunoprecipitation applications. The MA1-46093 immunogen is 10 repeats of synthetic peptide YSPTSPS using chemically synthesized phospho-Ser 5 YSPTSpPS (Human). This antibody detects both the phosphorylated and non-phosphorylated forms.
- Reactivity
- Human, Mouse, Yeast
- Host
- Mouse
- Isotype
- IgG
- Antibody clone number
- 4H8
- Vial size
- 100 μg
- Concentration
- 1 mg/mL
- Storage
- -20°C
Submitted references Telomerase Reverse Transcriptase Preserves Neuron Survival and Cognition in Alzheimer's Disease Models.
TRAIL Induces Nuclear Translocation and Chromatin Localization of TRAIL Death Receptors.
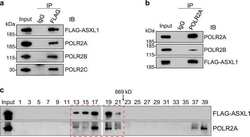
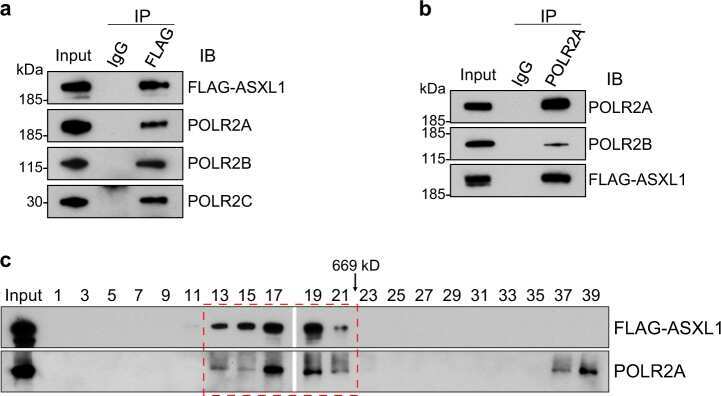
Loss of ASXL1 in the bone marrow niche dysregulates hematopoietic stem and progenitor cell fates.
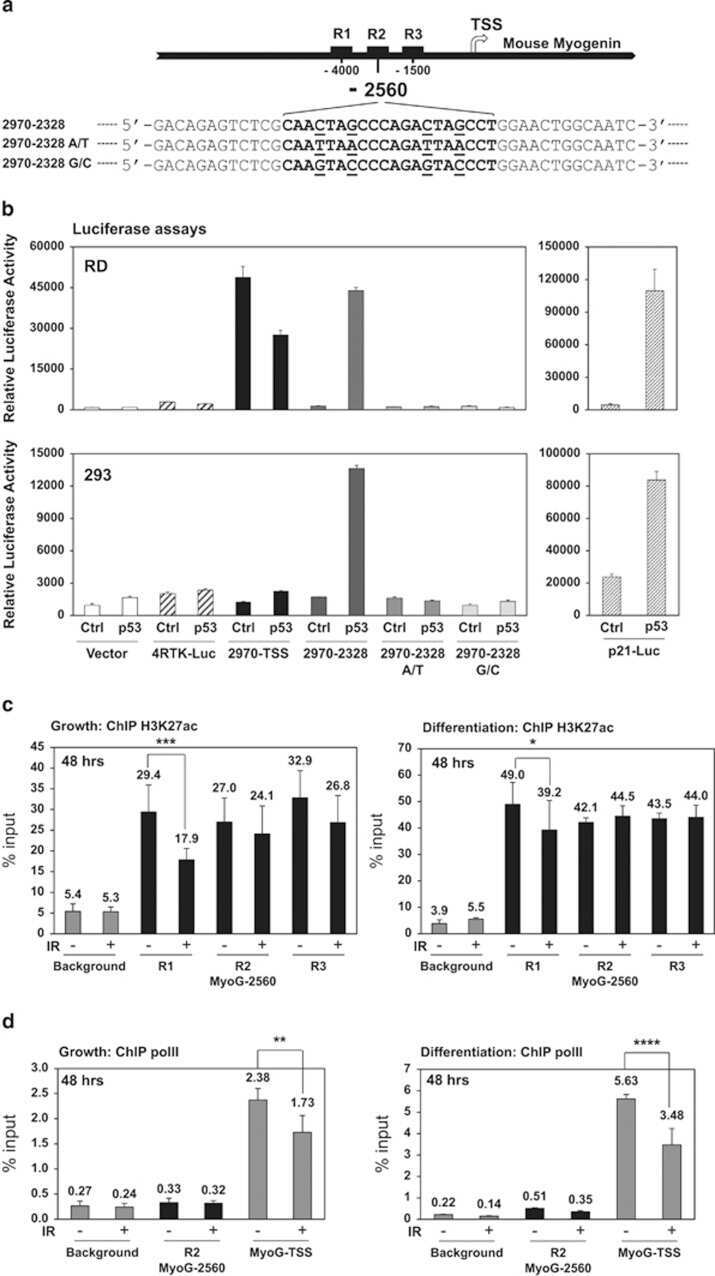
p53 suppresses muscle differentiation at the myogenin step in response to genotoxic stress.
Hepatitis C virus infection activates an innate pathway involving IKK-α in lipogenesis and viral assembly.
Lack of CAK complex accumulation at DNA damage sites in XP-B and XP-B/CS fibroblasts reveals differential regulation of CAK anchoring to core TFIIH by XPB and XPD helicases during nucleotide excision repair.
Shim HS, Horner JW, Wu CJ, Li J, Lan ZD, Jiang S, Xu X, Hsu WH, Zal T, Flores II, Deng P, Lin YT, Tsai LH, Wang YA, DePinho RA
Nature aging 2021 Dec;1(12):1162-1174
Nature aging 2021 Dec;1(12):1162-1174
TRAIL Induces Nuclear Translocation and Chromatin Localization of TRAIL Death Receptors.
Mert U, Adawy A, Scharff E, Teichmann P, Willms A, Haselmann V, Colmorgen C, Lemke J, von Karstedt S, Fritsch J, Trauzold A
Cancers 2019 Aug 14;11(8)
Cancers 2019 Aug 14;11(8)
Loss of ASXL1 in the bone marrow niche dysregulates hematopoietic stem and progenitor cell fates.
Zhang P, Chen Z, Li R, Guo Y, Shi H, Bai J, Yang H, Sheng M, Li Z, Li Z, Li J, Chen S, Yuan W, Cheng T, Xu M, Zhou Y, Yang FC
Cell discovery 2018;4:4
Cell discovery 2018;4:4
p53 suppresses muscle differentiation at the myogenin step in response to genotoxic stress.
Yang ZJ, Broz DK, Noderer WL, Ferreira JP, Overton KW, Spencer SL, Meyer T, Tapscott SJ, Attardi LD, Wang CL
Cell death and differentiation 2015 Apr;22(4):560-73
Cell death and differentiation 2015 Apr;22(4):560-73
Hepatitis C virus infection activates an innate pathway involving IKK-α in lipogenesis and viral assembly.
Li Q, Pène V, Krishnamurthy S, Cha H, Liang TJ
Nature medicine 2013 Jun;19(6):722-9
Nature medicine 2013 Jun;19(6):722-9
Lack of CAK complex accumulation at DNA damage sites in XP-B and XP-B/CS fibroblasts reveals differential regulation of CAK anchoring to core TFIIH by XPB and XPD helicases during nucleotide excision repair.
Zhu Q, Wani G, Sharma N, Wani A
DNA repair 2012 Dec 1;11(12):942-50
DNA repair 2012 Dec 1;11(12):942-50
No comments: Submit comment
Supportive validation
- Submitted by
- Invitrogen Antibodies (provider)
- Main image
- Experimental details
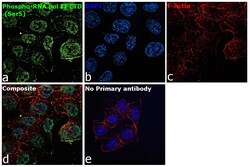
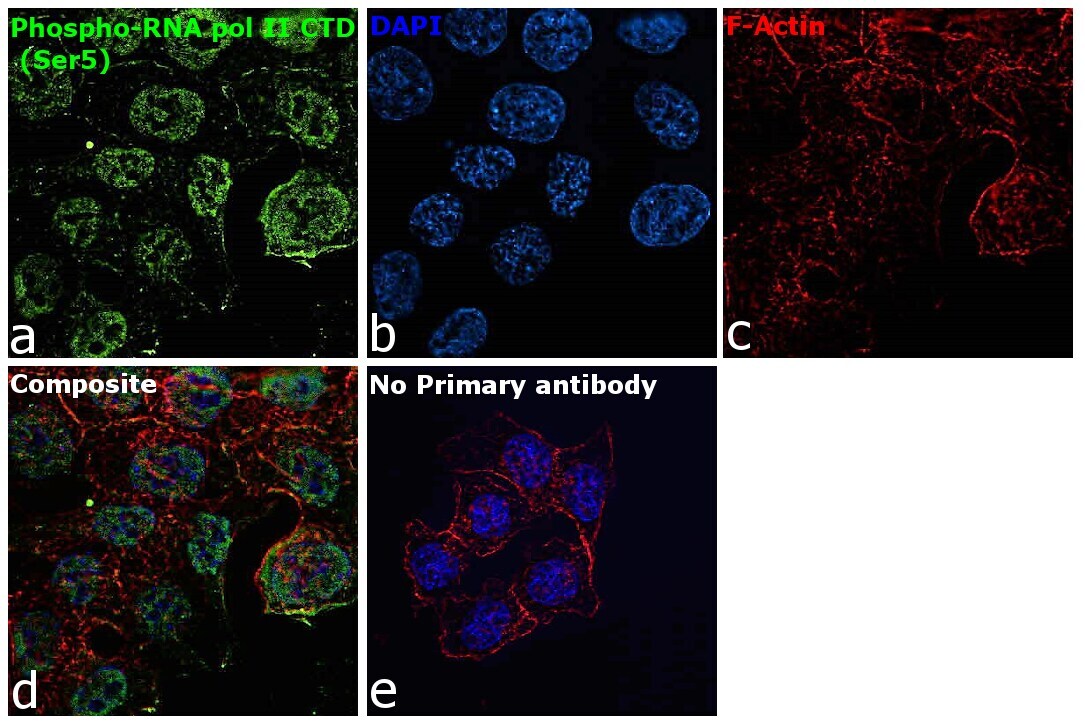
- Immunofluorescence analysis of NPhospho-RNA pol II CTD (Ser5) Monoclonal Antibody (4H8) was performed using 70% confluent log phase HCT 116 cells. The cells were fixed with 4% paraformaldehyde for 10 minutes, permeabilized with 0.1% Triton™ X-100 for 15 minutes, and blocked with 2% BSA for 45 minutes at room temperature. The cells were labeled with Phospho-RNA pol II CTD (Ser5) Monoclonal Antibody (4H8) (Product # MA1-46093) at 1:100 dilution in 0.1% BSA, incubated at 4 degree celsius overnight and then labeled with Donkey anti-Mouse IgG (H+L) Highly Cross-Adsorbed Secondary Antibody, Alexa Fluor Plus 488 (Product # A32766), (1:2000 dilution), for 45 minutes at room temperature (Panel a: Green). Nuclei (Panel b:Blue) were stained with ProLong™ Diamond Antifade Mountant with DAPI (Product # P36962). F-actin (Panel c: Red) was stained with Rhodamine Phalloidin (Product # R415, 1:300 dilution). Panel d represents the merged image showing Nuclear localization. Panel e represents control cells with no primary antibody to assess background. The images were captured at 60X magnification.

- Submitted by
- Invitrogen Antibodies (provider)
- Main image

- Experimental details
- Immunofluorescence analysis of NPhospho-RNA pol II CTD (Ser5) Monoclonal Antibody (4H8) was performed using 70% confluent log phase HCT 116 cells. The cells were fixed with 4% paraformaldehyde for 10 minutes, permeabilized with 0.1% Triton™ X-100 for 15 minutes, and blocked with 2% BSA for 45 minutes at room temperature. The cells were labeled with Phospho-RNA pol II CTD (Ser5) Monoclonal Antibody (4H8) (Product # MA1-46093) at 1:100 dilution in 0.1% BSA, incubated at 4 degree celsius overnight and then labeled with Donkey anti-Mouse IgG (H+L) Highly Cross-Adsorbed Secondary Antibody, Alexa Fluor Plus 488 (Product # A32766), (1:2000 dilution), for 45 minutes at room temperature (Panel a: Green). Nuclei (Panel b:Blue) were stained with ProLong™ Diamond Antifade Mountant with DAPI (Product # P36962). F-actin (Panel c: Red) was stained with Rhodamine Phalloidin (Product # R415, 1:300 dilution). Panel d represents the merged image showing Nuclear localization. Panel e represents control cells with no primary antibody to assess background. The images were captured at 60X magnification.
Supportive validation
- Submitted by
- Invitrogen Antibodies (provider)
- Main image

- Experimental details
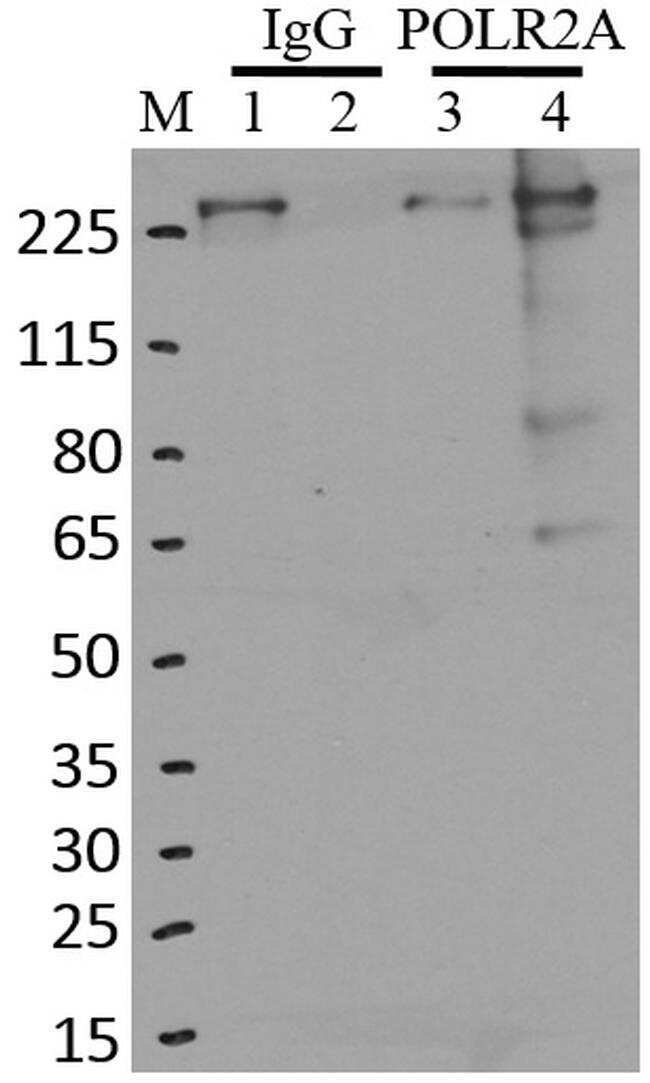
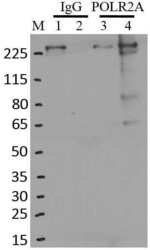
- Immunoprecipitation of POLR2A was performed on K562 cells. Antigen-antibody complexes were formed by incubating approximately 500 ug whole cell lysate with 5 ug of monoclonal POLR2A antibody (Product # MA1-46093) rotating 60 min at RT. The immune complexes were captured on 625 ug of Dynabeads M-280 sheep anti-mouse IgG (Product # 11202D), washed extensively, and eluted in NuPAGE LDS sample buffer (Product # NP0007). Samples were resolved onto a 4-12% Bis-Tris protein gel (Product # NP0335BOX). Lanes 1 and 3 are input and lanes 2 and 4 are IP. Proteins were transferred to nitrocellulose membrane (Product # IB23001) and blocked in 5% milk. POLR2A was detected at approximately 220 kDa using a monoclonal POLR2A antibody (Product # MA1-46093) at a dilution of 1:2000, followed by incubation with anti-mouse secondary antibody. Chemiluminescent detection was performed using ECL Western Blotting Substrate (Product # 32106). Data courtesy of the Yeo lab as part of the ENCODE project (www.encodeproject.org).

Supportive validation
- Submitted by
- Invitrogen Antibodies (provider)
- Main image
- Experimental details
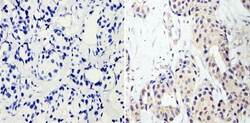
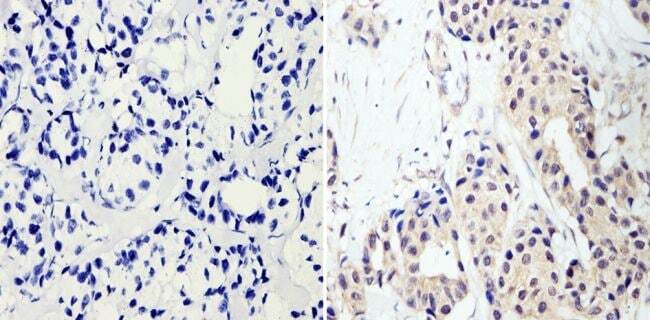
- Immunohistochemistry analysis of RNA Polymerase II CTD showing staining in the nucleus and cytoplasm of paraffin-embedded human breast carcinoma (right) compared with a negative control without primary antibody (left). To expose target proteins, antigen retrieval was performed using 10mM sodium citrate (pH 6.0), microwaved for 8-15 min. Following antigen retrieval, tissues were blocked in 3% H2O2-methanol for 15 min at room temperature, washed with ddH2O and PBS, and then probed with a RNA Polymerase II CTD monoclonal antibody (Product # MA1-46093) diluted in 3% BSA-PBS at a dilution of 1:20 overnight at 4°C in a humidified chamber. Tissues were washed extensively in PBST and detection was performed using an HRP-conjugated secondary antibody followed by colorimetric detection using a DAB kit. Tissues were counterstained with hematoxylin and dehydrated with ethanol and xylene to prep for mounting.
Supportive validation
- Submitted by
- Invitrogen Antibodies (provider)
- Main image
- Experimental details
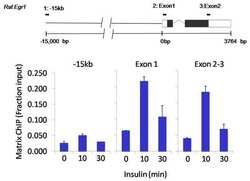
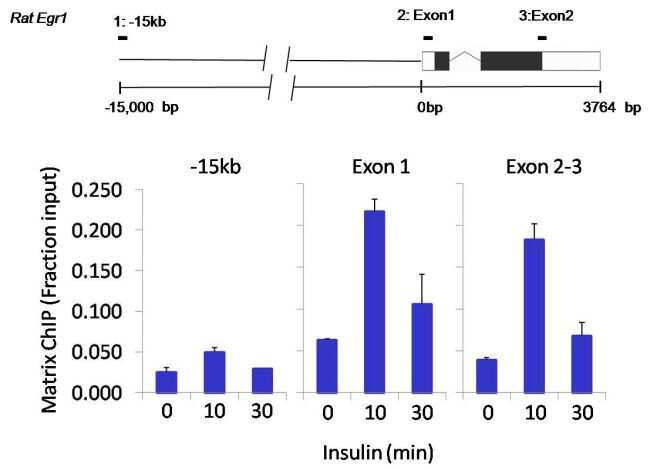
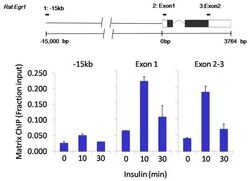
- Chromatin immunoprecipitation analysis of RNA Polymerase II CTD was performed using cross-linked chromatin from 1x10^6 HTC-IR rat hepatoma cells treated with insulin for 0, 10, and 30 minutes. Immunoprecipitation was performed using a multiplex microplate Matrix ChIP assay (see reference for Matrix ChIP protocol: http://www.ncbi.nlm.nih.gov/pubmed/22098709) with 1.0 µL/100 µL well volume of an RNA Polymerase II CTD monoclonal antibody (Product # MA1-46093). Chromatin aliquots from ~1x10^5 cells were used per ChIP pull-down. Quantitative PCR data were done in quadruplicate using 1 µL of eluted DNA in 2 µL SYBR real-time PCR reactions containing primers to amplify -15kb upstream of the Egr1 gene or exon-1 or exon-2-3 of Egr1. PCR calibration curves were generated for each primer pair from a dilution series of sheared total genomic DNA. Quantitation of immunoprecipitated chromatin is presented as signal relative to the total amount of input chromatin. Results represent the mean +/- SEM for three experiments. A schematic representation of the rat Egr-1 locus is shown above the data where boxes represent exons (black boxes = translated regions, white boxes = untranslated regions), the zigzag line represents an intron, and the straight line represents upstream sequence. Regions amplified by Egr-1 primers are represented by black bars. Data courtesy of the Innovators Program.
- Submitted by
- Invitrogen Antibodies (provider)
- Main image
- Experimental details
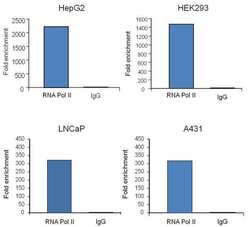
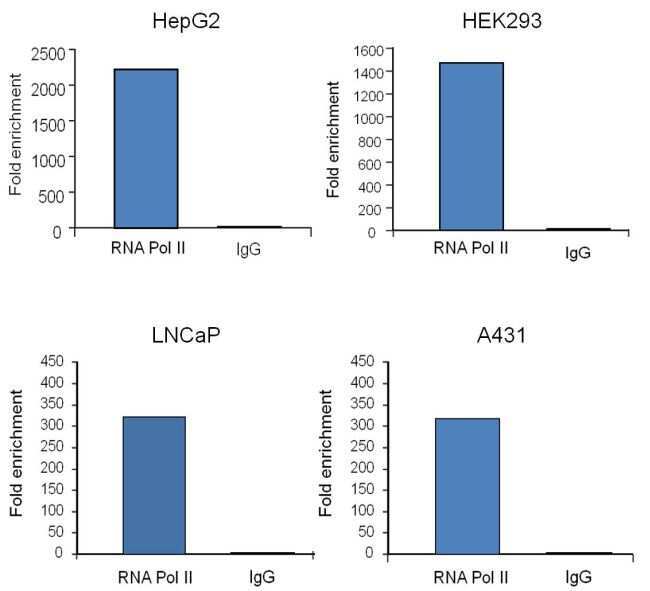
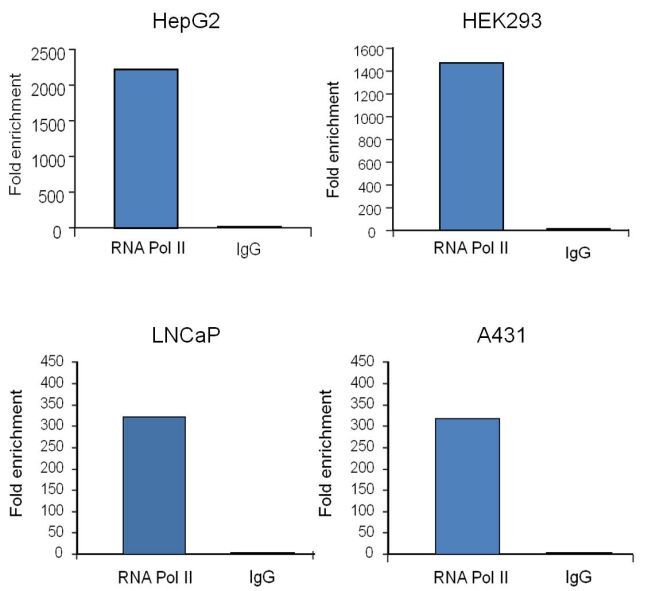
- Chromatin immunoprecipitation analysis (ChIP) of RNA Polymerase II subunit B1 binding to the GAPDH promoter was performed using cross-linked chromatin from the indicated cell lines. Immunoprecipitation was performed using the Pierce Magnetic ChIP kit (Product # 26157) with 10 µg of a RNA Polymerase II monoclonal antibody (Product # MA1-46093) for HepG2-derived chromatin, or 2.5 µg for A431-, HEK293- and LNCaP-derived chromatin. Quantitative real-time PCR data was obtained using Thermo Scientific Luminaris Color HiGreen qPCR Master Mix, and primers (5-TACTAGCGGTTTTACGGGCG, 3TCGAACAGGAGGAGCAGAGAGCGA) flanking the human GAPDH promoter, proximal to the start site of transcription. The reaction was performed on the Thermo Scientific PikoReal Real-Time qPCR system. Quantitation of immunoprecipitated GAPDH promoter sequence is presented as fold enrichment of the RNA Polymerase II monoclonal antibody versus non-specific IgG. Note: This antibody can be used as a positive control for ChIP experiments.
- Submitted by
- Invitrogen Antibodies (provider)
- Main image

- Experimental details
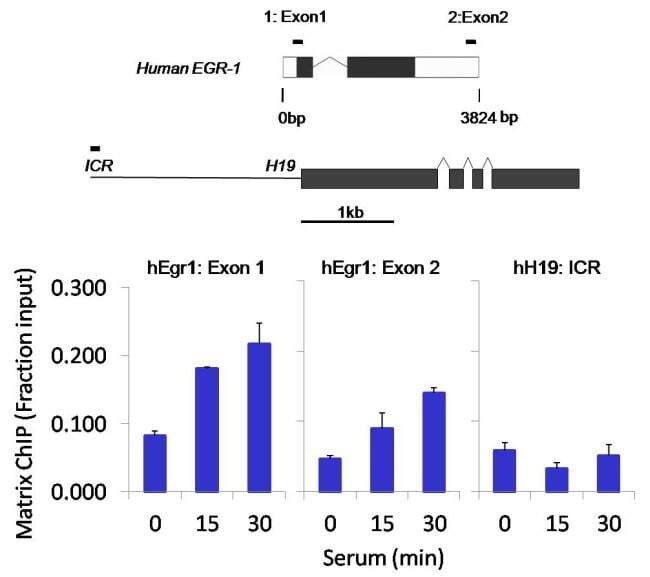
- Chromatin immunoprecipitation analysis of RNA Polymerase II CTD was performed using cross-linked chromatin from 1 x 10^6 HCT116 human colon carcinoma cells treated with serum for 0, 15, and 30 minutes. Immunoprecipitation was performed using a multiplex microplate Matrix ChIP assay (see reference for Matrix ChIP protocol: http://www.ncbi.nlm.nih.gov/pubmed/22098709) with 1.0 µL/100 µL well volume of an RNA Polymerase II CTD monoclonal antibody (Product # MA1-46093). Chromatin aliquots from ~1 x 10^5 cells were used per ChIP pull-down. Quantitative PCR data were done in quadruplicate using 1 µL of eluted DNA in 2 µL SYBR real-time PCR reactions containing primers to amplify exon-1 or exon-2 of human Egr-1, or the imprinting control region (ICR) of the human H19 locus. PCR calibration curves were generated for each primer pair from a dilution series of sheared total genomic DNA. Quantitation of immunoprecipitated chromatin is presented as signal relative to the total amount of input chromatin. Results represent the mean +/- SEM for three experiments. A schematic representation of the human Egr-1 and H19 loci are shown above the data where boxes represent exons (black boxes = translated regions, white boxes = untranslated regions), the zigzag lines represent introns, and the straight line represents upstream sequence. Regions amplified by Egr-1 and H19 primers are represented by black bars. Data courtesy of the Innovators Program.
- Submitted by
- Invitrogen Antibodies (provider)
- Main image

- Experimental details
- Chromatin immunoprecipitation analysis (ChIP) of RNA Polymerase II subunit B1 binding to the GAPDH promoter was performed using cross-linked chromatin from the indicated cell lines. Immunoprecipitation was performed using the Pierce Magnetic ChIP kit (Product # 26157) with 10 µg of a RNA Polymerase II monoclonal antibody (Product # MA1-46093) for HepG2-derived chromatin, or 2.5 µg for A431-, HEK293- and LNCaP-derived chromatin. Quantitative real-time PCR data was obtained using Thermo Scientific Luminaris Color HiGreen qPCR Master Mix, and primers (5-TACTAGCGGTTTTACGGGCG, 3TCGAACAGGAGGAGCAGAGAGCGA) flanking the human GAPDH promoter, proximal to the start site of transcription. The reaction was performed on the Thermo Scientific PikoReal Real-Time qPCR system. Quantitation of immunoprecipitated GAPDH promoter sequence is presented as fold enrichment of the RNA Polymerase II monoclonal antibody versus non-specific IgG. Note: This antibody can be used as a positive control for ChIP experiments.
- Submitted by
- Invitrogen Antibodies (provider)
- Main image
- Experimental details
- Chromatin immunoprecipitation analysis of RNA Polymerase II CTD was performed using cross-linked chromatin from 1x10^6 HTC-IR rat hepatoma cells treated with insulin for 0, 10, and 30 minutes. Immunoprecipitation was performed using a multiplex microplate Matrix ChIP assay (see reference for Matrix ChIP protocol: http://www.ncbi.nlm.nih.gov/pubmed/22098709) with 1.0 µL/100 µL well volume of an RNA Polymerase II CTD monoclonal antibody (Product # MA1-46093). Chromatin aliquots from ~1x10^5 cells were used per ChIP pull-down. Quantitative PCR data were done in quadruplicate using 1 µL of eluted DNA in 2 µL SYBR real-time PCR reactions containing primers to amplify -15kb upstream of the Egr1 gene or exon-1 or exon-2-3 of Egr1. PCR calibration curves were generated for each primer pair from a dilution series of sheared total genomic DNA. Quantitation of immunoprecipitated chromatin is presented as signal relative to the total amount of input chromatin. Results represent the mean +/- SEM for three experiments. A schematic representation of the rat Egr-1 locus is shown above the data where boxes represent exons (black boxes = translated regions, white boxes = untranslated regions), the zigzag line represents an intron, and the straight line represents upstream sequence. Regions amplified by Egr-1 primers are represented by black bars. Data courtesy of the Innovators Program.

- Submitted by
- Invitrogen Antibodies (provider)
- Main image

- Experimental details
- Chromatin immunoprecipitation analysis of RNA Polymerase II CTD was performed using cross-linked chromatin from 1 x 10^6 HCT116 human colon carcinoma cells treated with serum for 0, 15, and 30 minutes. Immunoprecipitation was performed using a multiplex microplate Matrix ChIP assay (see reference for Matrix ChIP protocol: http://www.ncbi.nlm.nih.gov/pubmed/22098709) with 1.0 µL/100 µL well volume of an RNA Polymerase II CTD monoclonal antibody (Product # MA1-46093). Chromatin aliquots from ~1 x 10^5 cells were used per ChIP pull-down. Quantitative PCR data were done in quadruplicate using 1 µL of eluted DNA in 2 µL SYBR real-time PCR reactions containing primers to amplify exon-1 or exon-2 of human Egr-1, or the imprinting control region (ICR) of the human H19 locus. PCR calibration curves were generated for each primer pair from a dilution series of sheared total genomic DNA. Quantitation of immunoprecipitated chromatin is presented as signal relative to the total amount of input chromatin. Results represent the mean +/- SEM for three experiments. A schematic representation of the human Egr-1 and H19 loci are shown above the data where boxes represent exons (black boxes = translated regions, white boxes = untranslated regions), the zigzag lines represent introns, and the straight line represents upstream sequence. Regions amplified by Egr-1 and H19 primers are represented by black bars. Data courtesy of the Innovators Program.

Supportive validation
- Submitted by
- Invitrogen Antibodies (provider)
- Main image

- Experimental details
- Immunoprecipitation of POLR2A was performed on K562 cells. Antigen-antibody complexes were formed by incubating approximately 500 ug whole cell lysate with 5 ug of monoclonal POLR2A antibody (Product # MA1-46093) rotating 60 min at RT. The immune complexes were captured on 625 ug of Dynabeads M-280 sheep anti-mouse IgG (Product # 11202D), washed extensively, and eluted in NuPAGE LDS sample buffer (Product # NP0007). Samples were resolved onto a 4-12% Bis-Tris protein gel (Product # NP0335BOX). Lanes 1 and 3 are input and lanes 2 and 4 are IP. Proteins were transferred to nitrocellulose membrane (Product # IB23001) and blocked in 5% milk. POLR2A was detected at approximately 220 kDa using a monoclonal POLR2A antibody (Product # MA1-46093) at a dilution of 1:2000, followed by incubation with anti-mouse secondary antibody. Chemiluminescent detection was performed using ECL Western Blotting Substrate (Product # 32106). Data courtesy of the Yeo lab as part of the ENCODE project (www.encodeproject.org).
- Submitted by
- Invitrogen Antibodies (provider)
- Main image
- Experimental details
- NULL
- Submitted by
- Invitrogen Antibodies (provider)
- Main image

- Experimental details
- NULL
- Submitted by
- Invitrogen Antibodies (provider)
- Main image
- Experimental details
- RNA immunoprecipitation (RIP) western of POLR2A was performed on K562 cells. Antigen-antibody complexes were formed by incubating approximately 500 æg whole cell lysate with 5 æg of monoclonal POLR2A antibody (Product # MA1-46093) rotating 60 min at RT. The immune complexes were captured on 625 æg of Dynabeads M-280 sheep anti-mouse IgG (Product # 11202D), washed extensively, and eluted in NuPAGE LDS sample buffer (Product # NP0007). Samples were resolved onto a 4-12% Bis-Tris protein gel (Product # NP0335BOX). Lanes 1 and 3 are input and lanes 2 and 4 are IP. Proteins were transferred to nitrocellulose membrane (Product # IB23001) and blocked in 5% milk. POLR2A was detected at approximately 220 kDa using a monoclonal POLR2A antibody (Product # MA1-46093) at a dilution of 1:2000, followed by incubation with anti-mouse secondary antibody. Chemiluminescent detection was performed using ECL Western Blotting Substrate (Product # 32106). Data courtesy of the Yeo lab as part of the ENCODE project (www.encodeproject.org).

- Submitted by
- Invitrogen Antibodies (provider)
- Main image

- Experimental details
- RNA immunoprecipitation (RIP) western of POLR2A was performed on K562 cells. Antigen-antibody complexes were formed by incubating approximately 500 µg whole cell lysate with 5 µg of monoclonal POLR2A antibody (Product # MA1-46093) rotating 60 min at RT. The immune complexes were captured on 625 µg of Dynabeads M-280 sheep anti-mouse IgG (Product # 11202D), washed extensively, and eluted in NuPAGE LDS sample buffer (Product # NP0007). Samples were resolved onto a 4-12% Bis-Tris protein gel (Product # NP0335BOX). Lanes 1 and 3 are input and lanes 2 and 4 are IP. Proteins were transferred to nitrocellulose membrane (Product # IB23001) and blocked in 5% milk. POLR2A was detected at approximately 220 kDa using a monoclonal POLR2A antibody (Product # MA1-46093) at a dilution of 1:2000, followed by incubation with anti-mouse secondary antibody. Chemiluminescent detection was performed using ECL Western Blotting Substrate (Product # 32106). Data courtesy of the Yeo lab as part of the ENCODE project (www.encodeproject.org).

- Submitted by
- Invitrogen Antibodies (provider)
- Main image
- Experimental details
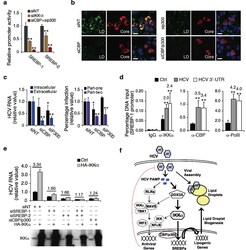
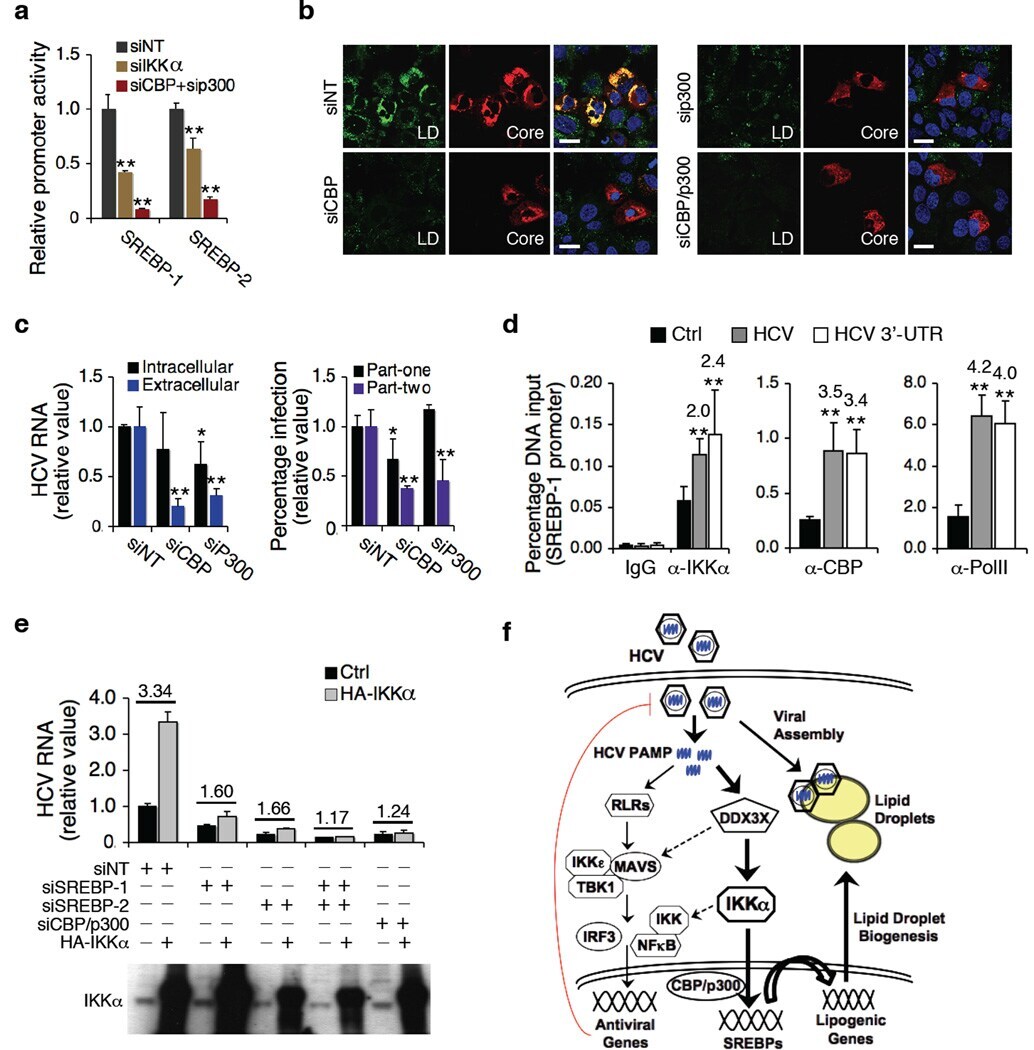
- Figure 6 Signaling pathway involved in IKKalpha-mediated lipogenic induction of HCV infection. ( a ) Effects of IKKalpha or CBP/p300 siRNA on SREBP luciferase reporter activities. ( b ) LD contents and HCV core expression in CBP or p300 siRNA-treated Huh7.5.1 cells prior to HCV infection. Scale bars represent 20 um. ( c ) Effects of CBP/p300 silencing on HCV infection. Left: intracellular and extracellular HCV RNA levels; right: HCV core quantification in part-one and part-two of HCV cc assay. Western blot of CBP and p300 protein levels is shown in Supplementary Fig. 12c . ( d ) Huh7.5.1 cells were untreated, infected with HCV or transfected with HCV 3'UTR RNA for 48 h, and chromatin immunoprecipitation (ChIP) assays were performed with the indicated antibodies. Only data for SREBP-1 promoter is shown here and data for IL-8 (positive control) and actin (negative control) promoters are shown in Supplementary Fig. 12d . Data are presented as means +- s.d., n = 4. ( e ) IKKalpha over-expression in HCV-infected cells deprived of SREBP-1, SREBP-2, or CBP/p300. ( a,c,d,e ) Error bars represent +- s.d. of triplicate experiments. **, P < 0.01, and *, P < 0.05, as compared to control. ( f ) A proposed model of innate antiviral response and HCV-induced lipogenesis and LD formation in HCV assembly. The thickness of the arrows represents the putative magnitude of the two pathways (proviral > antiviral) in Huh7.5.1 cells. Dotted arrows represent possible cross-talks of the two parall
- Submitted by
- Invitrogen Antibodies (provider)
- Main image

- Experimental details
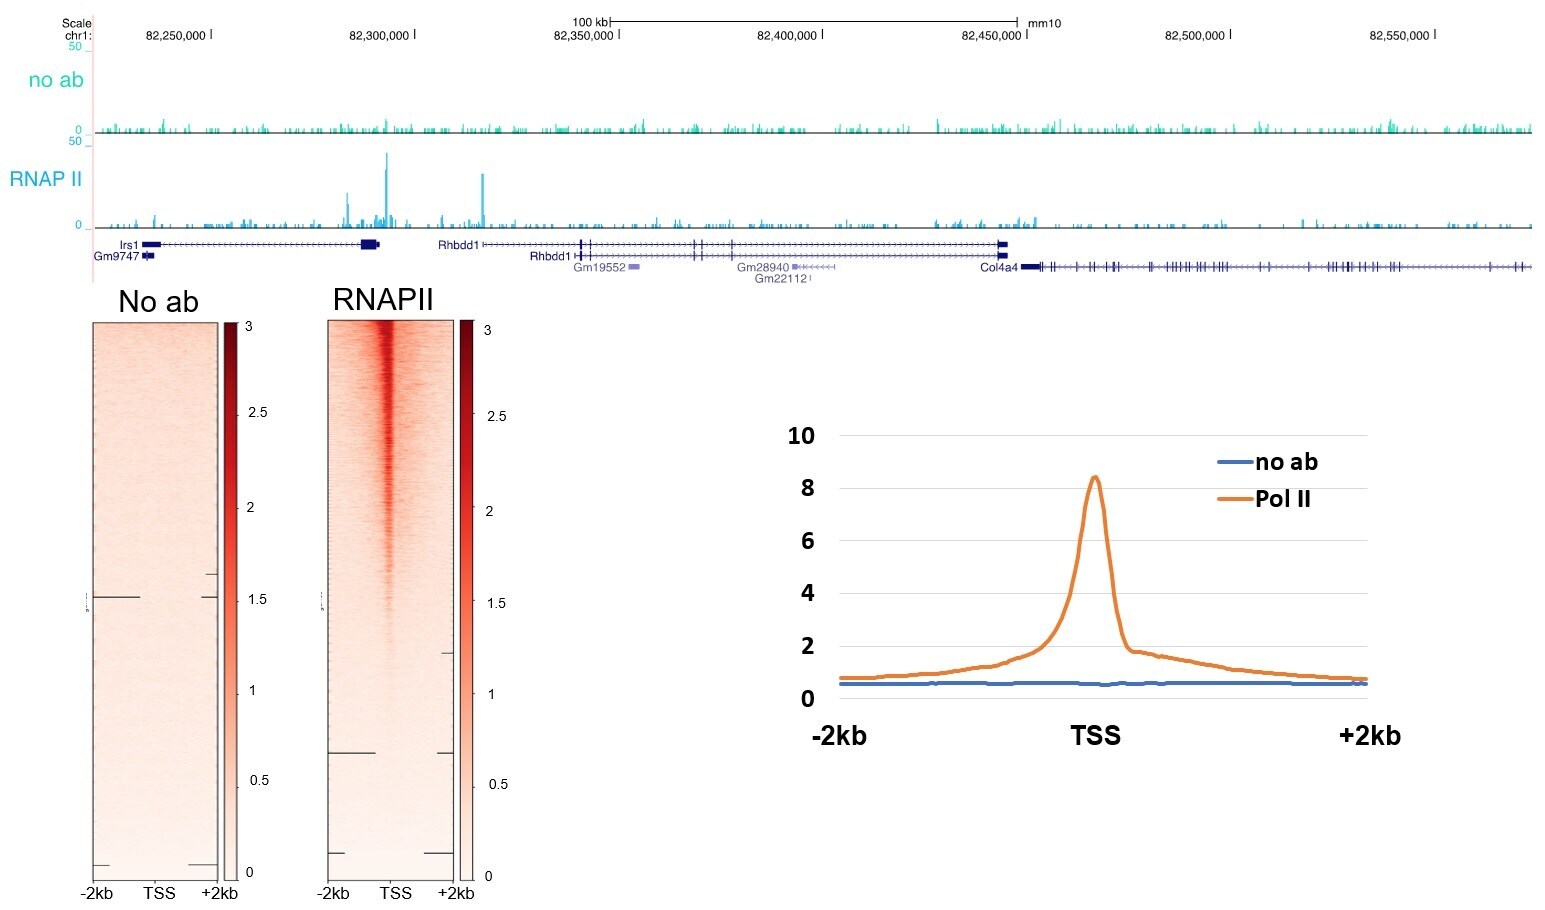
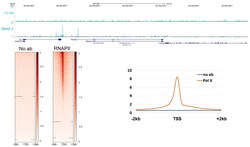
- CUT&RUN was performed using 200,000 E14 mouse embryonic stem cells with RNA pol II CTD phospho Ser5 monoclonal antibody (Product # MA1-46093) or no antibody control. Sequencing reads were aligned to annotated TSS (+/- 2kbp) of 43,511 annotated TSSs (from HOMER). Libraries were sequenced to ~8 million mapped reads. Gray lines indicate regions of no sequence coverage. Data courtesy of Sarah Hainer at University of Pittsburgh.
- Submitted by
- Invitrogen Antibodies (provider)
- Main image
- Experimental details
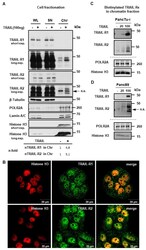
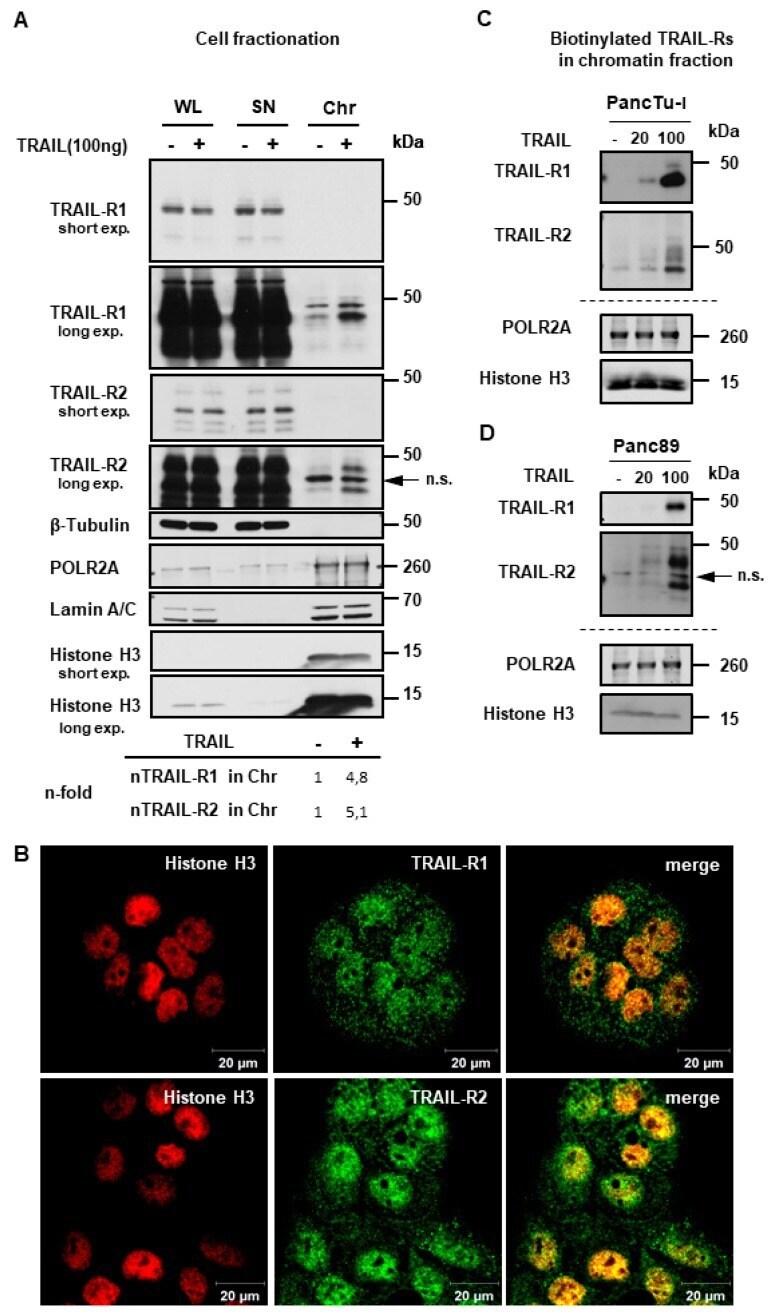
- Figure 8 TRAIL-R1 and TRAIL-R2 are enriched in the chromatin fraction upon TRAIL stimulation. ( A ) PancTu-I cells were stimulated with 100 ng TRAIL for one hour. The obtained chromatin fractions (Chr) were analyzed by Western blotting and compared to the supernatant (SN) and to the whole cell lysate (WL). Markers for different subcellular fraction have been included as follows, beta-Tubulin (cytoplasmic marker), RNA polymerase 2A (POLR2A) and Histone H3 (chromatin markers), Lamin A/C (nuclear marker). Band intensities of nTRAIL-R1 and nTRAIL-R2 bands were analyzed by densitometry in relation to POL2A and normalized to untreated controls. ( B ) Co-localization of TRAIL-R1 or TRAIL-R2 with Histone H3 in PancTu-I cells was studied by immunofluorescence and confocal LSM. ( C , D ) Plasma membrane proteins of PancTu-I and Panc89 cells were labeled with biotin for 1 h at 4 degC, followed by 1 h incubation at 37 degC with or without stimulation with TRAIL in indicated concentrations. Chromatin isolation was done as described in Material and Methods. Biotinylated proteins purified from chromatin fractions were analyzed in Western blot for the presence of TRAIL-R1 and TRAIL-R2. Lysates from chromatin fractions were immunoblotted for nuclear markers (POLR2A and Histone H3) as control for the equal amounts of extracts used for purification of biotinylated-proteins.
- Submitted by
- Invitrogen Antibodies (provider)
- Main image
- Experimental details
- CUT&RUN was performed using 200,000 E14 mouse embryonic stem cells with RNA pol II CTD phospho Ser5 monoclonal antibody (Product # MA1-46093) or no antibody control. Sequencing reads were aligned to annotated TSS (+/- 2kbp) of 43,511 annotated TSSs (from HOMER). Libraries were sequenced to ~8 million mapped reads. Gray lines indicate regions of no sequence coverage. Data courtesy of Sarah Hainer at University of Pittsburgh.
