Explore
 Validate
 Learn
LearnPA1-46178
antibody from Invitrogen Antibodies
Targeting: ATG5
APG5, APG5L, ASP, hAPG5
 Western blot
 ELISA
ELISA Immunocytochemistry Immunoprecipitation Immunohistochemistry Flow cytometry Immunoelectron microscopy Radioimmunoassay Other assay
Antibody data
- Antibody Data
- Antigen structure
- References [2]
- Comments [0]
- Validations
- Immunocytochemistry [1]
- Immunohistochemistry [2]
- Other assay [2]
Submit
Validation data
Reference
Comment
Report error
- Product number
- PA1-46178 - Provider product page

- Provider
- Invitrogen Antibodies
- Product name
- ATG5 Polyclonal Antibody
- Antibody type
- Polyclonal
- Antigen
- Synthetic peptide
- Description
- In Western Blot, a band is seen ~56 kDa representing the ATG5-ATG12 complex, the molecular weight of human ATG5 is ~33 kDa. Prior to immunostaining paraffin tissues, antigen retrieval with sodium citrate buffer (pH 6.0) is recommended. Suggested positive control: antigen standard for ATG5 (transient overexpression lysate), mouse wildtype ES cell lysate.
- Reactivity
- Human, Mouse, Rat, Bovine, Drosophila, Guinea Pig, Porcine, Xenopus, Zebrafish
- Host
- Rabbit
- Isotype
- IgG
- Vial size
- 100 μL
- Concentration
- 1 mg/mL
- Storage
- Store at 4°C short term. For long term storage, store at -20°C, avoiding freeze/thaw cycles.
Submitted references Adiponectin triggers breast cancer cell death via fatty acid metabolic reprogramming.
Leptin Induces Apoptotic and Pyroptotic Cell Death via NLRP3 Inflammasome Activation in Rat Hepatocytes.
Pham DV, Park PH
Journal of experimental & clinical cancer research : CR 2022 Jan 5;41(1):9
Journal of experimental & clinical cancer research : CR 2022 Jan 5;41(1):9
Leptin Induces Apoptotic and Pyroptotic Cell Death via NLRP3 Inflammasome Activation in Rat Hepatocytes.
Baral A, Park PH
International journal of molecular sciences 2021 Nov 22;22(22)
International journal of molecular sciences 2021 Nov 22;22(22)
No comments: Submit comment
Supportive validation
- Submitted by
- Invitrogen Antibodies (provider)
- Main image
- Experimental details
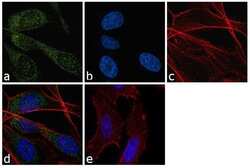
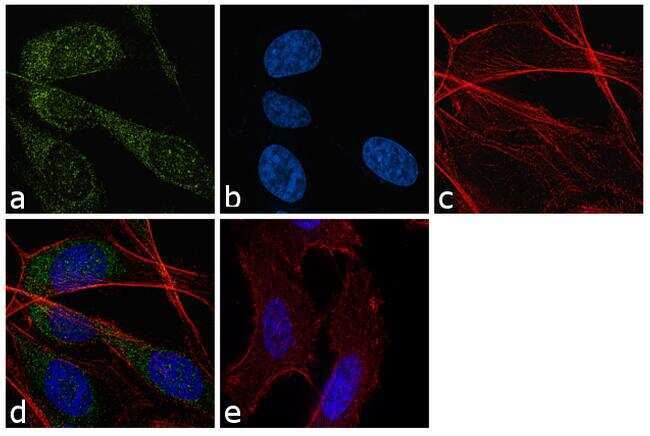
- Immunofluorescence analysis of ATG5 was performed using 70% confluent log phase PC-3 cells. The cells were fixed with 4% paraformaldehyde for 10 minutes, permeabilized with 0.1% Triton™ X-100 for 10 minutes, and blocked with 1% BSA for 1 hour at room temperature. The cells were labeled with ATG5 Rabbit Polyclonal Antibody (Product # PA1-46178) at 2 µg/mL in 0.1% BSA and incubated for 3 hours at room temperature and then labeled with Goat anti-Rabbit IgG (Heavy Chain) Superclonal™ Secondary Antibody, Alexa Fluor® 488 conjugate (Product # A27034) at a dilution of 1:2000 for 45 minutes at room temperature (Panel a: green). Nuclei (Panel b: blue) were stained with SlowFade® Gold Antifade Mountant with DAPI (Product # S36938). F-actin (Panel c: red) was stained with Alexa Fluor® 555 Rhodamine Phalloidin (Product # R415, 1:300). Panel d represents the merged image showing cytoplasmic localization. Panel e shows the no primary antibody control. The images were captured at 60X magnification
Supportive validation
- Submitted by
- Invitrogen Antibodies (provider)
- Main image
- Experimental details
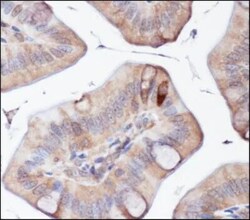
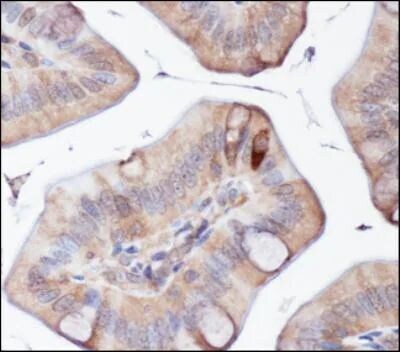
- Immunohistochemical analysis of ATG5 in mouse intestine. Samples were incubated with ATG5 polyclonal antibody (Product # PA1-46178) followed by using DAB with hematoxylin counterstain.
- Submitted by
- Invitrogen Antibodies (provider)
- Main image
- Experimental details
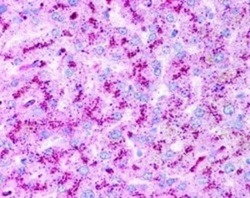
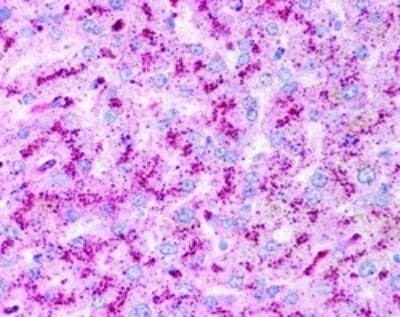
- Immunohistochemical analysis of ATG5 in human liver hepatocytes. Samples were incubated in ATG5 polyclonal antibody (Product # PA1-46178) using a dilution of 2.5 µg/mL. 40X magnification.
Supportive validation
- Submitted by
- Invitrogen Antibodies (provider)
- Main image
- Experimental details
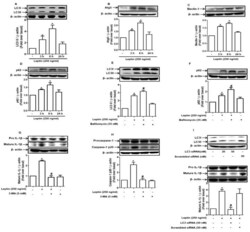
- Figure 5 Role of autophagy induction in inflammasome activation by leptin in rat hepatocytes: ( A - D ) Hepatocytes were treated with leptin (250 ng/mL) for different time durations. Expression levels of the genes related to autophagy, including LC3I/II ( A ), Atg5 ( B ), Beclin-1 ( C ), and p62 ( D ), were measured by Western blot analysis. ( E , F ) Cells were pretreated with bafilomycin A, a lysosomal inhibitor, for 1 h followed by further stimulation with leptin for 8 h. Expression levels of LC3I/II ( E ) and p62 ( F ) were analyzed by Western blot analysis. ( G , H ) Hepatocytes were incubated for 1 h in the absence or presence of 3-MA followed by further incubation with leptin for 8 h. Active IL-1beta ( G ) and caspase-1 ( H ) levels were determined by Western blot analysis. ( I , J ) Cells were transfected with the siRNA targeting LC3B or scramble control siRNA. After 24 h incubation, cells were further stimulated with leptin for 8 h. Active IL-1beta ( I ) and caspase-1 ( J ) levels were assessed by Western blot analysis. Gene silencing efficiency of LC3B was monitored by Western blot analysis and is presented in the upper panel of ( I ). ( K , L ) Cells were pretreated with TUDCA for 1 h followed by treatment with leptin (250 ng/mL) for 8 h. Expression levels of LC3I/II ( K ) and Atg5 ( L ) were determined by Western blot analysis. For Western blot analyses, expression levels of the target genes were quantitiated by densitometric analysis and are shown in the lower pa

- Submitted by
- Invitrogen Antibodies (provider)
- Main image
- Experimental details
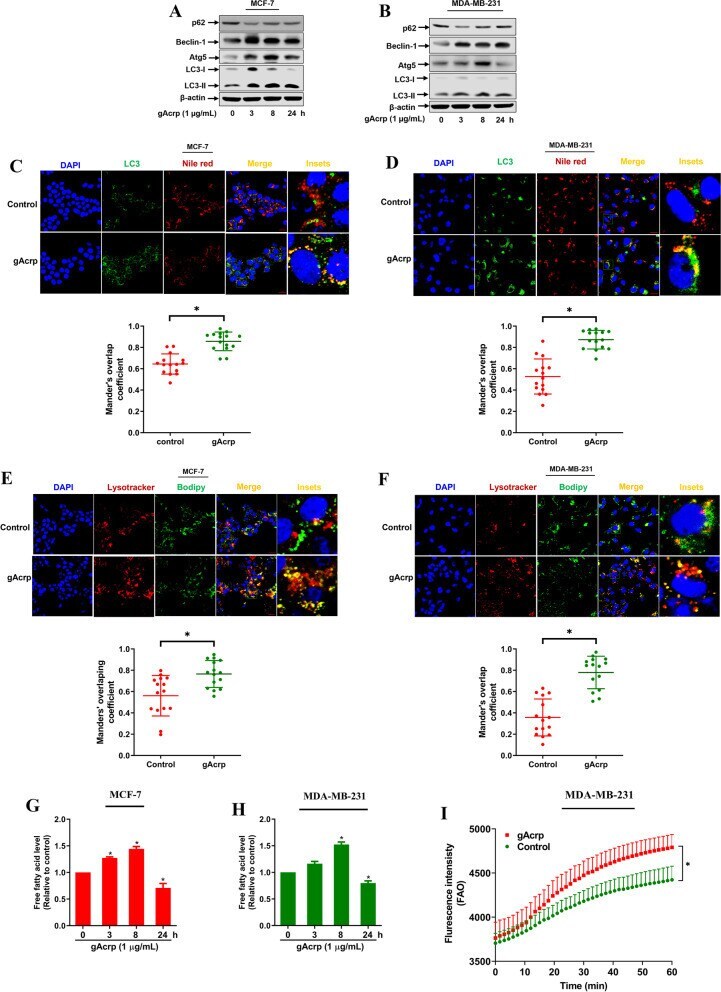
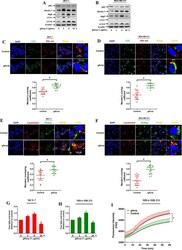
- Fig. 4 Activation of lipophagy by globular adiponectin in breast cancer cells. A-B MCF-7 ( A ) and MDA-MB-231 ( B ) cells were treated with 1 mug/mL of gAcrp for different time periods. The expression levels of autophagy-related genes, including p62, Beclin-1, Atg5, and LC3I/II were examined by western blot analysis. C-F Cells were cultured in the media containing 10 muM of oleic acid/BSA to induce lipid droplet formation and treated with 1 mug/mL of gAcrp for 6 h. C - D Lipid droplets and LC3 were detected by labelling with Nile red (red), and incubation with an anti-LC3 primary antibody followed by Alexa fluor 488-conjugated antibody (green), respectively. E - F Lipid droplets and lysosomes were labeled with Bodipy 493/503 (green) and Lysotracker (red). Co-localization rate was determined by Mander's overlap coefficient using Image J software. Scale bar: 20 mum. G-H Cells were treated with gAcrp for the indicated time duration. Free fatty acid levels were measured at the end of treatment periods as indicated in the methods. I MDA-MB-231 cells were treated with gAcrp (1 mug/mL) for 8 h. Fatty acid oxidation (FAO) was determined as described in the methods. * denotes p < 0.05 compared to control cells; n=3 except where specifically indicated in Figures