Explore
 Validate
 Learn
LearnMIA1404
antibody from Invitrogen Antibodies
Targeting: APOA1
 Western blot
 ELISA Immunocytochemistry
 Immunoprecipitation Immunohistochemistry Flow cytometry Radioimmunoassay Other assay
Antibody data
- Antibody Data
- Antigen structure
- References [2]
- Comments [0]
- Validations
- ELISA [4]
- Immunocytochemistry [2]
- Immunohistochemistry [3]
- Flow cytometry [1]
- Other assay [5]
Submit
Validation data
Reference
Comment
Report error
- Product number
- MIA1404 - Provider product page

- Provider
- Invitrogen Antibodies
- Product name
- ApoA1 Monoclonal Antibody (513)
- Antibody type
- Monoclonal
- Antigen
- Purifed from natural sources
- Description
- By sandwich ELISA, MIA1404 can be used as a detection antibody with Product # 710263 or # 701239 as a coating antibody, to generate a matched pair. Using these matched pairs, recombinant human Apo A-1, but not recombinant mouse Apo A-1, was detected. MIA1404 can be used to detect Apo A-1 from serum samples. To increase sensitivity of sandwich ELISAs with MIA1404, a biotinylated detection antibody followed by Streptavidin-HRP is recommended. By Western blot, MIA1404 detects recombinant human Apo A-1, but not recombinant mouse Apo A-1. MIA1404 is also recommended for detecting endogenous Apo A-1 by Western blot. MIA1404 was formerly sold as a Seradyn product.
- Reactivity
- Human, Mouse
- Host
- Mouse
- Isotype
- IgG
- Antibody clone number
- 513
- Vial size
- 1 mg
- Concentration
- 5 mg/mL
- Storage
- Maintain refrigerated at 2-8°C for up to 6 months. For long term storage store at -20°C
Submitted references Selective activation of ABCA1/ApoA1 signaling in the V1 by magnetoelectric stimulation ameliorates depression via regulation of synaptic plasticity.
Apolipoprotein A-I and B distribution in the human cornea.
Lu Q, Wu F, Jiao J, Xue L, Song R, Shi Y, Kong Y, Sun J, Gu N, Han MH, Zhang Z
iScience 2022 May 20;25(5):104201
iScience 2022 May 20;25(5):104201
Apolipoprotein A-I and B distribution in the human cornea.
Ashraf F, Cogan DG, Kruth HS
Investigative ophthalmology & visual science 1993 Dec;34(13):3574-8
Investigative ophthalmology & visual science 1993 Dec;34(13):3574-8
No comments: Submit comment
Supportive validation
- Submitted by
- Invitrogen Antibodies (provider)
- Main image
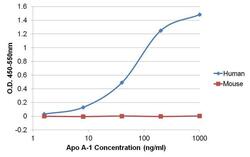
- Experimental details
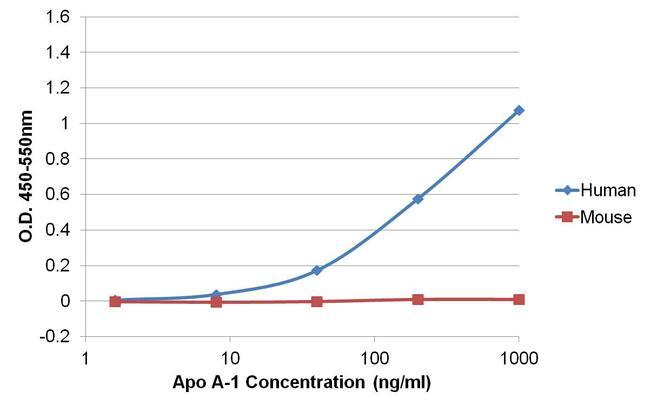
- Sandwich ELISA of Apolipoprotein A-1 was performed by coating wells of a 96-well plate with 100 µL of an Apo A-1 rabbit monoclonal antibody (Product # 701239) diluted to a concentration of 1 µg/mL in carbonate/bicarbonate buffer (Product # 28382) overnight at 4C. Wells were blocked with 150 µL of StartingBlock T20 (TBS) Blocking Buffer (Product # 37543) for 30 minutes, and 80 µL of recombinant human Apo A-1 (Product # 10686-H02H-50) or recombinant mouse Apo A-1 (Product # 50918-M02H-50) was added to the plate at concentrations ranging from 1.6-1000 ng/mL and incubated for 1 hour at room temperature. The plate was washed with 1X TBST (Product # 28360), and 100 µL per well of an Apo A-1 mouse monoclonal antibody (Product # MIA1404) was added to each well for 1 hour at room temperature. The plate was washed, and 100 µL per well of an HRP-conjugated rabbit anti-mouse IgG cross-adsorbed secondary antibody (Product # 31452) was incubated for 30 minutes at room temperature. Detection was performed using 1-Step Ultra TMB Substrate (Product # 34028), followed by Stop Solution (Product # N600). Absorbances were read on a spectrophotometer at 450-550 nm.
- Submitted by
- Invitrogen Antibodies (provider)
- Main image
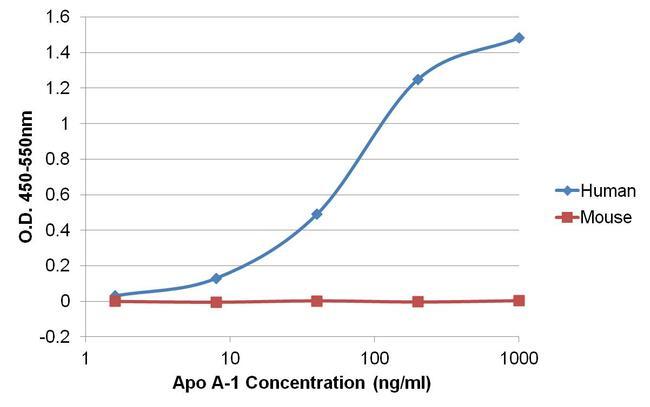
- Experimental details
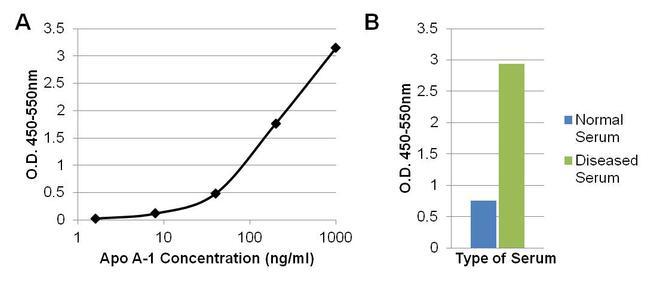
- Sandwich ELISA of Apolipoprotein A-1 was performed by coating wells of a 96-well plate with 100 µL of an Apo A-1 Recombinant Rabbit Polyclonal Antibody (Product # 710263) diluted to a concentration of 1 µg/mL in carbonate/bicarbonate buffer (Product # 28382) overnight at 4C. Wells were blocked with 150 µL of StartingBlock T20 (TBS) Blocking Buffer (Product # 37543) for 30 minutes, and 80 µL of recombinant human Apo A-1 (Product # 10686-H02H-50) or recombinant mouse Apo A-1 (Product # 50918-M02H-50) was added to the plate at concentrations ranging from 1.6-1000 ng/mL and incubated for 1 hour at room temperature. The plate was washed with 1X TBST (Product # 28360), and 100 µL per well of an Apo A-1 Mouse Monoclonal Antibody (Product # MIA1404) was added to each well for 1 hour at room temperature. The plate was washed, and 100 µL per well of an HRP-conjugated Rabbit anti-Mouse IgG cross-adsorbed secondary antibody (Product # 31452) was incubated for 30 minutes at room temperature. Detection was performed using 1-Step Ultra TMB Substrate (Product # 34028), followed by Stop Solution (Product # N600). Absorbances were read on a spectrophotometer at 450-550 nm.
- Submitted by
- Invitrogen Antibodies (provider)
- Main image
- Experimental details
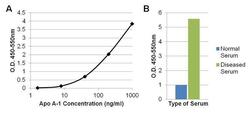
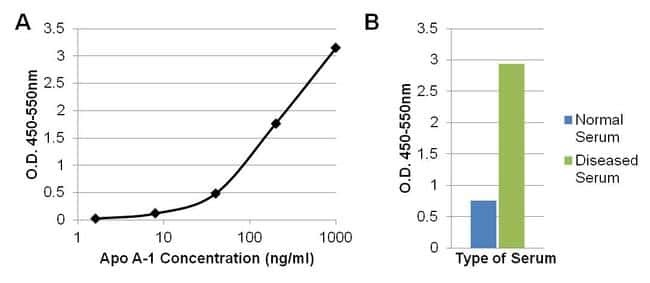
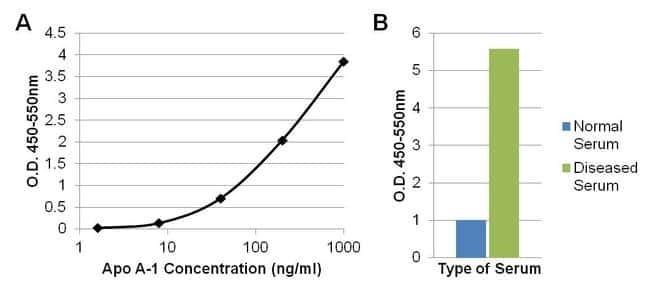
- Sandwich ELISA of Apolipoprotein A-1 was performed by coating wells of a 96-well plate with 100 µL of an Apo A-1 rabbit monoclonal antibody (Product # 701239) at a concentration of 1 µg/mL in carbonate/bicarbonate buffer (Product # 28382) overnight at 4C. Wells were blocked with 150 µL of StartingBlock T20 (TBS) Blocking Buffer (Product # 37543) for 30 minutes, and 80 µL of recombinant human Apo A-1 (Product # 10686-H02H-50) standards ranging from 1.6-1000 ng/mL (A) or 100 µL of diluted normal human serum or diluted serum from a patient with dyslipidemia (B) were incubated for 1 hour at room temperature. The plate was washed with 1X TBST (Product # 28360), and 100 µL per well of an Apo A-1 mouse monoclonal antibody (Product # MIA1404) was added to each well for 1 hour at room temperature. The plate was washed, and 100 µL per well of a biotinylated rabbit anti-mouse IgG Superclonal secondary antibody (Product # A27024) was incubated for 1 hour, followed by Streptavidin-HRP (Product # 21126) for 30 minutes. Detection was performed using 1-Step Ultra TMB Substrate (Product # 34028), followed by Stop Solution (Product # N600). Absorbances were read on a spectrophotometer at 450-550 nm.

- Submitted by
- Invitrogen Antibodies (provider)
- Main image
- Experimental details
- Sandwich ELISA of Apolipoprotein A-1 was performed by coating wells of a 96-well plate with 100 µL of an Apo A-1 Recombinant Rabbit Polyclonal Antibody (Product # 710263) at a concentration of 1 µg/mL in carbonate/bicarbonate buffer (Product # 28382) overnight at 4C. Wells were blocked with 150 µL of StartingBlock T20 (TBS) Blocking Buffer (Product # 37543) for 30 minutes, and 80 µL of recombinant human Apo A-1 (Product # 10686-H02H-50) standards ranging from 1.6-1000 ng/mL (A) or 100 µL of diluted normal human serum or diluted serum from a patient with dyslipidemia (B) were incubated for 1 hour at room temperature. The plate was washed with 1X TBST (Product # 28360), and 100 µL per well of an Apo A-1 Mouse Monoclonal Antibody (Product # MIA1404) was added to each well for 1 hour at room temperature. The plate was washed, and 100 µL per well of a biotinylated Rabbit anti-Mouse IgG Superclonal secondary antibody (Product # A27024) was incubated for 1 hour, followed by Streptavidin-HRP (Product # 21126) for 30 minutes. Detection was performed using 1-Step Ultra TMB Substrate (Product # 34028), followed by Stop Solution (Product # N600). Absorbances were read on a spectrophotometer at 450-550 nm.
Supportive validation
- Submitted by
- Invitrogen Antibodies (provider)
- Main image
- Experimental details
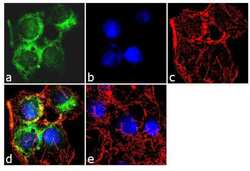
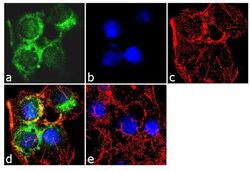
- Immunofluorescence analysis of Apolipoprotein A1 was performed using 70% confluent log phase Hep G2 cells. The cells were fixed with 4% paraformaldehyde for 10 minutes, permeabilized with 0.1% Triton™ X-100 for 10 minutes, and blocked with 2% BSA for 1 hour at room temperature. The cells were labeled with Apolipoprotein A1 (513) Mouse Monoclonal Antibody (Product # MIA1404) at 2 µg/mL in 0.1% BSA and incubated for 3 hours at room temperature and then labeled with Goat anti-Mouse IgG (H+L) Superclonal™ Secondary Antibody, Alexa Fluor® 488 conjugate (Product # A28175) a dilution of 1:2000 for 45 minutes at room temperature (Panel a: green). Nuclei (Panel b: blue) were stained with SlowFade® Gold Antifade Mountant with DAPI (Product # S36938). F-actin (Panel c: red) was stained with Alexa Fluor® 555 Rhodamine Phalloidin (Product # R415, 1:300). Panel d represents the merged image showing cytoplasmic localization. Panel e shows the no primary antibody control. The images were captured at 60X magnification.
- Submitted by
- Invitrogen Antibodies (provider)
- Main image
- Experimental details
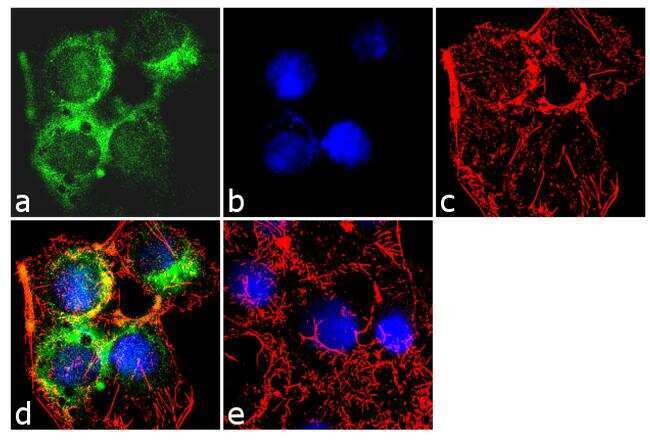
- Immunofluorescence analysis of Apolipoprotein A1 was performed using 70% confluent log phase Hep G2 cells. The cells were fixed with 4% paraformaldehyde for 10 minutes, permeabilized with 0.1% Triton™ X-100 for 10 minutes, and blocked with 2% BSA for 1 hour at room temperature. The cells were labeled with Apolipoprotein A1 (513) Mouse Monoclonal Antibody (Product # MIA1404) at 2 µg/mL in 0.1% BSA and incubated for 3 hours at room temperature and then labeled with Goat anti-Mouse IgG (H+L) Superclonal™ Secondary Antibody, Alexa Fluor® 488 conjugate (Product # A28175) a dilution of 1:2000 for 45 minutes at room temperature (Panel a: green). Nuclei (Panel b: blue) were stained with SlowFade® Gold Antifade Mountant with DAPI (Product # S36938). F-actin (Panel c: red) was stained with Alexa Fluor® 555 Rhodamine Phalloidin (Product # R415, 1:300). Panel d represents the merged image showing cytoplasmic localization. Panel e shows the no primary antibody control. The images were captured at 60X magnification.

Supportive validation
- Submitted by
- Invitrogen Antibodies (provider)
- Main image
- Experimental details
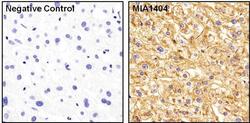
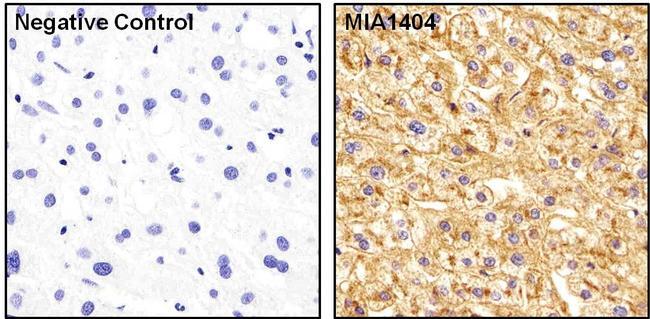
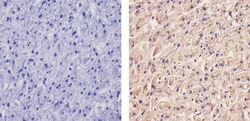
- Immunohistochemistry was performed on human liver tissue sections. To expose Apo A-1, tissues were microwaved for 10 minutes in 10mM sodium citrate, pH 6.0. Following antigen retrieval, endogenous peroxidases were blocked in a 3% hydrogen peroxide-methanol solution for 15 minutes, and then tissues were blocked in 3% BSA in PBS for 30 minutes at room temperature. Tissues were probed with an Apo A-1 monoclonal antibody (Product # MIA1404) at a dilution of 1:50 overnight at 4C, washed extensively in PBST, and detection was performed with an HRP-conjugated anti-mouse IgG secondary antibody followed by DAB substrate. Tissues were counterstained with hematoxylin.
- Submitted by
- Invitrogen Antibodies (provider)
- Main image
- Experimental details
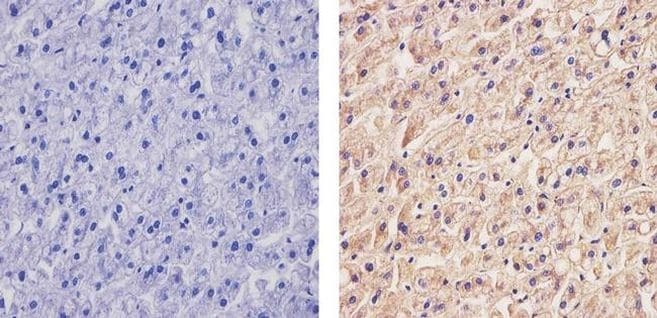
- Immunohistochemistry analysis of Apolipoprotein A-1 showing staining in the cytoplasm of paraffin-embedded human liver tissue (right) compared to a negative control without primary antibody (left). To expose target proteins, antigen retrieval was performed using 10mM sodium citrate (pH 6.0), microwaved for 8-15 min. Following antigen retrieval, tissues were blocked in 3% H2O2-methanol for 15 min at room temperature, washed with ddH2O and PBS, and then probed with a Apolipoprotein A-1 Mouse Monoclonal Antibody (Product # MIA1404) diluted in 3% BSA-PBS at a dilution of 1:100 for 1 hour at 37ºC in a humidified chamber. Tissues were washed extensively in PBST and detection was performed using an HRP-conjugated secondary antibody followed by colorimetric detection using a DAB kit. Tissues were counterstained with hematoxylin and dehydrated with ethanol and xylene to prep for mounting.
- Submitted by
- Invitrogen Antibodies (provider)
- Main image
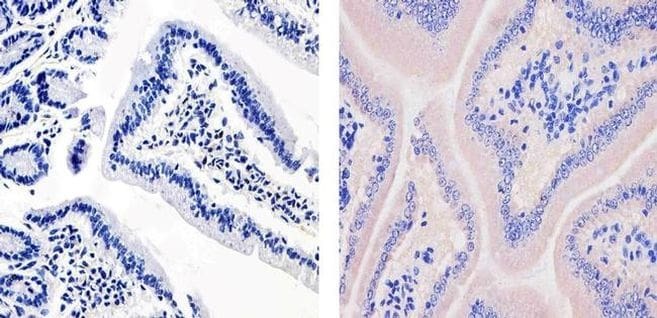
- Experimental details
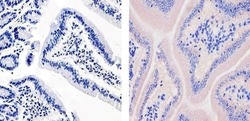
- Immunohistochemistry analysis of Apolipoprotein A-1 showing staining in the cytoplasm of paraffin-embedded mouse small intestine tissue (right) compared to a negative control without primary antibody (left). To expose target proteins, antigen retrieval was performed using 10mM sodium citrate (pH 6.0), microwaved for 8-15 min. Following antigen retrieval, tissues were blocked in 3% H2O2-methanol for 15 min at room temperature, washed with ddH2O and PBS, and then probed with a Apolipoprotein A-1 Mouse Monoclonal Antibody (Product # MIA1404) diluted in 3% BSA-PBS at a dilution of 1:100 for 1 hour at 37ºC in a humidified chamber. Tissues were washed extensively in PBST and detection was performed using an HRP-conjugated secondary antibody followed by colorimetric detection using a DAB kit. Tissues were counterstained with hematoxylin and dehydrated with ethanol and xylene to prep for mounting.
Supportive validation
- Submitted by
- Invitrogen Antibodies (provider)
- Main image

- Experimental details
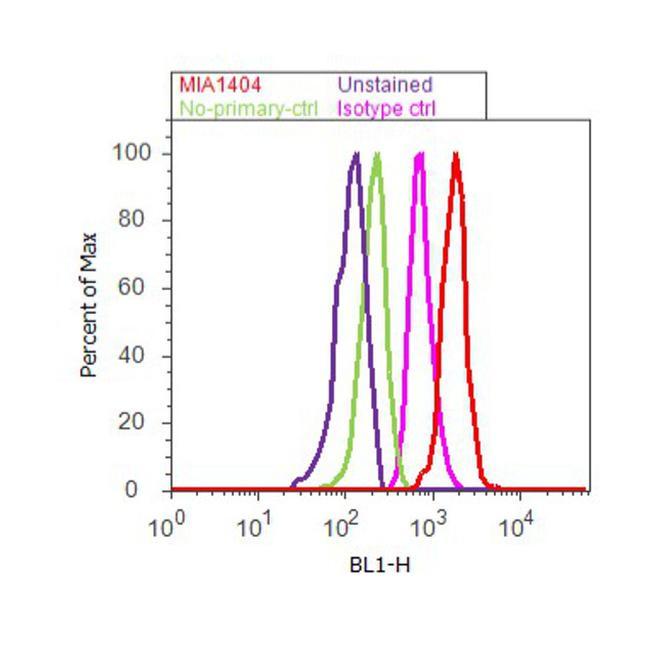
- Flow cytometry analysis of Apolipoprotein A-1 was done on Hep G2 cells. Cells were fixed with 70% ethanol for 10 minutes, permeabilized with 0.25% Triton™ X-100 for 20 minutes, and blocked with 5% BSA for 30 minutes at room temperature. Cells were labeled with Apolipoprotein A-1 Mouse Monoclonal Antibody (MIA1404, red histogram) or with mouse isotype control (pink histogram) at 3-5 ug/million cells in 2.5% BSA. After incubation at room temperature for 2 hours, the cells were labeled with Alexa Fluor® 488 Rabbit Anti-Mouse Secondary Antibody (A11059) at a dilution of 1:400 for 30 minutes at room temperature. The representative 10,000 cells were acquired and analyzed for each sample using an Attune® Acoustic Focusing Cytometer. The purple histogram represents unstained control cells and the green histogram represents no-primary-antibody control..
Supportive validation
- Submitted by
- Invitrogen Antibodies (provider)
- Main image

- Experimental details
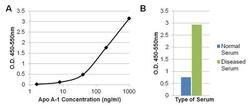
- Sandwich ELISA of Apolipoprotein A-1 was performed by coating wells of a 96-well plate with 100 µL of an Apo A-1 Recombinant Rabbit Polyclonal Antibody (Product # 710263) at a concentration of 1 µg/mL in carbonate/bicarbonate buffer (Product # 28382) overnight at 4C. Wells were blocked with 150 µL of StartingBlock T20 (TBS) Blocking Buffer (Product # 37543) for 30 minutes, and 80 µL of recombinant human Apo A-1 (Product # 10686-H02H-50) standards ranging from 1.6-1000 ng/mL (A) or 100 µL of diluted normal human serum or diluted serum from a patient with dyslipidemia (B) were incubated for 1 hour at room temperature. The plate was washed with 1X TBST (Product # 28360), and 100 µL per well of an Apo A-1 Mouse Monoclonal Antibody (Product # MIA1404) was added to each well for 1 hour at room temperature. The plate was washed, and 100 µL per well of a biotinylated Rabbit anti-Mouse IgG Superclonal secondary antibody (Product # A27024) was incubated for 1 hour, followed by Streptavidin-HRP (Product # 21126) for 30 minutes. Detection was performed using 1-Step Ultra TMB Substrate (Product # 34028), followed by Stop Solution (Product # N600). Absorbances were read on a spectrophotometer at 450-550 nm.
- Submitted by
- Invitrogen Antibodies (provider)
- Main image
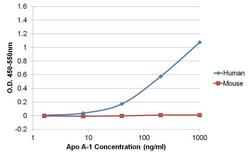
- Experimental details
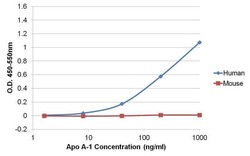
- Sandwich ELISA of Apolipoprotein A-1 was performed by coating wells of a 96-well plate with 100 µL of an Apo A-1 Recombinant Rabbit Polyclonal Antibody (Product # 710263) diluted to a concentration of 1 µg/mL in carbonate/bicarbonate buffer (Product # 28382) overnight at 4C. Wells were blocked with 150 µL of StartingBlock T20 (TBS) Blocking Buffer (Product # 37543) for 30 minutes, and 80 µL of recombinant human Apo A-1 (Product # 10686-H02H-50) or recombinant mouse Apo A-1 (Product # 50918-M02H-50) was added to the plate at concentrations ranging from 1.6-1000 ng/mL and incubated for 1 hour at room temperature. The plate was washed with 1X TBST (Product # 28360), and 100 µL per well of an Apo A-1 Mouse Monoclonal Antibody (Product # MIA1404) was added to each well for 1 hour at room temperature. The plate was washed, and 100 µL per well of an HRP-conjugated Rabbit anti-Mouse IgG cross-adsorbed secondary antibody (Product # 31452) was incubated for 30 minutes at room temperature. Detection was performed using 1-Step Ultra TMB Substrate (Product # 34028), followed by Stop Solution (Product # N600). Absorbances were read on a spectrophotometer at 450-550 nm.

- Submitted by
- Invitrogen Antibodies (provider)
- Main image

- Experimental details
- Sandwich ELISA of Apolipoprotein A-1 was performed by coating wells of a 96-well plate with 100 µL of an Apo A-1 rabbit monoclonal antibody (Product # 701239) at a concentration of 1 µg/mL in carbonate/bicarbonate buffer (Product # 28382) overnight at 4C. Wells were blocked with 150 µL of StartingBlock T20 (TBS) Blocking Buffer (Product # 37543) for 30 minutes, and 80 µL of recombinant human Apo A-1 (Product # 10686-H02H-50) standards ranging from 1.6-1000 ng/mL (A) or 100 µL of diluted normal human serum or diluted serum from a patient with dyslipidemia (B) were incubated for 1 hour at room temperature. The plate was washed with 1X TBST (Product # 28360), and 100 µL per well of an Apo A-1 mouse monoclonal antibody (Product # MIA1404) was added to each well for 1 hour at room temperature. The plate was washed, and 100 µL per well of a biotinylated rabbit anti-mouse IgG Superclonal? secondary antibody (Product # A27024) was incubated for 1 hour, followed by Streptavidin-HRP (Product # 21126) for 30 minutes. Detection was performed using 1-Step Ultra TMB Substrate (Product # 34028), followed by Stop Solution (Product # N600). Absorbances were read on a spectrophotometer at 450-550 nm.
- Submitted by
- Invitrogen Antibodies (provider)
- Main image

- Experimental details
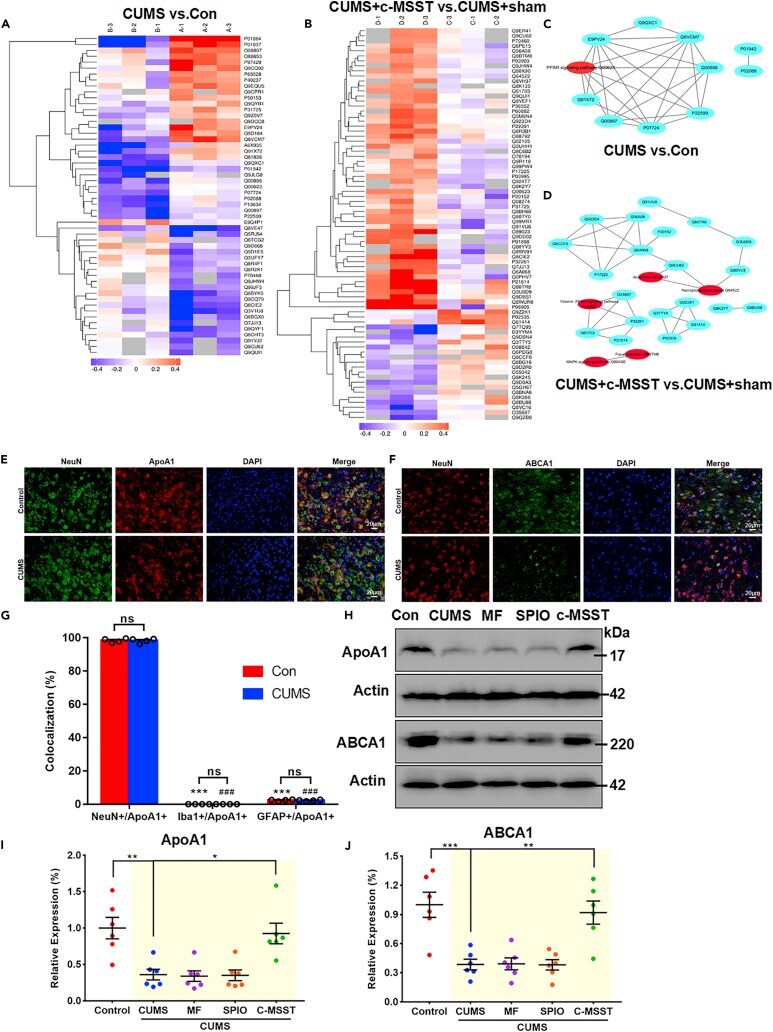
- Activated ABAC1/ApoA1 signaling is involved in the antidepressant action of c-MSST targeting the left V1 of CUMS mice (A and B) Heat map of the differentially expressed proteins analyzed by iTRAQ (Group A, Control mice; Group B, CUMS mice; Group C, Sham c-MSST mice; Group D, c-MSST mice), n = 3 mice per group. (C and D) PPI network of the differential proteins in the four groups. The red circles indicate the major/hub nodes of the PPI network. (E and F) Representative fluorescence images of the mouse V1. Immunofluorescent double labeling for ApoA1 (red)/NeuN (green) and ABCA1 (green)/NeuN (red). Nuclei were stained blue with DAPI. n = 4 mice per group. Scale bar, 20 mum. (G) Colocalization of the three neurocytemarkers with ApoA1 was quantified in the left V1 of control and CUMS mice. n = 8-9 mice per group. Data are expressed as the mean +-SEM. ***p < 0.001 versus Con-NeuN+/ApoA1+; ### p < 0.001 versus CUMS-NeuN+/ApoA1+ using ANOVA with Sidak correction. (H-J) Expression of ApoA1 and ABCA1 in the left V1 of control and CUMS mice. n = 6 mice per group. Data are expressed as mean +-SEM. *p < 0.05, **p < 0.01, ***p < 0.001 using ANOVA with Bonferroni correction. iTRAQ, isobaric tagging for relative and absolute quantification; PPI, protein-protein interaction; ApoA1, apolipoprotein A1; ABCA1, ATP-binding cassette, subfamily A, member one; NeuN, neuronal nuclei; DAPI, 4',6-diamidino-2-phenylindole; SPIO, superparamagnetic iron oxide; MF, magnetic field; c-MSST, combined magnetic
- Submitted by
- Invitrogen Antibodies (provider)
- Main image
- Experimental details
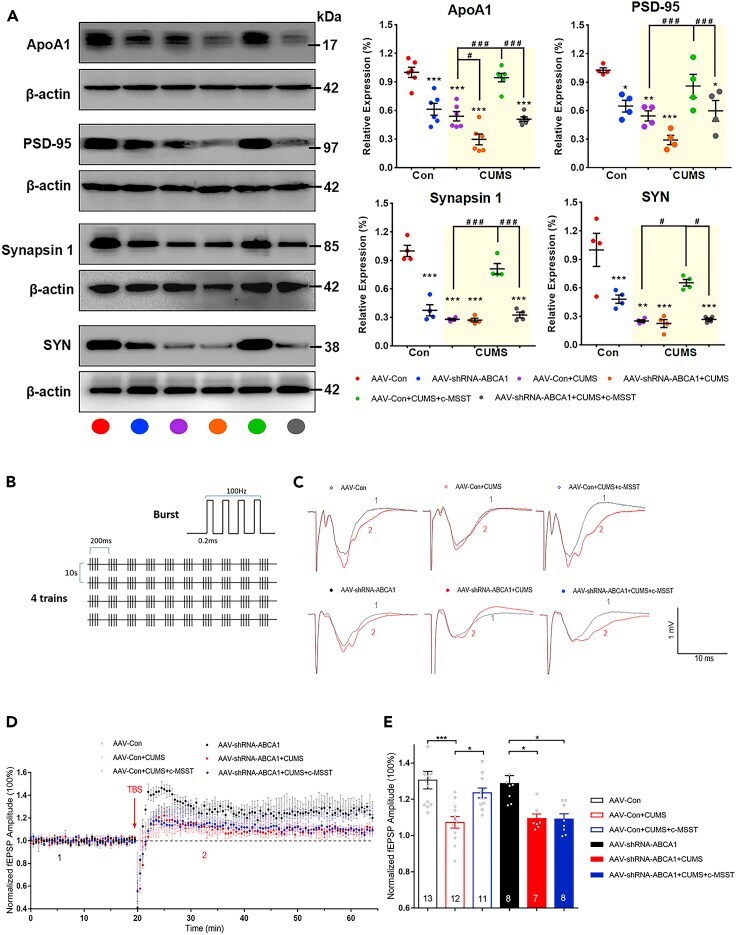
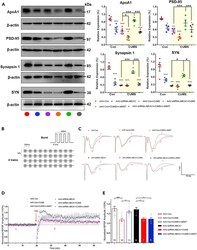
- Neuron-specific knockdown of ABCA1 blocks the antidepressant effects of c-MSST via regulation of synaptic plasticity in the mouse V1 region (A) Representative immunoblots and bar graphs showing the expression of ApoA1, PSD-95, synapsin-1 and SYN in the mouse V1 after 5 days of 5 Hz c-MSST. n = four to six mice per group. Data are expressed as mean +-SEM. *p < 0.05, **p < 0.01, ***p < 0.001 versus AAV-Con group, # p < 0.05, ### p < 0.001 using ANOVA with Bonferroni correction. (B) TBS stimulation parameter. (C) Representative traces were taken at time points 1 and 2 indicated in the summary plots; fEPSPs recorded for each condition before (1) and 45 min after the application of TBS (2). (D and E) Averaged fEPSP amplitude and summary plots of LTP induced by TBS. n = 7-13 mice per group. Data are expressed as mean +- SEM *p < 0.05, ***p < 0.001 using ANOVA with Bonferroni correction. c-MSST, combined magnetic stimulation system treatment; CUMS, chronic unpredictable mild stress; ApoA1, apolipoprotein A1; PSD-95, postsynaptic density-95; SYN, synaptophysin; fEPSP, field excitatory postsynaptic potentiates; TBS, theta-burst stimulation; LTP, long-term potentiation. See also Figures S6 and S7 .