Explore
 Validate
 Learn
Learn Western blot
 Immunocytochemistry
Antibody data
- Antibody Data
- Antigen structure
- References [1]
- Comments [0]
- Validations
- Immunocytochemistry [1]
- Immunohistochemistry [1]
- Other assay [1]
Submit
Validation data
Reference
Comment
Report error
- Product number
- PA5-30960 - Provider product page

- Provider
- Invitrogen Antibodies
- Product name
- hnRNP A2B1 Polyclonal Antibody
- Antibody type
- Polyclonal
- Antigen
- Recombinant full-length protein
- Description
- Recommended positive controls: 293T, A431, Jurkat, Raji. Predicted reactivity: Mouse (100%), Rat (99%), Xenopus laevis (92%), Chicken (99%), Rhesus Monkey (100%), Bovine (100%). Store product as a concentrated solution. Centrifuge briefly prior to opening the vial.
- Reactivity
- Human
- Host
- Rabbit
- Isotype
- IgG
- Vial size
- 100 μL
- Concentration
- 0.72 mg/mL
- Storage
- Store at 4°C short term. For long term storage, store at -20°C, avoiding freeze/thaw cycles.
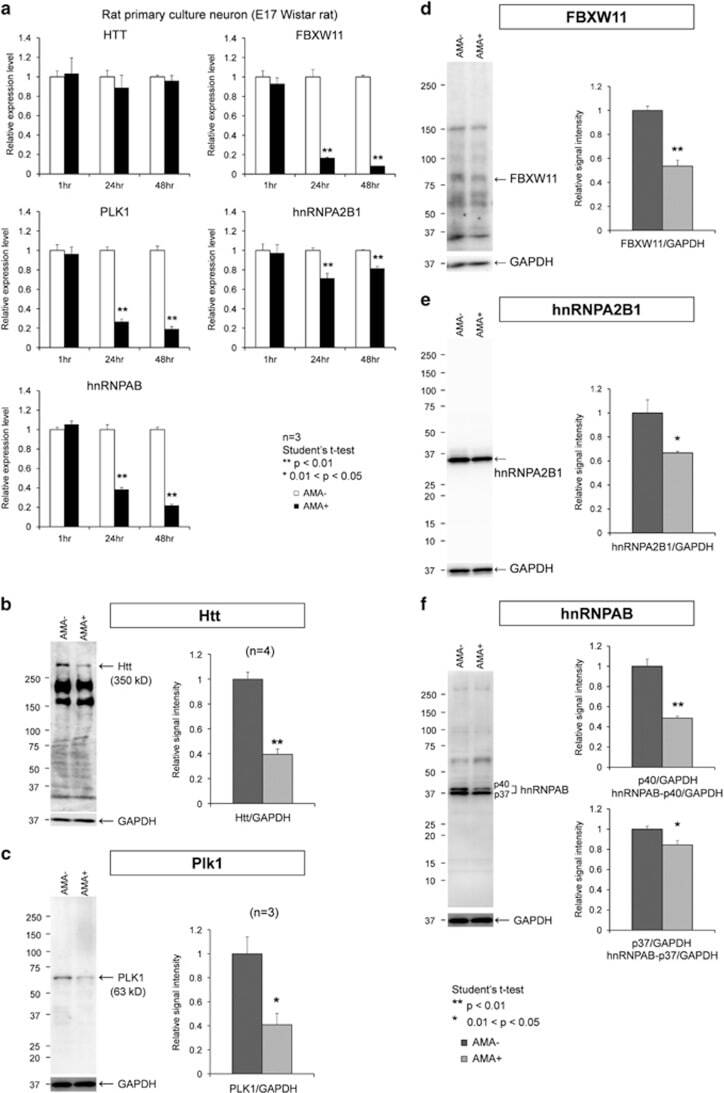
Submitted references The hnRNP-Htt axis regulates necrotic cell death induced by transcriptional repression through impaired RNA splicing.
Mao Y, Tamura T, Yuki Y, Abe D, Tamada Y, Imoto S, Tanaka H, Homma H, Tagawa K, Miyano S, Okazawa H
Cell death & disease 2016 Apr 28;7(4):e2207
Cell death & disease 2016 Apr 28;7(4):e2207
No comments: Submit comment
Supportive validation
- Submitted by
- Invitrogen Antibodies (provider)
- Main image
- Experimental details
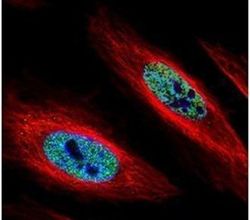
- Immunofluorescent analysis of hnRNP A2B1 in paraformaldehyde-fixed HeLa cells using a hnRNP A2B1 polyclonal antibody (Product # PA5-30960) (Green) at a 1:500 dilution. Alpha-tubulin filaments were labeled with Product # PA5-29281 (Red) at a 1:2000.

Supportive validation
- Submitted by
- Invitrogen Antibodies (provider)
- Main image
- Experimental details
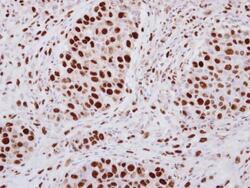
- Immunohistochemical analysis of paraffin-embedded human breast cancer, using hnRNP A2B1 (Product # PA5-30960) antibody at 1:250 dilution. Antigen Retrieval: EDTA based buffer, pH 8.0, 15 min.

Supportive validation
- Submitted by
- Invitrogen Antibodies (provider)
- Main image
- Experimental details
- Figure 4 Chronological changes of RNA and protein expression levels in rat cortical neurons during TRIAD. ( a ) Chronological changes of RNA expression levels of candidate key genes were evaluated by RT-qPCR from 1 to 47 h after addition of AMA to primary culture of rat cortical neurons. ( b ) Protein expression levels of rat Htt were evaluated by western blot before and 24 h after addition of AMA to primary culture of rat cortical neurons. Right graph shows quantitative analysis. ( c ) Protein expression levels of rat Plk1 were evaluated by western blot before and 24 h after addition of AMA to primary culture of rat cortical neurons. Right graph shows quantitative analysis. ( d ) Protein expression levels of rat FBXW11 were evaluated by western blot before and 24 h after addition of AMA to primary culture of rat cortical neurons. Right graph shows quantitative analysis. ( e ) Protein expression levels of rat hnRNPA2B1 were evaluated by western blot before and 24 h after addition of AMA to primary culture of rat cortical neurons. Right graph shows quantitative analysis. ( f ) Protein expression levels of rat hnRNPAB were evaluated by western blot before and 24 h after addition of AMA to primary culture of rat cortical neurons. Right graphs show quantitative analyses of two isoforms