Explore
 Validate
 Learn
Learn Western blot
 Immunohistochemistry
Antibody data
- Antibody Data
- Antigen structure
- References [1]
- Comments [0]
- Validations
- Immunohistochemistry [1]
- Other assay [2]
Submit
Validation data
Reference
Comment
Report error
- Product number
- PA5-47239 - Provider product page

- Provider
- Invitrogen Antibodies
- Product name
- Kallikrein 6 Polyclonal Antibody
- Antibody type
- Polyclonal
- Antigen
- Recombinant full-length protein
- Description
- In direct ELISAs, less than 1% cross-reactivity with recombinant human (rh) Kallikrein 3, rhKallikrein 5, rhKallikrein 11, rhKallikrein 13, rhKallikrein 14, and rhKallikrein 15 is observed. Reconstitute at 0.2 mg/mL in sterile PBS.
- Reactivity
- Human
- Host
- Goat
- Isotype
- IgG
- Vial size
- 100 μg
- Concentration
- 0.2 mg/mL
- Storage
- -20°C, Avoid Freeze/Thaw Cycles
Submitted references Altered human oligodendrocyte heterogeneity in multiple sclerosis.
Jäkel S, Agirre E, Mendanha Falcão A, van Bruggen D, Lee KW, Knuesel I, Malhotra D, Ffrench-Constant C, Williams A, Castelo-Branco G
Nature 2019 Feb;566(7745):543-547
Nature 2019 Feb;566(7745):543-547
No comments: Submit comment
Supportive validation
- Submitted by
- Invitrogen Antibodies (provider)
- Main image
- Experimental details
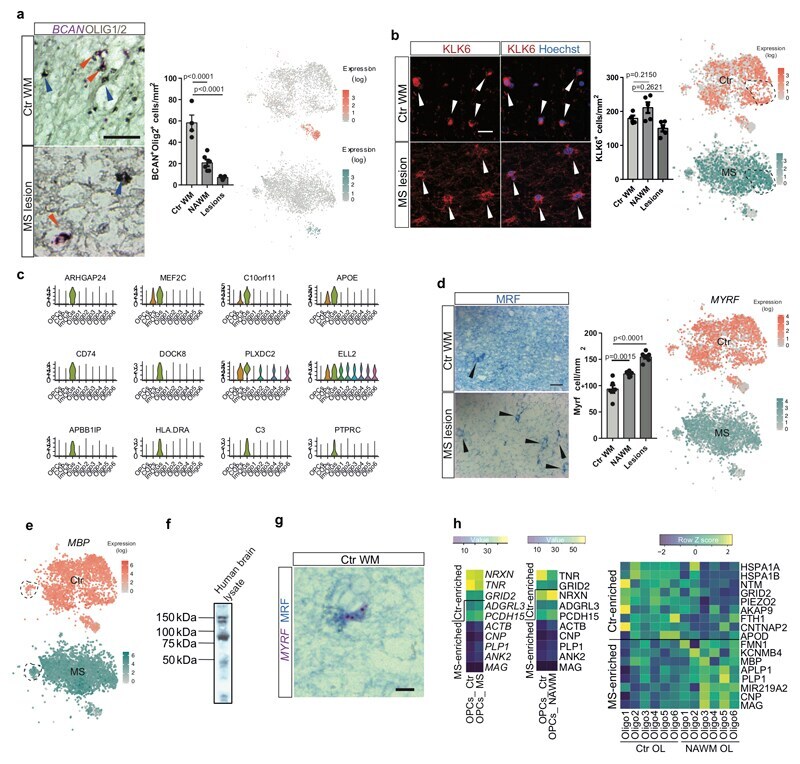
- Immunohistochemical analysis of Kallikrein 6 in immersion fixed paraffin-embedded sections of human breast cancer tissue. Samples were incubated in Kallikrein 6 polyclonal antibody (Product # PA5-47239) using a dilution of 15 µg/mL overnight at 4 °C. Tissue was stained with the Anti-Goat HRP-DAB Cell & Tissue Staining Kit (brown) and counterstained with hematoxylin (blue).

Supportive validation
- Submitted by
- Invitrogen Antibodies (provider)
- Main image
- Experimental details
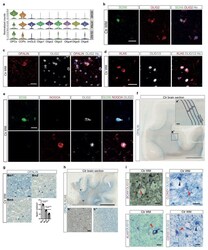
- Extended Figure4 Validation of novel OL sub-cluster markers and regional OL subpopulation distribution in human Ctr brain. a , Violin plots showing SOX6 , RTN4 (NOGOA) and OLIG2 normalized expression counts in different OL subpopulations (n=number of nuclei in Ctr nOPC=273, nCOP=153, ImOLG=81, nOligo1=952, nOligo2=388, nOligo3=82, nOligo4=724, nOligo5=393, nOligo6=991). Violin plots are centered around the median with interquartile ranges, with shape representing cell distribution. b , Colocalization of SOX6 and OLIG2 as a marker for OPCs (scale bar: 20um). c , Colocalization of OPALIN and OLIG2 as a marker for Oligo6 (scale bar: 20um). d , Colocalization of KLK6 and OLIG1/2 as a marker for Oligo5. e , Colocalization of SOX6, NOGOA and OLIG2. SOX6+OLIG2+NOGOA- cells (upper panel) are OPCs, NOGOA+OLIG2+SOX6- cells are mature OL (scale bar: 10um). f , OPALIN staining of a Ctr brain section (scale bars: 5mm, inlay: 300um). g , OPALIN+ Oligo6 in different bins of 300um increments from the GM/WM border (scale bar:50um, n=3 different Ctr and MS individuals with NAWM and lesions, ANOVA, data are displayed as mean +- SEM). h , Combined OPALIN and KLK6 staining of another human Ctr brain block (scale bar: 5mm, inlays: 50um). In b - e experiments were independently performed in 2 batches. i , Validation of novel OL mRNA markers in combination with OLIG1/2 IHC. BCAN (top left), CLDND1 (top right), KLK6 (bottom left) and CDH20 (bottom right). Red arrowheads: marker+/OLIG1/
- Submitted by
- Invitrogen Antibodies (provider)
- Main image
- Experimental details
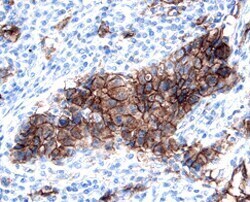
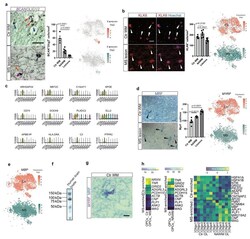
- Extended Figure8 Validation of skewed MS heterogeneity and OL gene expression profiling in Ctr and NAWM. a , Validation of BCAN-expressing OPCs in combination with OLIG1/2 IHC. Red arrowhead: BCAN +/OLIG1/2+ OPC, blue arrowhead: BCAN-/OLIG1/2+ OL (scale bar: 20um) and tSNE overlay of BCAN expression in the snRNA-seq dataset in Ctr and MS, (scale bar: 20um, data displayed as mean+-SEM, n=4 samples from different control individuals, n=6 NAWM samples and n=5 MS lesion samples from different MS patients, ANOVA. b , KLK6-expressing OL in Ctr WM, NAWM and MS lesions (scale bar: 50um, data displayed as mean+-SEM, n=4 samples from different Ctr individuals and n=5 different MS individuals, ANOVA) and tSNE overlay of KLK6 expression in the Ctr and MS snRNA-seq dataset. c , Violin plots showing the normalized expression counts of genes enriched in ImOLG in the snRNA-seq dataset (nOPC=352, nCOP=242, nImOLG=207, nOligo1=1129, nOligo2=1839, nOligo3=775, nOligo4=1579, nOligo5=1167, nOligo6=1484). Violin plots are centered around the median with interquartile ranges, with shape representing cell distribution. d , MRF IHC in Ctr WM, NAWM and MS lesions (scale bar: 50um, data displayed as mean+-SEM, n=6 samples from different control individuals, and n=7 different MS patients, ANOVA) and tSNE overlay of MYRF expression in the snRNA-seq dataset. e, tSNE overlay of MBP expression in the Ctr and the MS snRNA-seq dataset (n=4037 OL in Ctr and n=4737 OL in MS). f , Western blot of