Explore
 Validate
 Learn
Learn Western blot
 ELISA
ELISA Immunocytochemistry
Antibody data
- Antibody Data
- Antigen structure
- References [18]
- Comments [0]
- Validations
- Immunocytochemistry [4]
- Immunohistochemistry [3]
- Flow cytometry [1]
- Chromatin Immunoprecipitation [2]
- Other assay [13]
Submit
Validation data
Reference
Comment
Report error
- Product number
- 36-6300 - Provider product page

- Provider
- Invitrogen Antibodies
- Product name
- EZH2 Polyclonal Antibody
- Antibody type
- Polyclonal
- Antigen
- Synthetic peptide
- Reactivity
- Human, Mouse
- Host
- Rabbit
- Isotype
- IgG
- Vial size
- 100 μg
- Concentration
- 0.25 mg/mL
- Storage
- -20°C
Submitted references Exosomal lncRNA UCA1 Derived From Pancreatic Stellate Cells Promotes Gemcitabine Resistance in Pancreatic Cancer via the SOCS3/EZH2 Axis.
In vivo antagonistic role of the Human T-Cell Leukemia Virus Type 1 regulatory proteins Tax and HBZ.
ARID1A alterations and their clinical significance in cholangiocarcinoma.
The microRNA signature of patients with sunitinib failure: regulation of UHRF1 pathways by microRNA-101 in renal cell carcinoma.
Ribavirin as a tri-targeted antitumor repositioned drug.
Repression of Igf1 expression by Ezh2 prevents basal cell differentiation in the developing lung.
Chromatin regulator PRC2 is a key regulator of epigenetic plasticity in glioblastoma.
The histone chaperone Spt6 coordinates histone H3K27 demethylation and myogenesis.
Expression of EZH2 in renal cell carcinoma as a novel prognostic marker.
Cancer angiogenesis induced by Kaposi sarcoma-associated herpesvirus is mediated by EZH2.
Generation of bivalent chromatin domains during cell fate decisions.
Derepression of CLDN3 and CLDN4 during ovarian tumorigenesis is associated with loss of repressive histone modifications.
UTX mediates demethylation of H3K27me3 at muscle-specific genes during myogenesis.
Chromatin analysis of occluded genes.
Expression of stem cell markers in the human fetal kidney.
MicroRNA-26a targets the histone methyltransferase Enhancer of Zeste homolog 2 during myogenesis.
Dynamic changes in histone-methylation 'marks' across the locus encoding interferon-gamma during the differentiation of T helper type 2 cells.
Noncoding RNA synthesis and loss of Polycomb group repression accompanies the colinear activation of the human HOXA cluster.
Chi Y, Xin H, Liu Z
Frontiers in oncology 2021;11:671082
Frontiers in oncology 2021;11:671082
In vivo antagonistic role of the Human T-Cell Leukemia Virus Type 1 regulatory proteins Tax and HBZ.
Akkouche A, Moodad S, Hleihel R, Skayneh H, Chambeyron S, El Hajj H, Bazarbachi A
PLoS pathogens 2021 Jan;17(1):e1009219
PLoS pathogens 2021 Jan;17(1):e1009219
ARID1A alterations and their clinical significance in cholangiocarcinoma.
Namjan A, Techasen A, Loilome W, Sa-Ngaimwibool P, Jusakul A
PeerJ 2020;8:e10464
PeerJ 2020;8:e10464
The microRNA signature of patients with sunitinib failure: regulation of UHRF1 pathways by microRNA-101 in renal cell carcinoma.
Goto Y, Kurozumi A, Nohata N, Kojima S, Matsushita R, Yoshino H, Yamazaki K, Ishida Y, Ichikawa T, Naya Y, Seki N
Oncotarget 2016 Sep 13;7(37):59070-59086
Oncotarget 2016 Sep 13;7(37):59070-59086
Ribavirin as a tri-targeted antitumor repositioned drug.
De la Cruz-Hernandez E, Medina-Franco JL, Trujillo J, Chavez-Blanco A, Dominguez-Gomez G, Perez-Cardenas E, Gonzalez-Fierro A, Taja-Chayeb L, Dueñas-Gonzalez A
Oncology reports 2015 May;33(5):2384-92
Oncology reports 2015 May;33(5):2384-92
Repression of Igf1 expression by Ezh2 prevents basal cell differentiation in the developing lung.
Galvis LA, Holik AZ, Short KM, Pasquet J, Lun AT, Blewitt ME, Smyth IM, Ritchie ME, Asselin-Labat ML
Development (Cambridge, England) 2015 Apr 15;142(8):1458-69
Development (Cambridge, England) 2015 Apr 15;142(8):1458-69
Chromatin regulator PRC2 is a key regulator of epigenetic plasticity in glioblastoma.
Natsume A, Ito M, Katsushima K, Ohka F, Hatanaka A, Shinjo K, Sato S, Takahashi S, Ishikawa Y, Takeuchi I, Shimogawa H, Uesugi M, Okano H, Kim SU, Wakabayashi T, Issa JP, Sekido Y, Kondo Y
Cancer research 2013 Jul 15;73(14):4559-70
Cancer research 2013 Jul 15;73(14):4559-70
The histone chaperone Spt6 coordinates histone H3K27 demethylation and myogenesis.
Wang AH, Zare H, Mousavi K, Wang C, Moravec CE, Sirotkin HI, Ge K, Gutierrez-Cruz G, Sartorelli V
The EMBO journal 2013 Apr 17;32(8):1075-86
The EMBO journal 2013 Apr 17;32(8):1075-86
Expression of EZH2 in renal cell carcinoma as a novel prognostic marker.
Lee HW, Choe M
Pathology international 2012 Nov;62(11):735-41
Pathology international 2012 Nov;62(11):735-41
Cancer angiogenesis induced by Kaposi sarcoma-associated herpesvirus is mediated by EZH2.
He M, Zhang W, Bakken T, Schutten M, Toth Z, Jung JU, Gill P, Cannon M, Gao SJ
Cancer research 2012 Jul 15;72(14):3582-92
Cancer research 2012 Jul 15;72(14):3582-92
Generation of bivalent chromatin domains during cell fate decisions.
De Gobbi M, Garrick D, Lynch M, Vernimmen D, Hughes JR, Goardon N, Luc S, Lower KM, Sloane-Stanley JA, Pina C, Soneji S, Renella R, Enver T, Taylor S, Jacobsen SE, Vyas P, Gibbons RJ, Higgs DR
Epigenetics & chromatin 2011 Jun 6;4(1):9
Epigenetics & chromatin 2011 Jun 6;4(1):9
Derepression of CLDN3 and CLDN4 during ovarian tumorigenesis is associated with loss of repressive histone modifications.
Kwon MJ, Kim SS, Choi YL, Jung HS, Balch C, Kim SH, Song YS, Marquez VE, Nephew KP, Shin YK
Carcinogenesis 2010 Jun;31(6):974-83
Carcinogenesis 2010 Jun;31(6):974-83
UTX mediates demethylation of H3K27me3 at muscle-specific genes during myogenesis.
Seenundun S, Rampalli S, Liu QC, Aziz A, Palii C, Hong S, Blais A, Brand M, Ge K, Dilworth FJ
The EMBO journal 2010 Apr 21;29(8):1401-11
The EMBO journal 2010 Apr 21;29(8):1401-11
Chromatin analysis of occluded genes.
Lee JH, Gaetz J, Bugarija B, Fernandes CJ, Snyder GE, Bush EC, Lahn BT
Human molecular genetics 2009 Jul 15;18(14):2567-74
Human molecular genetics 2009 Jul 15;18(14):2567-74
Expression of stem cell markers in the human fetal kidney.
Metsuyanim S, Harari-Steinberg O, Buzhor E, Omer D, Pode-Shakked N, Ben-Hur H, Halperin R, Schneider D, Dekel B
PloS one 2009 Aug 21;4(8):e6709
PloS one 2009 Aug 21;4(8):e6709
MicroRNA-26a targets the histone methyltransferase Enhancer of Zeste homolog 2 during myogenesis.
Wong CF, Tellam RL
The Journal of biological chemistry 2008 Apr 11;283(15):9836-43
The Journal of biological chemistry 2008 Apr 11;283(15):9836-43
Dynamic changes in histone-methylation 'marks' across the locus encoding interferon-gamma during the differentiation of T helper type 2 cells.
Chang S, Aune TM
Nature immunology 2007 Jul;8(7):723-31
Nature immunology 2007 Jul;8(7):723-31
Noncoding RNA synthesis and loss of Polycomb group repression accompanies the colinear activation of the human HOXA cluster.
Sessa L, Breiling A, Lavorgna G, Silvestri L, Casari G, Orlando V
RNA (New York, N.Y.) 2007 Feb;13(2):223-39
RNA (New York, N.Y.) 2007 Feb;13(2):223-39
No comments: Submit comment
Supportive validation
- Submitted by
- Invitrogen Antibodies (provider)
- Main image
- Experimental details
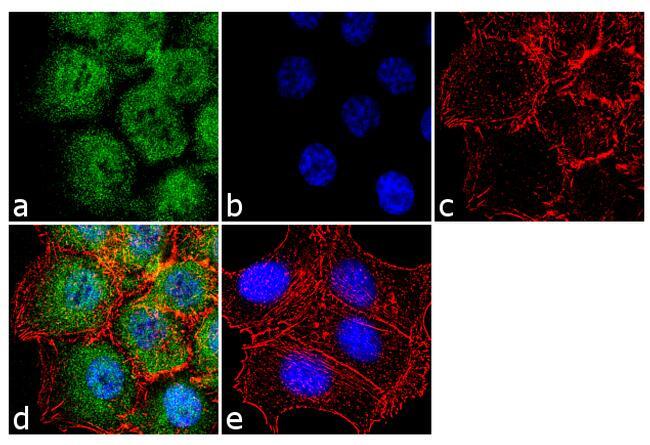
- Immunofluorescence analysis of EZH2 was performed using 70% confluent log phase HCT 116 cells. The cells were fixed with 4% paraformaldehyde for 10 minutes, permeabilized with 0.1% Triton™ X-100 for 10 minutes, and blocked with 1% BSA for 1 hour at room temperature. The cells were labeled with EZH2 Rabbit Polyclonal Antibody (Product # 36-6300) at 2 µg/mL in 0.1% BSA and incubated for 3 hours at room temperature and then labeled with Goat anti-Rabbit IgG (H+L) Superclonal™ Secondary Antibody, Alexa Fluor® 488 conjugate (Product # A27034) at a dilution of 1:2000 for 45 minutes at room temperature (Panel a: green). Nuclei (Panel b: blue) were stained with SlowFade® Gold Antifade Mountant with DAPI (Product # S36938). F-actin (Panel c: red) was stained with Alexa Fluor® 555 Rhodamine Phalloidin (Product # R415, 1:300). Panel d represents the merged image showing cytoplasmic and nuclear localization. Panel e shows the no primary antibody control. The images were captured at 60X magnification.

- Submitted by
- Invitrogen Antibodies (provider)
- Main image
- Experimental details
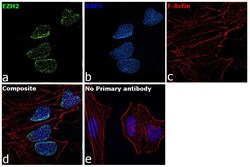
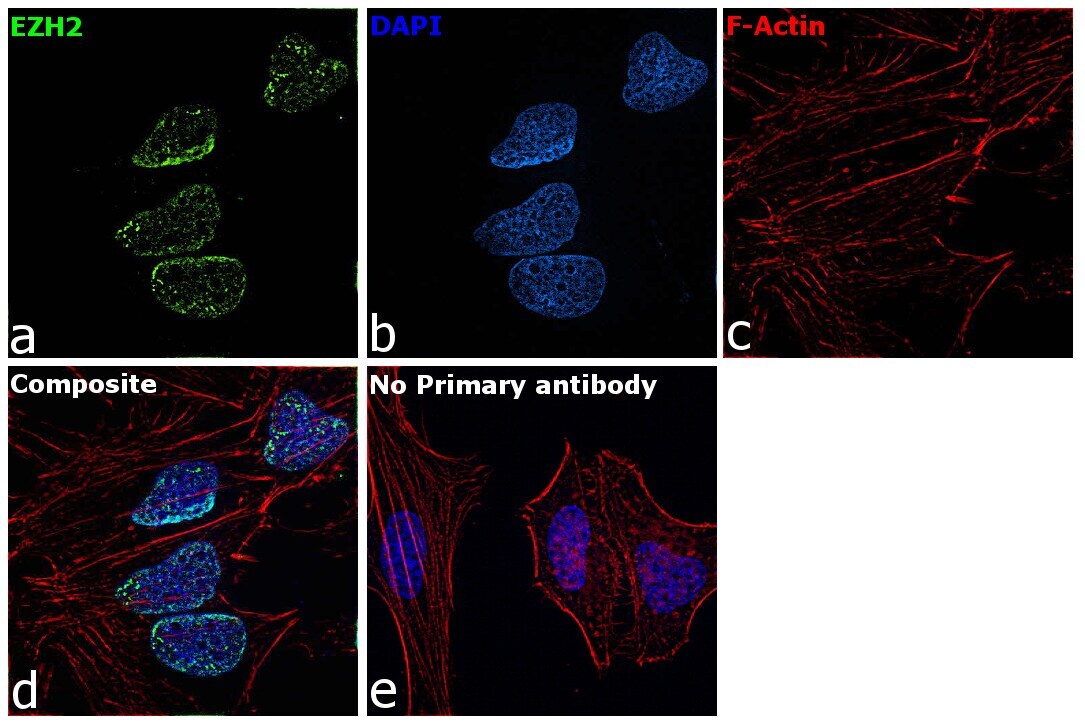
- Immunofluorescence analysis of EZH2 was performed using 70% confluent log phase HeLa cells. The cells were fixed with 4% paraformaldehyde for 10 minutes, permeabilized with 0.1% Triton™ X-100 for 15 minutes, and blocked with 2% BSA for 45 minutes at room temperature. The cells were labeled with Anti-EZH2 Polyclonal Antibody (Product # 36-6300) at 1:200 dilution in 0.1% BSA, incubated at 4 degree celsius overnight and then labeled with Goat anti-Rabbit IgG (H+L) Superclonal™ Recombinant Secondary Antibody, Alexa Fluor® 488 conjugate (Product # A27034), (1:3000 dilution), for 45 minutes at room temperature (Panel a: Green). Nuclei (Panel b: Blue) were stained with ProLong™ Diamond Antifade Mountant with DAPI (Product # P36962). F-actin (Panel c: Red) was stained withRhodamine Phalloidin (Product # R415, 1:300). Panel d represents the merged image showing EZH2 specific nuclear localization. Panel e represents control cells with no primary antibody to assess background. The images were captured at 60X magnification.
- Submitted by
- Invitrogen Antibodies (provider)
- Main image

- Experimental details
- Immunofluorescence analysis of EZH2 was performed using 70% confluent log phase HCT 116 cells. The cells were fixed with 4% paraformaldehyde for 10 minutes, permeabilized with 0.1% Triton™ X-100 for 10 minutes, and blocked with 1% BSA for 1 hour at room temperature. The cells were labeled with EZH2 Rabbit Polyclonal Antibody (Product # 36-6300) at 2 µg/mL in 0.1% BSA and incubated for 3 hours at room temperature and then labeled with Goat anti-Rabbit IgG (Heavy Chain) Superclonal™ Secondary Antibody, Alexa Fluor® 488 conjugate (Product # A27034) at a dilution of 1:2000 for 45 minutes at room temperature (Panel a: green). Nuclei (Panel b: blue) were stained with SlowFade® Gold Antifade Mountant with DAPI (Product # S36938). F-actin (Panel c: red) was stained with Alexa Fluor® 555 Rhodamine Phalloidin (Product # R415, 1:300). Panel d represents the merged image showing cytoplasmic and nuclear localization. Panel e shows the no primary antibody control. The images were captured at 60X magnification.
- Submitted by
- Invitrogen Antibodies (provider)
- Main image

- Experimental details
- Immunofluorescence analysis of EZH2 was performed using 70% confluent log phase HeLa cells. The cells were fixed with 4% paraformaldehyde for 10 minutes, permeabilized with 0.1% Triton™ X-100 for 15 minutes, and blocked with 2% BSA for 45 minutes at room temperature. The cells were labeled with Anti-EZH2 Polyclonal Antibody (Product # 36-6300) at 1:200 dilution in 0.1% BSA, incubated at 4 degree celsius overnight and then labeled with Goat anti-Rabbit IgG (Heavy Chain) Superclonal™ Recombinant Secondary Antibody, Alexa Fluor® 488 conjugate (Product # A27034), (1:3000 dilution), for 45 minutes at room temperature (Panel a: Green). Nuclei (Panel b: Blue) were stained with ProLong™ Diamond Antifade Mountant with DAPI (Product # P36962). F-actin (Panel c: Red) was stained withRhodamine Phalloidin (Product # R415, 1:300). Panel d represents the merged image showing EZH2 specific nuclear localization. Panel e represents control cells with no primary antibody to assess background. The images were captured at 60X magnification.

Supportive validation
- Submitted by
- Invitrogen Antibodies (provider)
- Main image
- Experimental details
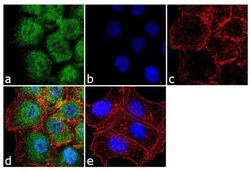
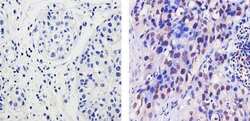
- Immunohistochemistry analysis of EZH2 showing staining in the nucleus and weak staining in the cytoplasm of paraffin-embedded human breast carcinoma (right) compared to a negative control without primary antibody (left). To expose target proteins, antigen retrieval was performed using 10mM sodium citrate (pH 6.0), microwaved for 8-15 min. Following antigen retrieval, tissues were blocked in 3% H2O2-methanol for 15 min at room temperature, washed with ddH2O and PBS, and then probed with a EZH2 Rabbit Polyclonal Antibody (Product # 36-6300) diluted in 3% BSA-PBS at a dilution of 1:20 for 1 hour at 37ºC in a humidified chamber. Tissues were washed extensively in PBST and detection was performed using an HRP-conjugated secondary antibody followed by colorimetric detection using a DAB kit. Tissues were counterstained with hematoxylin and dehydrated with ethanol and xylene to prep for mounting.
- Submitted by
- Invitrogen Antibodies (provider)
- Main image
- Experimental details
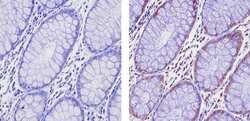
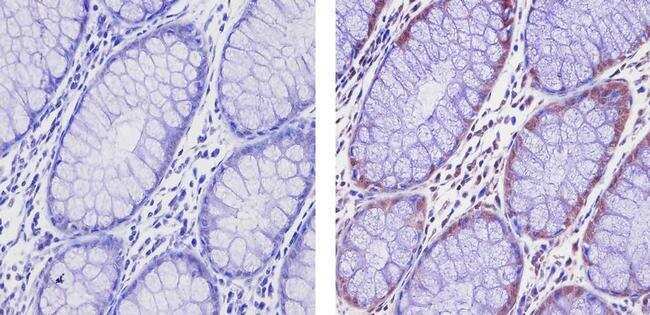
- Immunohistochemistry analysis of EZH2 showing staining in the nucleus and weak staining in the cytoplasm of paraffin-embedded human colon carcinoma (right) compared to a negative control without primary antibody (left). To expose target proteins, antigen retrieval was performed using 10mM sodium citrate (pH 6.0), microwaved for 8-15 min. Following antigen retrieval, tissues were blocked in 3% H2O2-methanol for 15 min at room temperature, washed with ddH2O and PBS, and then probed with a EZH2 Rabbit Polyclonal Antibody (Product # 36-6300) diluted in 3% BSA-PBS at a dilution of 1:20 for 1 hour at 37ºC in a humidified chamber. Tissues were washed extensively in PBST and detection was performed using an HRP-conjugated secondary antibody followed by colorimetric detection using a DAB kit. Tissues were counterstained with hematoxylin and dehydrated with ethanol and xylene to prep for mounting.
- Submitted by
- Invitrogen Antibodies (provider)
- Main image
- Experimental details
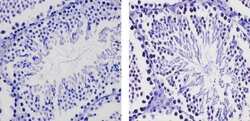
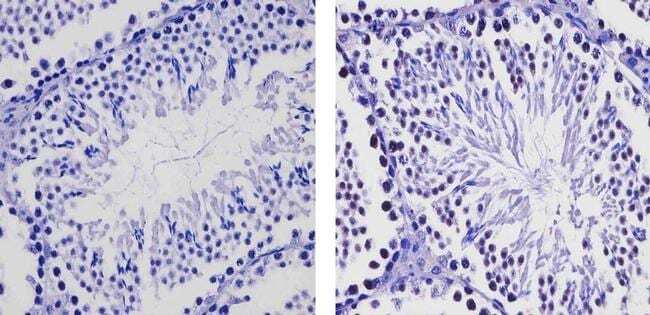
- Immunohistochemistry analysis of EZH2 showing staining in the nucleus of paraffin-embedded mouse testis tissue (right) compared to a negative control without primary antibody (left). To expose target proteins, antigen retrieval was performed using 10mM sodium citrate (pH 6.0), microwaved for 8-15 min. Following antigen retrieval, tissues were blocked in 3% H2O2-methanol for 15 min at room temperature, washed with ddH2O and PBS, and then probed with a EZH2 Rabbit Polyclonal Antibody (Product # 36-6300) diluted in 3% BSA-PBS at a dilution of 1:20 for 1 hour at 37ºC in a humidified chamber. Tissues were washed extensively in PBST and detection was performed using an HRP-conjugated secondary antibody followed by colorimetric detection using a DAB kit. Tissues were counterstained with hematoxylin and dehydrated with ethanol and xylene to prep for mounting.
Supportive validation
- Submitted by
- Invitrogen Antibodies (provider)
- Main image
- Experimental details
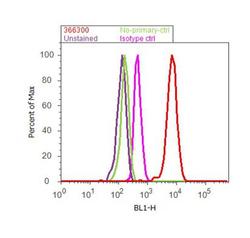
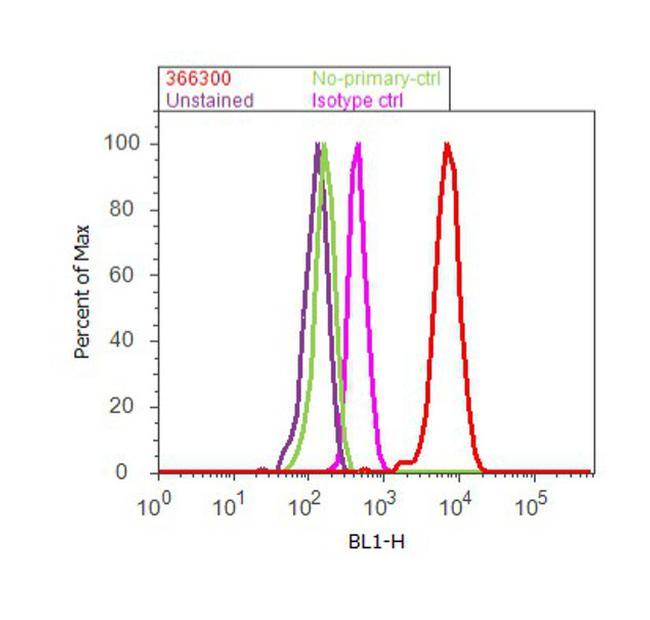
- Flow cytometry analysis of EZH2 was done on HCT 116 cells. Cells were fixed with 70% ethanol for 10 minutes, permeabilized with 0.25% Triton™ X-100 for 20 minutes, and blocked with 5% BSA for 30 minutes at room temperature. Cells were labeled with EZH2 Rabbit Polyclonal Antibody (366300, red histogram) or with rabbit isotype control (pink histogram) at 3-5 ug/million cells in 2.5% BSA. After incubation at room temperature for 2 hours, the cells were labeled with Alexa Fluor® 488 Goat Anti-Rabbit Secondary Antibody (A11008) at a dilution of 1:400 for 30 minutes at room temperature. The representative 10,000 cells were acquired and analyzed for each sample using an Attune® Acoustic Focusing Cytometer. The purple histogram represents unstained control cells and the green histogram represents no-primary-antibody control.
Supportive validation
- Submitted by
- Invitrogen Antibodies (provider)
- Main image
- Experimental details
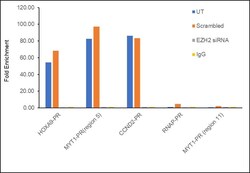
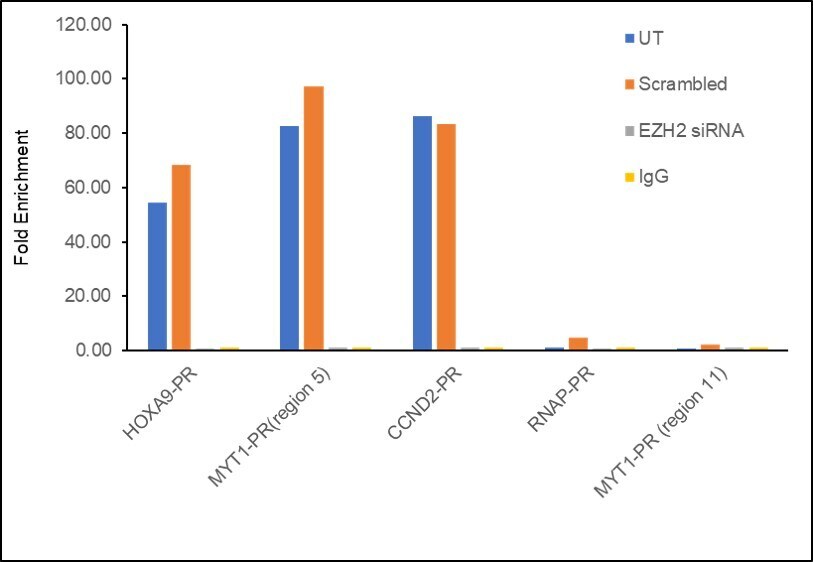
- Chromatin Immunoprecipitation (ChIP) assay of endogenous EZH2 protein using EZH2 Polyclonal Antibody: ChIP was performed using EZH2 Polyclonal Antibody (Product # 36-6300, 5 µg) on sheared chromatin from HeLa cells using the MAGnify ChIP System kit (Product # 49-2024). Normal Rabbit IgG was used as a negative IP control. The purified DNA was analyzed by qPCR using primers binding to HOXA9-PR, MYT1-PR (Region5), CCND2-PR as active binding regions and RNAP-PR and MYT1-PR (Region 11) as inactive binding regions. Data is presented as fold enrichment of the antibody signal versus the negative control IgG using the comparative CT method. PR: Promoter, Region 5: -1200 to -800 bp region of MYT1 promoter, Region 11: +1200 to +1600 bp region of MYT1 promoter.

- Submitted by
- Invitrogen Antibodies (provider)
- Main image

- Experimental details
- Chromatin Immunoprecipitation (ChIP) assay of endogenous EZH2 protein using EZH2 Polyclonal Antibody: ChIP was performed using EZH2 Polyclonal Antibody (Product # 36-6300, 5 µg) on sheared chromatin from HeLa cells using the MAGnify ChIP System kit (Product # 49-2024). Normal Rabbit IgG was used as a negative IP control. The purified DNA was analyzed by qPCR using primers binding to HOXA9-PR, MYT1-PR (Region5), CCND2-PR as active binding regions and RNAP-PR and MYT1-PR (Region 11) as inactive binding regions. Data is presented as fold enrichment of the antibody signal versus the negative control IgG using the comparative CT method. PR: Promoter, Region 5: -1200 to -800 bp region of MYT1 promoter, Region 11: +1200 to +1600 bp region of MYT1 promoter.
Supportive validation
- Submitted by
- Invitrogen Antibodies (provider)
- Main image
- Experimental details
- NULL
- Submitted by
- Invitrogen Antibodies (provider)
- Main image

- Experimental details
- NULL
- Submitted by
- Invitrogen Antibodies (provider)
- Main image
- Experimental details
- NULL
- Submitted by
- Invitrogen Antibodies (provider)
- Main image
- Experimental details
- NULL
- Submitted by
- Invitrogen Antibodies (provider)
- Main image
- Experimental details
- NULL
- Submitted by
- Invitrogen Antibodies (provider)
- Main image
- Experimental details
- NULL
- Submitted by
- Invitrogen Antibodies (provider)
- Main image
- Experimental details
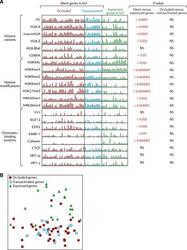
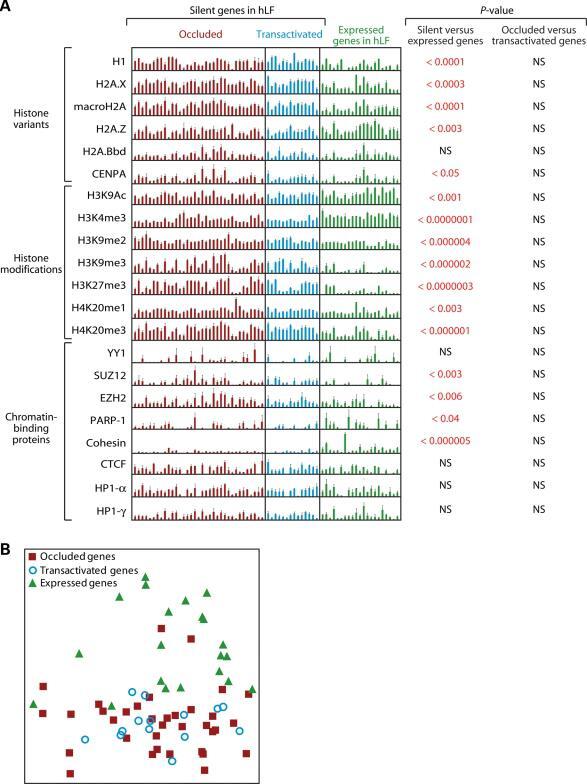
- Figure 3. ChIP analysis of 20 chromatin marks in hLF. Genes targeted by the analysis can be divided into silent and expressed categories, with the silent category further divided into occluded and transactivated groups. ( A ) PCR quantitation of ChIP for individual genes. Each bar represents a region interrogated by a PCR amplicon. The height of each bar represents fold-enrichment, relative to input, of each gene. P -values are calculated from these data using the t -test and indicate the statistical significance that two groups of genes are distinct for the chromatin mark surveyed. Error bars are based on multiple replicates of the experiment. NS, not significant; hLF, human lung fibroblasts. ( B ) Principal component analysis of ChIP data across the 20 chromatin marks.
- Submitted by
- Invitrogen Antibodies (provider)
- Main image
- Experimental details
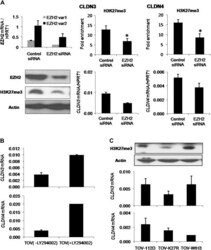
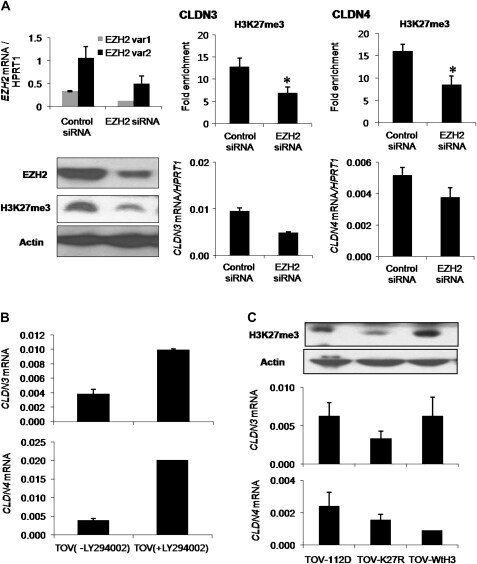
- Fig. 4. Effect of the loss of H3K27me3 on CLDN3 and CLDN4 expression in ovarian cancer cells. ( A ) Effect of EZH2 knockdown by EZH2 siRNA on CLDN3 and CLDN4 expression. Knockdown of EZH2 transcripts ( EZH2 var1 and EZH2 var2) and the decrease in protein levels of H3K27me3 were assessed in TOV-112D cells 72 h after siRNA treatment (100 nM). The effect of EZH2 knockdown on H3K27me3 enrichment in the CLDN3 and CLDN4 promoters was also evaluated by quantitative ChIP in TOV-112D cells. * P < 0.05, Mann-Whitney test. CLDN3 and CLDN4 messenger RNA (mRNA) levels after EZH2 siRNA treatment were compared with the levels after control siRNA treatment. ( B ) Effect of LY294002 on CLDN3 and CLDN4 expression. CLDN3 and CLDN4 expression levels were determined by quantitative real-time reverse transcription-PCR (qRT-PCR) in TOV-112D cells after a 24 h treatment with 20 muM LY294002. ( C ) CLDN3 and CLDN4 expression in TOV-K27R cells. The level of H3K27me3 in TOV-112D, TOV-K27R and TOV-WtH3 cells was assessed by western blotting and the mRNA levels of CLDN3 and CLDN4 were assessed by qRT-PCR.
- Submitted by
- Invitrogen Antibodies (provider)
- Main image
- Experimental details
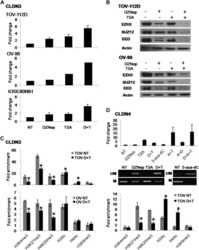
- Fig. 5. Effects of DZNep, 5-aza-dC and TSA treatment on CLDN3 and CLDN4 expression and epigenetic modifications in ovarian cell lines. ( A ) Changes in CLDN3 expression in ovarian cells treated with 5 muM DZNep (D), 200 nM TSA (T) or combination of DZNep/TSA. CLDN3 induction by quantitative real-time reverse transcription-PCR is represented as the fold change ( y -axis), calculated relative to no treatment (NT). ( B ) Effect of pharmacological treatments on Polycomb repressive complex-2 (EZH2, EED and SUZ12) protein levels. ( C ) ChIP analysis of the CLDN3 promoter in TOV-112D and OV-90 cells untreated or treated with DZNep/TSA. Fold enrichment was measured by quantitative ChIP. * P < 0.05. ( D ) Effect of DZNep, 5-aza-dC and/or TSA on the expression, methylation status and histone modifications of CLDN4 in TOV-112D cells. Changes in CLDN4 expression (top), DNA methylation (middle) and histone modifications (bottom) after DZNep, TSA, 5-aza-dC (A, 5muM) or their combined treatments are represented, respectively. * P < 0.05.

- Submitted by
- Invitrogen Antibodies (provider)
- Main image
- Experimental details
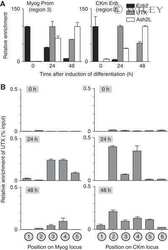
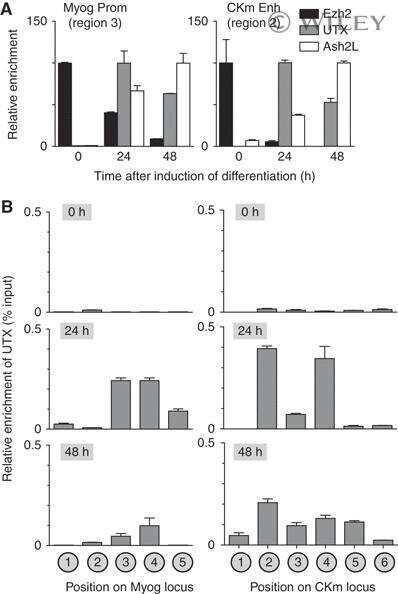
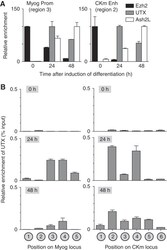
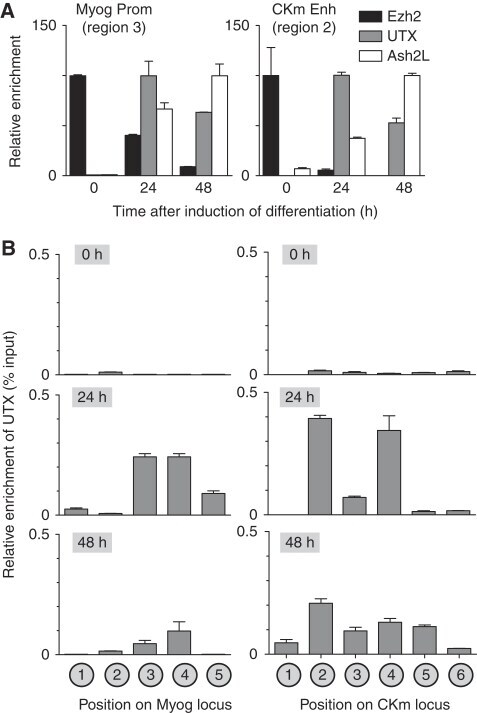
- Figure 2 UTX becomes associated with the Myogenin and CKm loci during C2C12 myogenesis. ( A ) Cross-linked chromatin from C2C12 cells (growing (0 h) or differentiated (24 or 48 h)) was subject to ChIP analysis using antibodies directed against UTX, Ezh2, or Ash2L. Immunopurified DNA was quantitated by qPCR using probes that recognize either the Myog promoter (left panel) or the distal enhancer of the CKm gene (right panel). To account for variability in IP efficiency of the three different antibodies, relative enrichment is plotted as a percentage of the maximal enrichment value observed for each factor individually during the 48 h time course after first calculating the absolute enrichment as a percentage of input chromatin. ( B ) X-ChIP analysis of the temporal (0, 24, and 48 h) changes in UTX enrichment across the Myog and CKm genes. Chromatin isolated from C2C12 cells at various stages of differentiation was subjected to immunopurification using an anti-UTX antibody. After deproteination, immunopurified DNA was quantitated by qPCR using probes that recognize the different regions indicated in the schematic in Figure 1A .
- Submitted by
- Invitrogen Antibodies (provider)
- Main image

- Experimental details
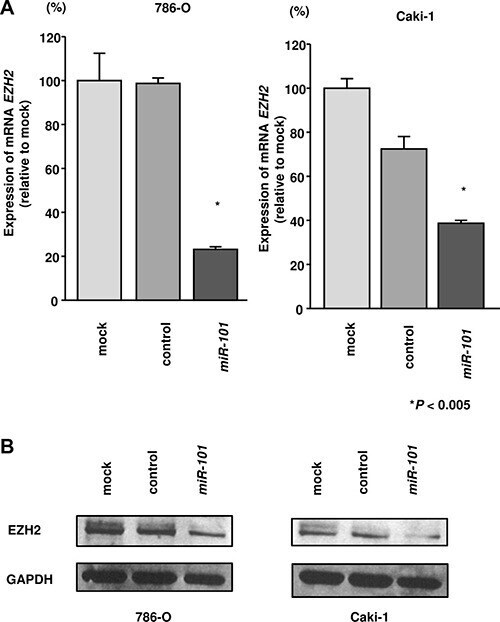
- Figure 4 Effects of miR-101 transfection on EZH2 mRNA and protein expression in RCC cells ( A ) EZH2 mRNA expression was determined at 72 h after transfection with miR-101 . GUSB was used as an internal control. ( B ) EZH2 protein expression was evaluated by western blotting at 72 h after transfection with miR-101 . GAPDH was used as a loading control. * P < 0.005. The bars indicate SDs.
- Submitted by
- Invitrogen Antibodies (provider)
- Main image
- Experimental details
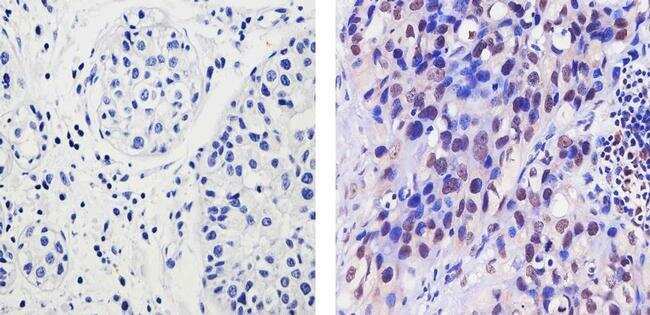
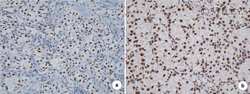
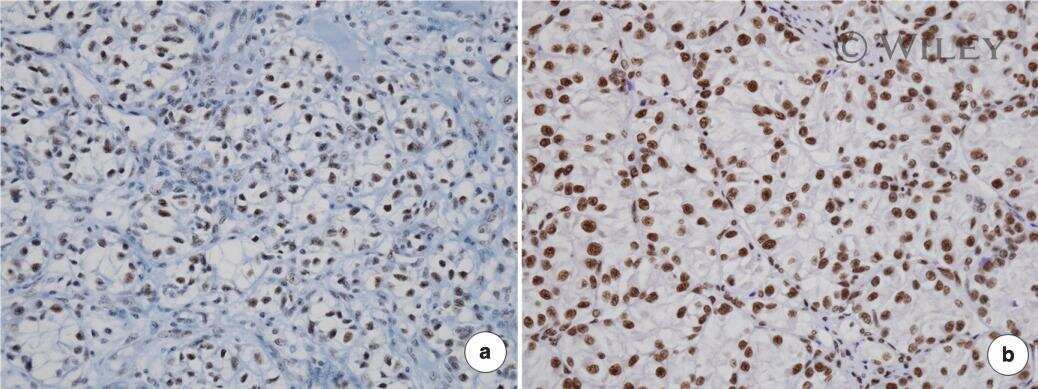
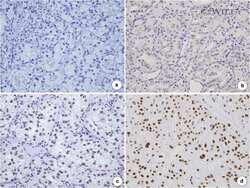
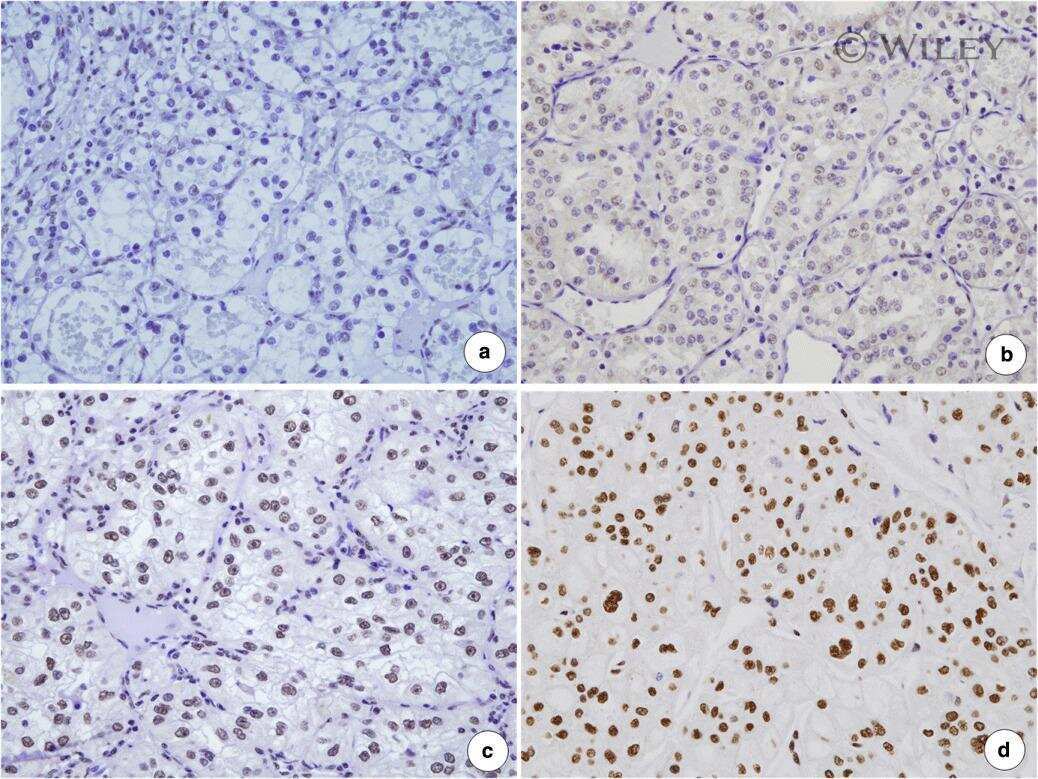
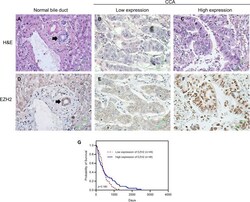
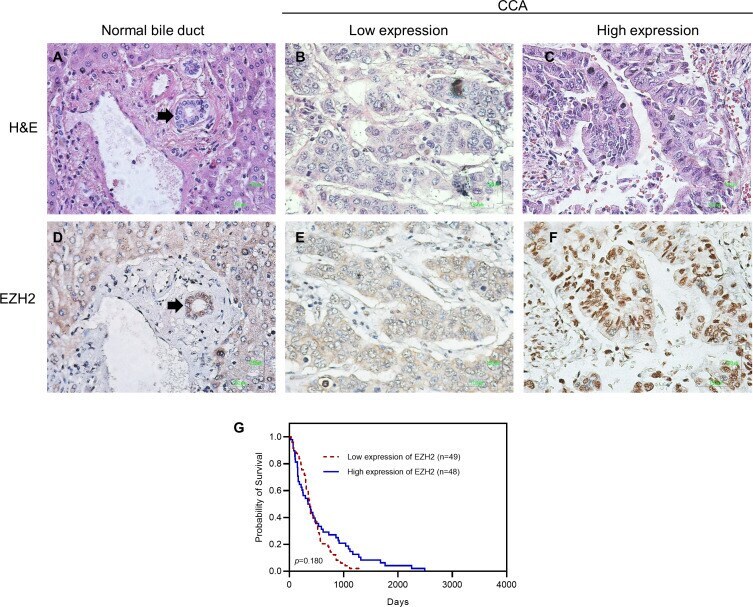
- Figure 3 Representative images showing immunohistochemical staining for EZH2 in CCA. (A-C) Photomicrographs of representative hematoxylin and eosin (H&E) in normal bile duct (black arrow) and CCA. (D-F) Photomicrographs of representative EZH2 expression in nuclei of normal bile duct (black arrow) and CCA (Original magnification = 400x). (G) Kaplan-Meier curves indicating survival rate of CCA patients with low and high EZH2 expression. H&E, hematoxylin and eosin.
- Submitted by
- Invitrogen Antibodies (provider)
- Main image
- Experimental details
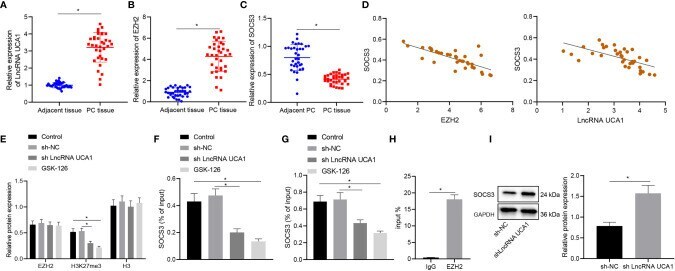
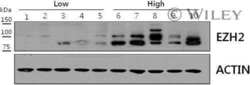
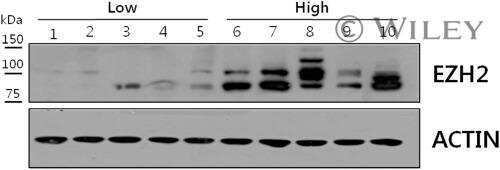
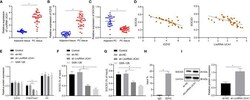
- Figure 4 LncRNA UCA1 inhibits SOCS3 expression by recruiting EZH2 to the promoter of SOCS3 in PANC-1 cells. (A) , LncRNA UCA1 expression in pancreatic cancer tissues (n = 35) and adjacent normal tissues (n = 35) was detected by qRT-PCR. (B) , EZH2 expression in pancreatic cancer tissues (n = 35) and adjacent normal tissues (n = 35) was detected by qRT-PCR. (C) , SOCS3 expression in pancreatic cancer tissues (n = 35) and adjacent normal tissues (n = 35) was detected by qRT-PCR. (D) , Pearson's correlation analysis between EZH2 and SOCS3 expression, SOCS3 and lncRNA UCA1 expression in pancreatic cancer tissues. (E) , Expression specificity of H3K27me3 in PANC-1 cells was detected by Western blot. (F) , Binding of EZH2 with SOCS3 promoter analyzed by ChIP. (G) , Binding of H3K27me3 with SOCS3 promoter was analyzed by ChIP. (H) , Specific binding of lncRNA UCA1 to EZH2 in PANC-1 cells was analyzed by RIP. (I) , Expression of SOCS3 in sh-lncRNA UCA1-treated PANC-1 cells was detected by Western blot. * p < 0.05. Measurement data were expressed as mean +- standard deviation. Paired t test was used for comparison between cancer tissues and adjacent normal tissues. The data between two groups were compared using the independent sample t test. The data comparison among multiple groups was performed using one-way ANOVA, followed by the Tukey's post hoc test. Pearson's correlation coefficient was used for correlation analysis. The cell experiment was repeated three times independently.