 Explore
 Validate
 Learn
Learn Western blot
 ELISA
ELISAAntibody data
- Antibody Data
- Antigen structure
- References [1]
- Comments [0]
- Validations
- Western blot [2]
- Other assay [1]
Submit
Validation data
Reference
Comment
Report error
- Product number
- MA1-82452 - Provider product page

- Provider
- Invitrogen Antibodies
- Product name
- Thioredoxin 1 Monoclonal Antibody (2B1)
- Antibody type
- Monoclonal
- Antigen
- Recombinant full-length protein
- Description
- Mouse anti Human thioredoxin antibody, clone 2B1 recognizes human thioredoxin, also known as ATL-derived factor or Surface-associated sulphydryl protein.
- Reactivity
- Human
- Host
- Mouse
- Isotype
- IgG
- Antibody clone number
- 2B1
- Vial size
- 200 µg
- Concentration
- 1 mg/mL
- Storage
- 4°C or -20°C if preferred
Submitted references Ehrlichia chaffeensis EplA Interaction With Host Cell Protein Disulfide Isomerase Promotes Infection.
Green RS, Izac JR, Naimi WA, O'Bier N, Breitschwerdt EB, Marconi RT, Carlyon JA
Frontiers in cellular and infection microbiology 2020;10:500
Frontiers in cellular and infection microbiology 2020;10:500
No comments: Submit comment
Supportive validation
- Submitted by
- Invitrogen Antibodies (provider)
- Main image

- Experimental details
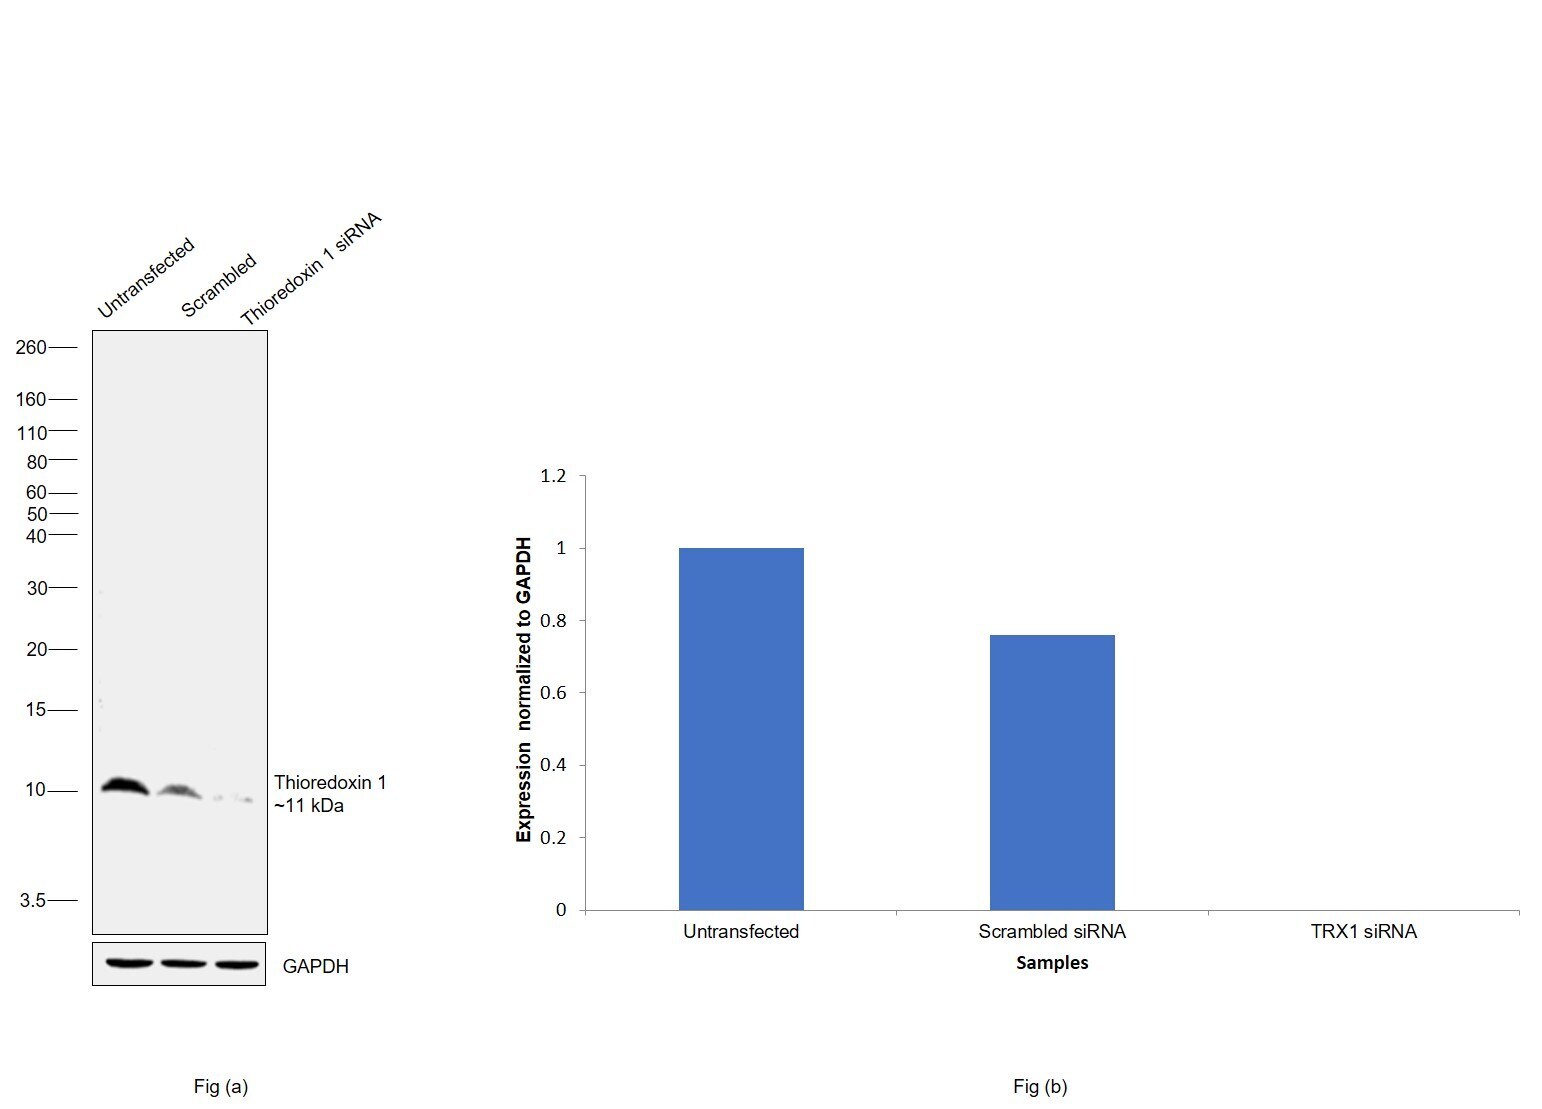
- Knockdown of Thioredoxin 1 was achieved by transfecting U-87 MG with Thioredoxin 1 specific siRNAs (Silencer® select Product # s1, s2). Western blot analysis (Fig. a) was performed using Whole cell extracts from the Thioredoxin 1 knockdown cells (lane 3), non-targeting scrambled siRNA transfected cells (lane 2) and untransfected cells (lane 1). The blot was probed with Thioredoxin 1 Monoclonal Antibody (2B1) (Product # MA1-82452, 4µg/mL ) and Goat anti-Mouse IgG (H+L) Superclonal™ Recombinant Secondary Antibody, HRP (Product # A28177, 1:4000 dilution). Densitometric analysis of this western blot is shown in histogram (Fig. b). Decrease in signal upon siRNA mediated knock down confirms that antibody is specific to Thioredoxin 1.
- Submitted by
- Invitrogen Antibodies (provider)
- Main image
- Experimental details
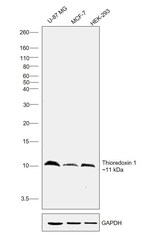
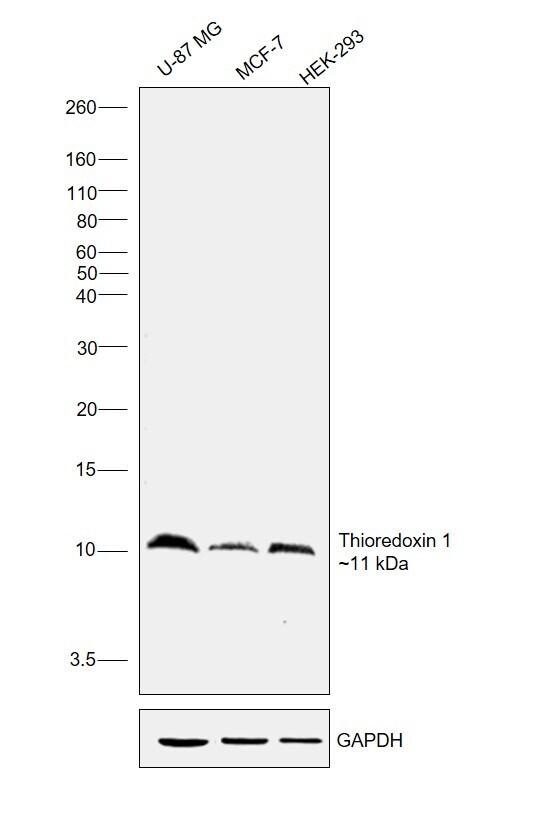
- Western blot was performed using Anti-Thioredoxin 1 Monoclonal Antibody (2B1)(Product # MA1-82452) and a 11kDa band corresponding to Thioredoxin 1 was observed across cell lines . Whole cell extracts (50 µg lysate) of U-87 MG (Lane 1), MCF7 (Lane 2) and HEK-293 (Lane 3) were electrophoresed using Novex™ 16% Tricine Protein Gel (Product # EC6695BOX). Resolved proteins were then transferred onto a Nitrocellulose membrane (Product # IB23001) by iBlot® 2 Dry Blotting System (Product # IB21001). The blot was probed with the primary antibody (4µg/mL) and detected by chemiluminescence with Goat anti-Mouse IgG (H+L) Superclonal™ Recombinant Secondary Antibody, HRP (Product # A28177, 1:4000 Dilution) using the iBright FL 1000 (Product # A32752). Chemiluminescent detection was performed using Novex® ECL Chemiluminescent Substrate Reagent Kit (Product # WP20005).
Supportive validation
- Submitted by
- Invitrogen Antibodies (provider)
- Main image
- Experimental details
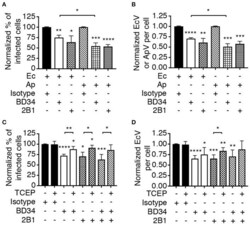
- Figure 5 Host cell surface thiol reductase activity benefits E. chaffeensis infectivity. (A,B) Antibody-mediated inhibition of PDI or Trx1 reductase activity reduces E. chaffeensis infection. THP-1 cells were incubated with E. chaffeensis organisms in the presence of PDI catalytically neutralizing antibody BD34, Trx1-specific antibody 2B1, or isotype control. As a positive control for the ability of these antibodies to inhibit infection, a parallel experiment was performed in which A. phagocytophilum bacteria were incubated with HL-60 cells in the presence of the same antibodies. At 24 h, the cells were examined by immunofluorescence microscopy for the percentages of infected cells (A) and numbers of EcVs or ApVs per cell (B) . (C,D) TCEP ifies BD34- and 2B1-mediated inhibition of E. chaffeensis infection. THP-1 cells that had been treated with BD34, 2B1, both antibodies, or isotype control were incubated with E. chaffeensis organisms in the presence or absence of TCEP for 30 min followed by PBS washing. The cells were assessed for the percentage of infected cells (C) and number of EcVs per cell (D) . All data are shown as the mean +- SD of triplicate samples and are representative of experiments performed a minimum of three times. Statistically significant values are indicated. * P < 0.05; ** P < 0.01; *** P < 0.001; **** P < 0.0001. Asterisks above columns indicate statistically significant differences in infection relative to isotype control-treated cells, while asteri
