 Explore
 Validate
 Learn
Learn Western blot
Antibody data
- Antibody Data
- Antigen structure
- References [1]
- Comments [0]
- Validations
- Western blot [6]
- Immunocytochemistry [1]
- Immunohistochemistry [1]
- Other assay [3]
Submit
Validation data
Reference
Comment
Report error
- Product number
- PA5-43141 - Provider product page

- Provider
- Invitrogen Antibodies
- Product name
- LDHB Polyclonal Antibody
- Antibody type
- Polyclonal
- Antigen
- Synthetic peptide
- Description
- Peptide sequence: MYGIENEVFL SLPCILNARG LTSVINQKLK DDEVAQLKKS ADTLWDIQKD
- Concentration
- 0.5 mg/mL
Submitted references Wnt signaling reprograms metabolism in dental pulp stem cells.
Uribe-Etxebarria V, Agliano A, Unda F, Ibarretxe G
Journal of cellular physiology 2019 Aug;234(8):13068-13082
Journal of cellular physiology 2019 Aug;234(8):13068-13082
No comments: Submit comment
Supportive validation
- Submitted by
- Invitrogen Antibodies (provider)
- Main image
- Experimental details
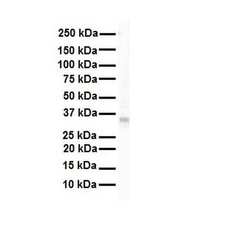
- Western blot analysis of human 721_B cells using an anti-LDHB polyclonal antibody (Product # PA5-43141).
- Submitted by
- Invitrogen Antibodies (provider)
- Main image
- Experimental details
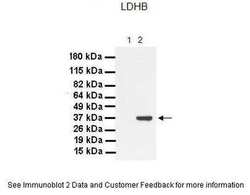
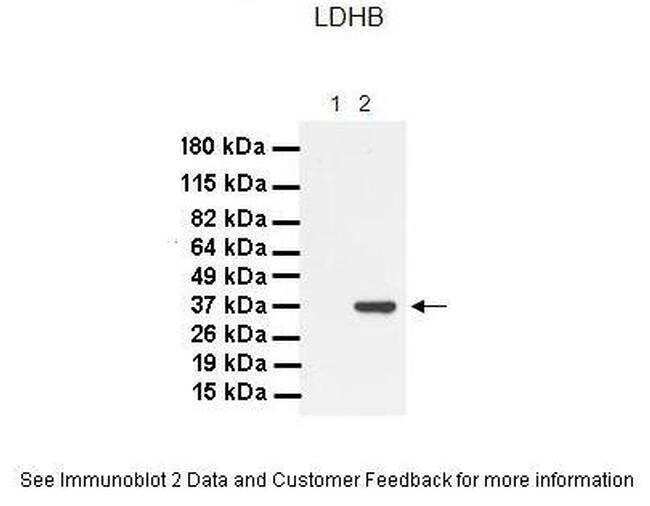
- Western blot analysis of human PANC1 cell lysate using an anti-LDHB polyclonal antibody (Product # PA5-43141). Primary Antibody Dilution: 1:1000; Secondary Antibody: Goat anti-Rabbit HRP; Secondary Antibody Dilution: 1:4000. LANE 1)30 µg MiaPaca-2 cell lysate; LANE 2) 30 µg Panc-1 cell lysate.
- Submitted by
- Invitrogen Antibodies (provider)
- Main image
- Experimental details
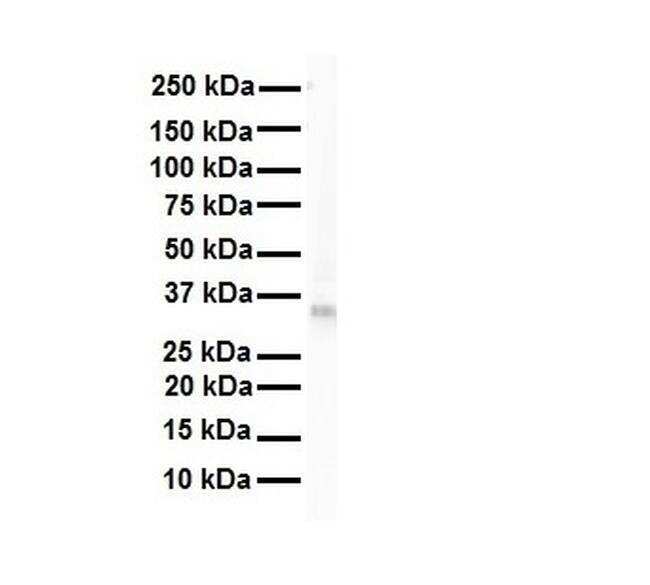
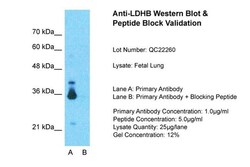
- Western blot analysis of human fetal lung cell lysate using an anti-LDHB polyclonal antibody (Product # PA5-43141). Lane 1) Primary Antibody; Lane 2) Primary Antibody + Blocking Peptide.

- Submitted by
- Invitrogen Antibodies (provider)
- Main image
- Experimental details
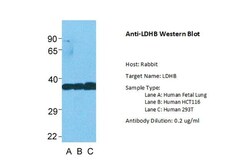
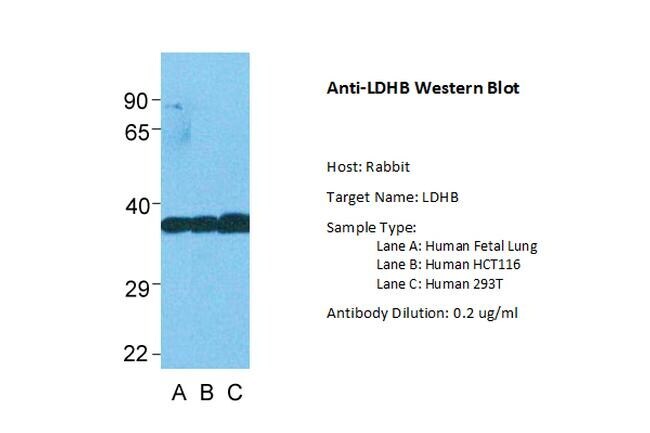
- Western blot analysis of human fetal lung, HCT116, 293T cells using an anti-LDHB polyclonal antibody (Product # PA5-43141). LANE 1) Human Fetal Lung; LANE 2) Human HCT116; LANE 3) Human 293T.
- Submitted by
- Invitrogen Antibodies (provider)
- Main image

- Experimental details
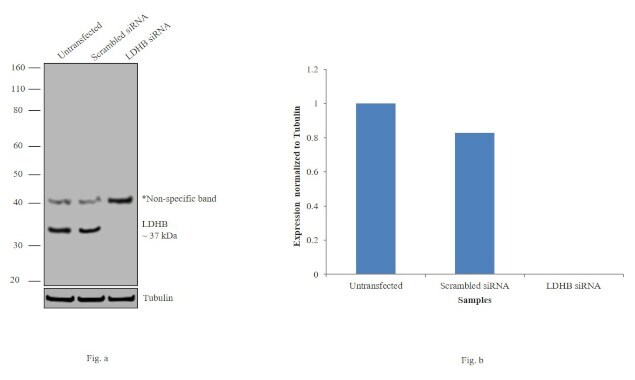
- Knockdown of LDHB was achieved by transfecting HeLa cells with LDHB specific siRNAs (Silencer® select Product # s8126, s8125). Western blot analysis (Fig. a) was performed using membrane extracts from the LDHB knockdown cells (lane 3), non-specific scrambled siRNA transfected cells (lane 2) and untransfected cells (lane 1). The blots were probed with LDHB Polyclonal Antibody (Product # PA5-43141, 1:1000 dilution) and Goat anti-Rabbit IgG (H+L) Superclonal™ Secondary Antibody, HRP conjugate (Product # A27036, 0.25 µg/mL, 1:4000 dilution). Densitometric analysis of this western blot is shown in histogram (Fig. b). Decrease in signal upon siRNA mediated knock down confirms that antibody is specific to LDHB. An uncharacterized band was observed around ~40KDa.
- Submitted by
- Invitrogen Antibodies (provider)
- Main image
- Experimental details
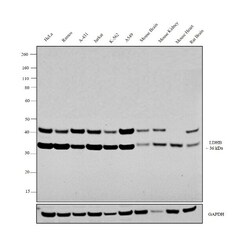
- Western blot analysis was performed on whole cell extracts (30 µg lysate) of HeLa (Lane 1), Ramos (Lane 2), A-431 (Lane 3), Jurkat (Lane 4), K-562 (Lane 5), A549 (Lane 6), tissue extracts of Mouse Brain (Lane 7), Mouse Kidney (Lane 8), Mouse Heart (Lane 9) and Rat Brain (Lane 10). The blot was probed with Anti-LDHB Polyclonal Antibody (Product # PA5-43141, 1:1000 dilution) and detected by chemiluminescence using Goat anti-Rabbit IgG (H+L) Superclonal™ Secondary Antibody, HRP conjugate (Product # A27036, 0.25 µg/mL, 1:4000 dilution). A 36 kDa band corresponding to LDHB was observed across the cell lines and tissue extracts tested. An uncharacterized band at ~42 kDa was also observed in all the samples tested.

Supportive validation
- Submitted by
- Invitrogen Antibodies (provider)
- Main image
- Experimental details
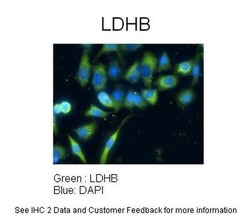
- Immunocytochemistry analysis of human lung adenocarcinoma cell line A549 using an anti-LDHB polyclonal antibody (Product # PA5-43141). Primary antibody dilution: 1:100, Secondary antibody: Goat anti-rabbit AlexaFluor 488, Secondary antibody dilution: 1:400.

Supportive validation
- Submitted by
- Invitrogen Antibodies (provider)
- Main image

- Experimental details
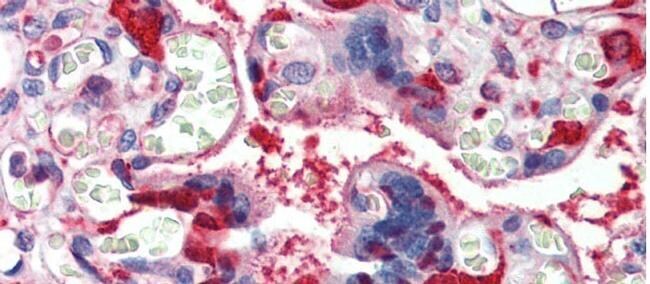
- Immunohistochemistry (paraffin-embedded) analysis of human placenta tissue using an anti-LDHB polyclonal antibody (Product # PA5-43141).
Supportive validation
- Submitted by
- Invitrogen Antibodies (provider)
- Main image

- Experimental details
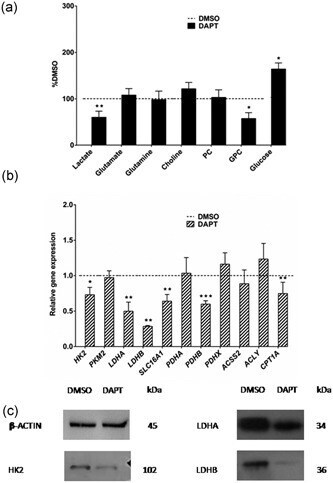
- Figure 1 Notch inhibition by DAPT affects glycolytic metabolism in DPSCs. (a) NMR analysis revealed differences in the levels of lactate, GPC, and glucose following DAPT exposure. (b) Q-PCR analysis confirmed a decrease in HK2, LDHA, LDHB, SLG16A1 , PDHB , and CPT1A expression between control (DMSO) and DAPT conditions. Data are normalized to reference beta-ACTIN and GAPDH levels and presented as the mean + SEM ( n = 6). The dashed line represents normalized gene expression to control conditions. (c) Representative WB showing LDHA, LDHB, and HK2. beta-ACTIN was used as protein loading control. * p < 0.05; ** p < 0.01; *** p < 0.001. U-Mann Whitney test. DAPT, N-[N-(3,5-difluorophenacetyl)-L-alanyl]-S-phenylglycine t-butyl ester; DMSO, dimethylsulfoxide; DPSCs, dental pulp stem cells; GPC, glycerophosphocoline; NMR, nuclear magnetic resonance; q-PCR, quantitative polymerase chain reaction
- Submitted by
- Invitrogen Antibodies (provider)
- Main image
- Experimental details
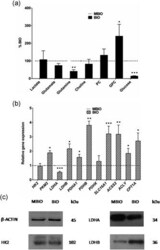
- Figure 2 Wnt activation by BIO increases glucose utilization and the expression of enzymes involved in mitochondrial TCA metabolism and lipid biosynthesis in DPSCs. (a) NMR analysis revealed differences in the levels of lactate, glutamine, GPC, and glucose following BIO exposure. (b) Q-PCR analysis confirmed an increase in PKM2, LDHB, PDHA, PDHB, SLG16A, ACSS2, ACLY , and CPT1A expression between control (MBIO) and BIO conditions. Data are normalized to reference beta-ACTIN and GAPDH levels, and presented as the mean + SEM ( n = 6). The dashed line represents normalized gene expression to control conditions. (c) Representative WB showing an increase in LDHB, and a decrease in LDHA protein levels. No changes were observed HK2 protein expression. beta-ACTIN was used as a protein loading control. * p < 0.05; ** p < 0.01; *** p < 0.001. U-Mann Whitney test. BIO, 6-bromoindirubin-3'-oxine; DPSCs, dental pulp stem cells; GPC, glycerophosphocoline; NMR, nuclear magnetic resonance; q-PCR, quantitative polymerase chain reaction; TCA, tricarboxylic acid cycle

- Submitted by
- Invitrogen Antibodies (provider)
- Main image
- Experimental details
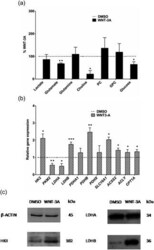
- Figure 3 Wnt activation by WNT-3A increases glucose utilization, and the expression of enzymes involved in TCA metabolism and lipid biosynthesis in DPSCs. (a) NMR analysis revealed differences in the levels of glutamate, choline, and glucose following WNT-3A exposure. (b) Q-PCR showing relative differences on expression of HK2, PKM2, LDHA, LDHB, PDHB, SLC16A1, ACSS2, ACLY , and CPT1 . Data are normalized to reference beta-ACTIN and GAPDH levels and represented as the mean + SEM ( n = 6). The dashed line represents normalized gene expression to control conditions. (c) Representative WB showing an increase in LDHB and HK2 protein expression. beta-ACTIN was used as a protein loading control. * p < 0.05; ** p < 0.01; *** p < 0.001. U-Mann Whitney test. DMSO, dimethylsulfoxide; DPSCs, dental pulp stem cells; NMR, nuclear magnetic resonance; q-PCR, quantitative polymerase chain reaction; TCA, tricarboxylic acid cycle
