 Explore
 Validate
 Learn
Learn Western blot
Antibody data
- Antibody Data
- Antigen structure
- References [2]
- Comments [0]
- Validations
- Western blot [2]
- Other assay [1]
Submit
Validation data
Reference
Comment
Report error
- Product number
- PA5-37012 - Provider product page

- Provider
- Invitrogen Antibodies
- Product name
- PEX3 Polyclonal Antibody
- Antibody type
- Polyclonal
- Antigen
- Synthetic peptide
- Description
- This antibody detects endogenous protein at a molecular weight of 42 kDa. Purity is >95% by SDS-PAGE.
- Reactivity
- Human, Mouse, Rat
- Host
- Rabbit
- Isotype
- IgG
- Vial size
- 100 μL
- Concentration
- 1 mg/mL
- Storage
- Store at 4°C short term. For long term storage, store at -20°C, avoiding freeze/thaw cycles.
Submitted references MFN2 Deficiency Impairs Mitochondrial Functions and PPAR Pathway During Spermatogenesis and Meiosis in Mice.
Lysosomal exocytosis releases pathogenic α-synuclein species from neurons in synucleinopathy models.
Wang T, Xiao Y, Hu Z, Gu J, Hua R, Hai Z, Chen X, Zhang JV, Yu Z, Wu T, Yeung WSB, Liu K, Guo C
Frontiers in cell and developmental biology 2022;10:862506
Frontiers in cell and developmental biology 2022;10:862506
Lysosomal exocytosis releases pathogenic α-synuclein species from neurons in synucleinopathy models.
Xie YX, Naseri NN, Fels J, Kharel P, Na Y, Lane D, Burré J, Sharma M
Nature communications 2022 Aug 22;13(1):4918
Nature communications 2022 Aug 22;13(1):4918
No comments: Submit comment
Supportive validation
- Submitted by
- Invitrogen Antibodies (provider)
- Main image

- Experimental details
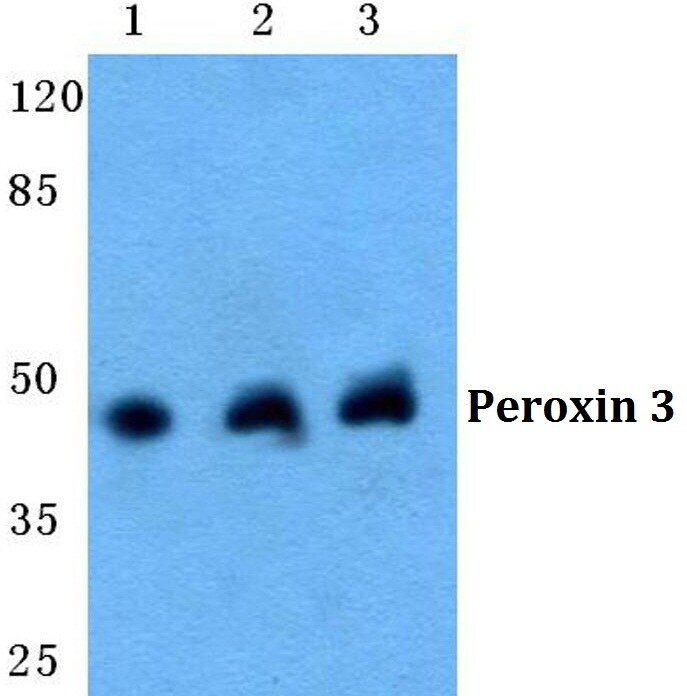
- Western blot analysis of Peroxin 3 using Peroxin 3 polyclonal antibody (Product # PA5-37012) at a dilution of 1:500. Lane 1: HEK293T cell lysate, Lane 2: NIH-3T3 cell lysate, Lane 3: H9C2 cell lysate.

- Submitted by
- Invitrogen Antibodies (provider)
- Main image

- Experimental details
- Western blot analysis of PEX3 in Lane 1: HEK293T cell lysate, Lane 2: NIH-3T3 cell lysate, Lane 3: H9C2 cell lysate. Samples were incubated with PEX3 polyclonal antibody (Product # PA5-37012) at a dilution of 1:500.
Supportive validation
- Submitted by
- Invitrogen Antibodies (provider)
- Main image
- Experimental details
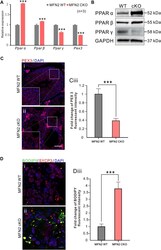
- FIGURE 6 PPAR signaling were significantly altered in MFN2 deficient spermatocytes. (A) mRNA expression levels of Pparalpha , Pparbeta , Ppargamma and Pex3 were measured in MFN2 WT and MFN2 cKO spermatocytes via RT-qPCR. The data represent mean +- SEM and the cKO values were normalized to the WT controls. This data was quantified from n = 3 independent experiments. ***: p < 0.001. (B) The PPAR family protein expression levels were analyzed via western blot analysis using isolated spermatocytes. GAPDH was used as the loading control. (Ci-Cii) Testes sections were labeled with the anti-PEX3 antibody (in red) and co-labeled with DAPI (in blue) to label peroxisomes and cell nuclei, respectively. Scale bar is 50 mum. (Ciii) Bar chart to show the quantification of PEX 3 signal fluorescent intensity in MFN2 WT and cKO testes. (Di-Dii) Testis cells were immunolabeled with the anti-SYCP3 antibody to label spermatocytes (in red) and then co-labeled with BODIPY (in green) and DAPI (in blue) to label neutral lipid droplets and the cell nuclei, respectively. Scale bar is 10 mum. (Diii) Bar chart to show the quantification of BODIPY fluorescent intensity in MFN2 WT and cKO testicle cells. (Ciii and Diii) these data represent the mean +- SEM and the Students' t -test was applied to analyze the data between each two groups, such that ***: p < 0.001.
