Explore
 Validate
 Learn
Learn Western blot
 Immunocytochemistry
Antibody data
- Antibody Data
- Antigen structure
- References [1]
- Comments [0]
- Validations
- Immunocytochemistry [5]
- Immunoprecipitation [1]
- Immunohistochemistry [2]
- Other assay [2]
Submit
Validation data
Reference
Comment
Report error
- Product number
- PA5-22015 - Provider product page

- Provider
- Invitrogen Antibodies
- Product name
- MST1 (STK4) Polyclonal Antibody
- Antibody type
- Polyclonal
- Antigen
- Synthetic peptide
- Description
- Recommended positive controls: HepG2, mouse brain. Predicted reactivity: Mouse (100%), Rat (100%), Chicken (100%), Rhesus Monkey (100%), Chimpanzee (100%), Bovine (100%). Store product as a concentrated solution. Centrifuge briefly prior to opening the vial.
- Reactivity
- Human
- Host
- Rabbit
- Isotype
- IgG
- Vial size
- 100 μL
- Concentration
- 1 mg/mL
- Storage
- Store at 4°C short term. For long term storage, store at -20°C, avoiding freeze/thaw cycles.
Submitted references Neural stem cell-derived exosomes suppress neuronal cell apoptosis by activating autophagy via miR-374-5p/STK-4 axis in spinal cord injury.
Zhang L, Han P
Journal of musculoskeletal & neuronal interactions 2022 Sep 1;22(3):411-421
Journal of musculoskeletal & neuronal interactions 2022 Sep 1;22(3):411-421
No comments: Submit comment
Supportive validation
- Submitted by
- Invitrogen Antibodies (provider)
- Main image
- Experimental details
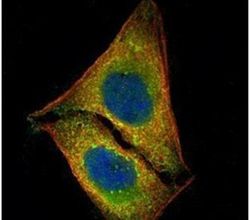
- Immunofluorescent analysis of MST1 in paraformaldehyde-fixed U2OS cells using a MST1 polyclonal antibody (Product # PA5-22015) (Green) at a 1:500 dilution. Alpha-tubulin filaments were labeled with Product # PA5-29281 (Red) at a 1:2000.

- Submitted by
- Invitrogen Antibodies (provider)
- Main image
- Experimental details
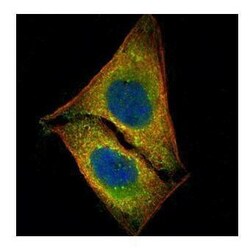
- Confocal immunofluorescence analysis (Olympus FV10i) of paraformaldehyde-fixed U2OS, using STK4 antibody (Product # PA5-22015) (Green) at 1:500 dilution. Alpha-tubulin filaments were labeled with (Product # MA1-25054) (Red) at 1:2,000.

- Submitted by
- Invitrogen Antibodies (provider)
- Main image

- Experimental details
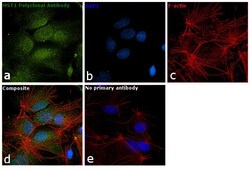
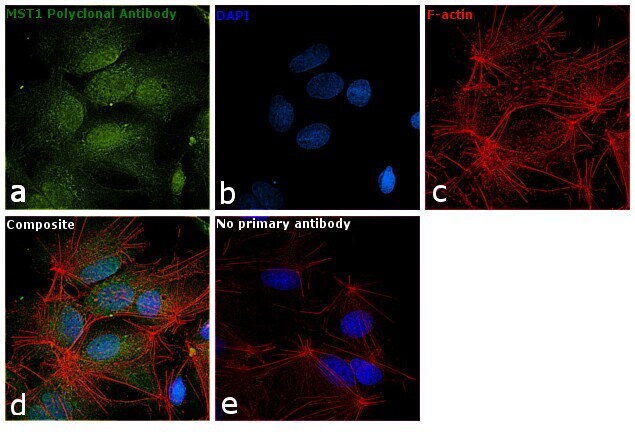
- Immunofluorescence analysis of MST1 was performed using 70% confluent log phase Hep G2 cells. The cells were fixed with 4% paraformaldehyde for 10 minutes, permeabilized with 0.1% Triton™ X-100 for 15 minutes, and blocked with 1% BSA for 1 hour at room temperature. The cells were labeled with MST1 Polyclonal Antibody (Product # PA5-22015) at 1:100 dilution in 0.1% BSA, incubated at 4 degree Celsius overnight and then labeled with Goat anti-Rabbit IgG (H+L) Superclonal™ Secondary Antibody, Alexa Fluor® 488 conjugate (Product # A27034) for 45 minutes at room temperature (Panel a: green). Nuclei (Panel b: blue) were stained with ProLong™ Diamond Antifade Mountant with DAPI (Product # P36962). F-actin (Panel c: red) was stained with Rhodamine Phalloidin (Product # R415, 1:300). Panel d represents the merged image showing nucleus and cytoplasmic localization. Panel e represents control cells with no primary antibody to assess background. The images were captured at 60X magnification.

- Submitted by
- Invitrogen Antibodies (provider)
- Main image

- Experimental details
- Confocal immunofluorescence analysis (Olympus FV10i) of paraformaldehyde-fixed U2OS, using STK4 antibody (Product # PA5-22015) (Green) at 1:500 dilution. Alpha-tubulin filaments were labeled with (Product # MA1-25054) (Red) at 1:2,000.

- Submitted by
- Invitrogen Antibodies (provider)
- Main image
- Experimental details
- Immunofluorescence analysis of MST1 was performed using 70% confluent log phase Hep G2 cells. The cells were fixed with 4% paraformaldehyde for 10 minutes, permeabilized with 0.1% Triton™ X-100 for 15 minutes, and blocked with 1% BSA for 1 hour at room temperature. The cells were labeled with MST1 Polyclonal Antibody (Product # PA5-22015) at 1:100 dilution in 0.1% BSA, incubated at 4 degree Celsius overnight and then labeled with Goat anti-Rabbit IgG (Heavy Chain) Superclonal™ Secondary Antibody, Alexa Fluor® 488 conjugate (Product # A27034) for 45 minutes at room temperature (Panel a: green). Nuclei (Panel b: blue) were stained with ProLong™ Diamond Antifade Mountant with DAPI (Product # P36962). F-actin (Panel c: red) was stained with Rhodamine Phalloidin (Product # R415, 1:300). Panel d represents the merged image showing nucleus and cytoplasmic localization. Panel e represents control cells with no primary antibody to assess background. The images were captured at 60X magnification.
Supportive validation
- Submitted by
- Invitrogen Antibodies (provider)
- Main image
- Experimental details
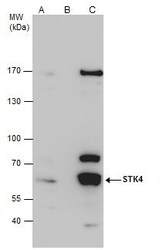
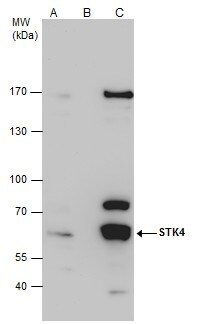
- STK4 antibody immunoprecipitates STK4 protein in IP experiments. IP samples: HepG2 whole cell extract. A. 50 µg HepG2 whole cell extract. B. Control with 4 µg of preimmune Rabbit IgG. C. Immunoprecipitation of STK4 protein by 4 µg STK4 antibody (Product # PA5-22015). 7.5 % SDS-PAGE. The immunoprecipitated STK4 protein was detected by STK4 antibody (Product # PA5-22015) diluted at 1:500.

Supportive validation
- Submitted by
- Invitrogen Antibodies (provider)
- Main image
- Experimental details
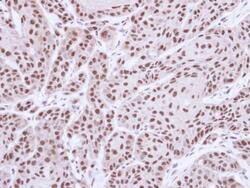
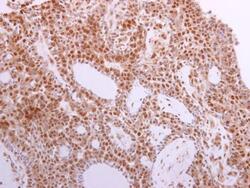
- Immunohistochemical analysis of paraffin-embedded Cal27 xenograft, using MST1 (Product # PA5-22015) antibody at 1:500 dilution. Antigen Retrieval: Citrate buffer, pH 6.0, 15 min.
- Submitted by
- Invitrogen Antibodies (provider)
- Main image
- Experimental details
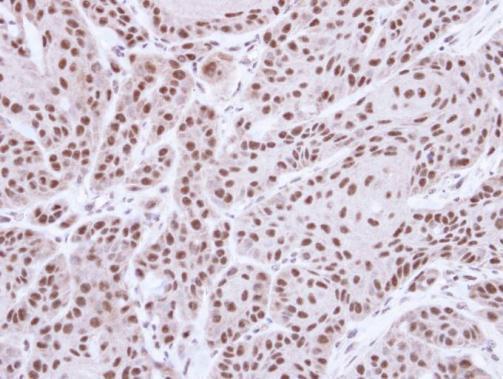
- Immunohistochemistry (Paraffin) analysis of MST1 was performed in paraffin-embedded human lung adenocarcinoma tissue using MST1 Polyclonal Antibody (Product # PA5-22015) at a dilution of 1:500.

Supportive validation
- Submitted by
- Invitrogen Antibodies (provider)
- Main image

- Experimental details
- STK4 antibody immunoprecipitates STK4 protein in IP experiments. IP samples: HepG2 whole cell extract. A. 50 µg HepG2 whole cell extract. B. Control with 4 µg of preimmune Rabbit IgG. C. Immunoprecipitation of STK4 protein by 4 µg STK4 antibody (Product # PA5-22015). 7.5 % SDS-PAGE. The immunoprecipitated STK4 protein was detected by STK4 antibody (Product # PA5-22015) diluted at 1:500.
- Submitted by
- Invitrogen Antibodies (provider)
- Main image
- Experimental details
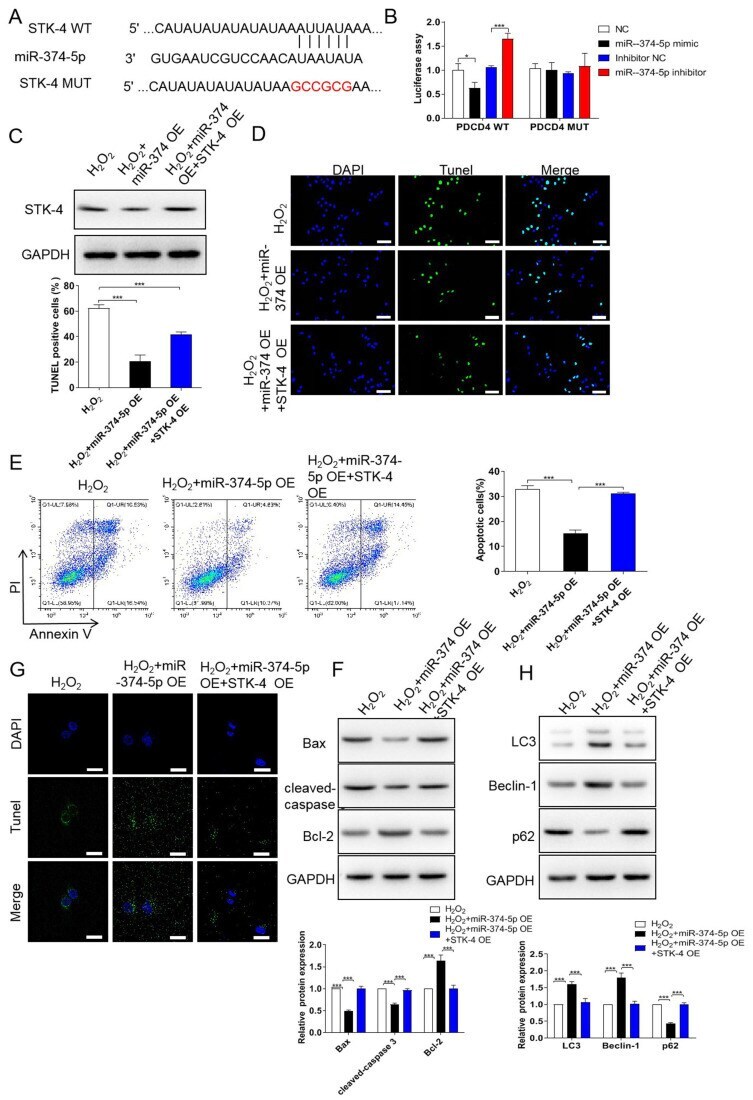
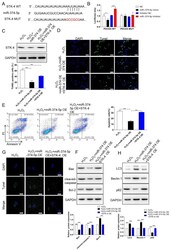
- MiR-374-5p activates autophagy of injured neurons through directly targeting STK-4. (A) Bioinformatics prediction of binding sites between miR-374-5p and the 3'UTR of the STK-4 mRNA. (B) The interaction of miR-374-5p and the 3'UTR of the STK-4 mRNA was examined by dual-luciferase reporter assay. (C) The expression level of STK-4 was detected by western blot. Cell apoptosis was examined by TUNEL staining (D), flow cytometry assay (E), and western blot of apoptosis markers (F). The autophagy flux was examined by immunofluorescence staining (G) and western blot of autophagy flux markers (H). The band intensities were analyzed using the gray values in Image J software.