 Explore
 Validate
 Learn
Learn Western blot
 Immunohistochemistry
Antibody data
- Antibody Data
- Antigen structure
- References [1]
- Comments [0]
- Validations
- Immunohistochemistry [1]
- Flow cytometry [3]
- Other assay [7]
Submit
Validation data
Reference
Comment
Report error
- Product number
- PA5-47012 - Provider product page

- Provider
- Invitrogen Antibodies
- Product name
- PLXND1 Polyclonal Antibody
- Antibody type
- Polyclonal
- Antigen
- Recombinant full-length protein
- Description
- In direct ELISAs and Western blots, less than 1% cross-reactivity with recombinant mouse (rm) Plexin A1, rmPlexin A3, and recombinant human Plexin B1 is observed. Reconstitute at 0.2 mg/mL in sterile PBS.
- Reactivity
- Human
- Host
- Goat
- Isotype
- IgG
- Vial size
- 100 μg
- Concentration
- 0.2 mg/mL
- Storage
- -20°C, Avoid Freeze/Thaw Cycles
Submitted references PLXND1-mediated calcium dyshomeostasis impairs endocardial endothelial autophagy in atrial fibrillation.
Sun M, Chen Z, Song Y, Zhang B, Yang J, Tan H
Frontiers in physiology 2022;13:960480
Frontiers in physiology 2022;13:960480
No comments: Submit comment
Supportive validation
- Submitted by
- Invitrogen Antibodies (provider)
- Main image
- Experimental details
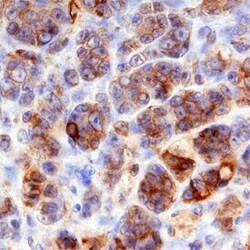
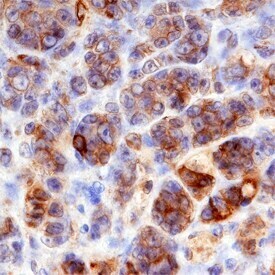
- Immunohistochemical analysis of PLXND1 in immersion fixed paraffin-embedded sections of human melanoma. Samples were incubated in PLXND1 polyclonal antibody (Product # PA5-47012) using a dilution of 3 µg/mL overnight at 4 °C. Before incubation with the primary antibody, tissue was subjected to heat-induced epitope retrieval using Antigen Retrieval Reagent-Basic. Tissue was stained using the Anti-Goat HRP-DAB Cell & Tissue Staining Kit (brown) and counterstained with hematoxylin (blue). Specific staining was localized to plasma membranes.
Supportive validation
- Submitted by
- Invitrogen Antibodies (provider)
- Main image
- Experimental details
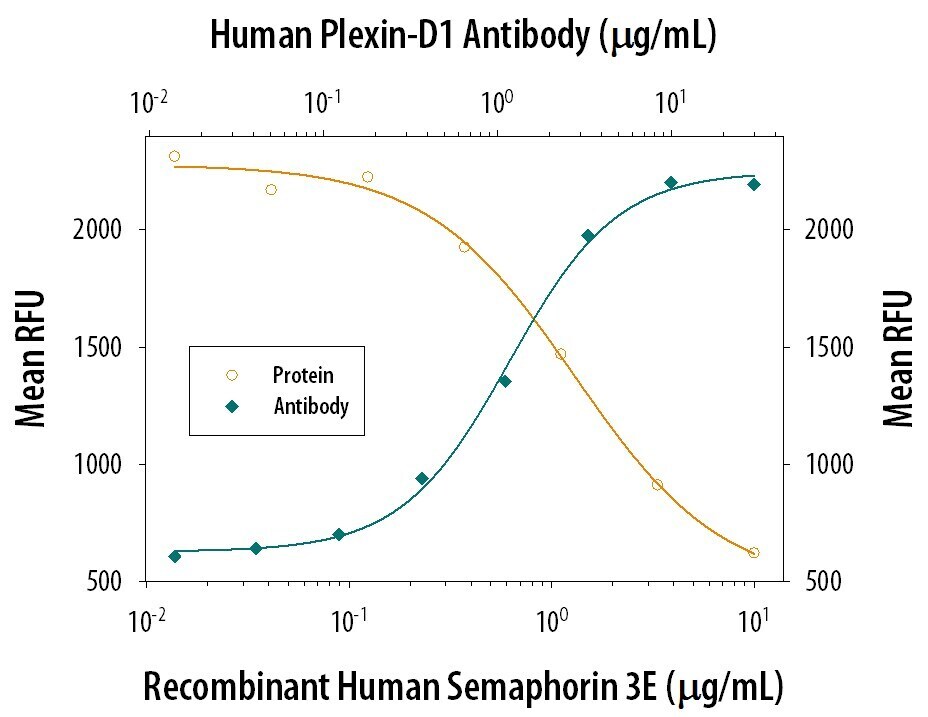
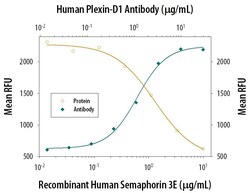
- Flow cytometric analysis of recombinant Human Semaphorin 3E inhibits proliferation in the HUVEC human umbilical vein endothelial cells in a dose-dependent manner (orange line). Plexin D1 mediated inhibition elicited by Recombinant Human Semaphorin 3E (5 µg/mL) is neutralized (green line) by increasing concentrations of Goat Anti-Human Plexin D1 Antigen Affinity-purified Polyclonal Antibody (Product # PA5-47012). The ND50 is typically 0.5-2 µg/mL.

- Submitted by
- Invitrogen Antibodies (provider)
- Main image
- Experimental details
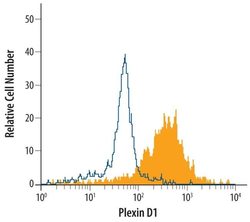
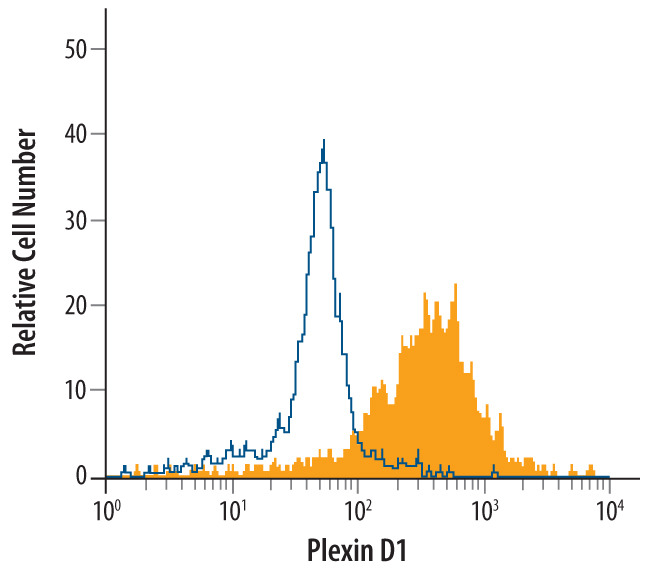
- Flow cytometry of PLXND1 in Human peripheral blood monocytes. Samples were incubated in PLXND1 polyclonal antibody (Product # PA5-47012) or control antibody followed by Phycoerythrin-conjugated Anti-Goat IgG Secondary Antibody.
- Submitted by
- Invitrogen Antibodies (provider)
- Main image

- Experimental details
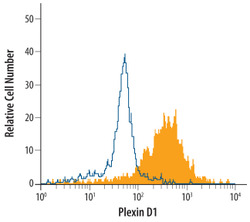
- Flow cytometry of PLXND1 in Human peripheral blood monocytes. Samples were incubated in PLXND1 polyclonal antibody (Product # PA5-47012) or control antibody followed by Phycoerythrin-conjugated Anti-Goat IgG Secondary Antibody.

Supportive validation
- Submitted by
- Invitrogen Antibodies (provider)
- Main image

- Experimental details
- Neutralization antibody testing demonstrates the specificity of an antibody through a correlation between antibody binding and the activity of the target. Neutralization of PLXND1 is shown by the increase in mean RFU (relative fluorescent units - measure of proliferation of HUVEC cells) with increasing concentrations of PLXND1 Polyclonal Antibody (PA5-47012).

- Submitted by
- Invitrogen Antibodies (provider)
- Main image

- Experimental details
- Neutralization of PLXND1 in HUVEC human umbilical vein endothelial cells. Samples were incubated in PLXND1 polyclonal antibody (Product # PA5-47012). Recombinant Human Semaphorin 3E inhibits proliferation in the HUVEC human umbilical vein endothelial cells in a dose-dependent manner (orange line). Plexin D1 mediated inhibition elicited by Recombinant Human Semaphorin 3E (5 µg/mL) is neutralized (green line) by increasing concentrations of Goat Anti-Human Plexin D1 Antigen Affinity-purified Polyclonal Antibody. The ND50 is typically 0.5-2 µg/mL.
- Submitted by
- Invitrogen Antibodies (provider)
- Main image
- Experimental details
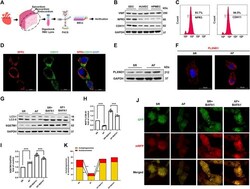
- FIGURE 2 Atrial fibrillation promotes PLXND1 expression and inhibits autophagy in endocardial endothelial cells. (A) Diagram of the EEC isolation from SR and AF mice. (B) Verification with specific markers (NPR3 and CDH11) in EECs compared to those in HUVECs and HPMECs by WB data. (C) Verification with specific markers (NPR3 and CDH11) in EECs compared to those in HUVECs and HPMECs by FACS. (D) Immunostaining data verifying the colocalization of EEC marker NPR3 (red) and CDH11 (green) in EECs. (E) Representative WB and quantification of PLXND1 in EECs isolated from SR and AF mice. (G-I) Representative WB and quantification of autophagy-related protein levels of EECs subjected to BAFA1 (100 nM) treatment or no treatment. (J) EECs from SR and AF mice were infected with a tandem GFP-mRFP-LC3 adenovirus for 24 h. Representative images show formation of puncta in different groups. Scale bar: 10 mum. (K) Quantitative analysis of yellow and free red puncta in merged images. The number of both yellow and free red puncta decreased in the EECs of AF mice compared to that in SR mice. ( n = 10 cells per group; cells were isolated from three mice for one experiment and three independent experiments were performed; mean +- SD; * p < 0.05, ** p < 0.01). EECs, endocardial endothelial cells; SR, sinus rhythm; AF, atrial fibrillation; HUVECs, human umbilical vein endothelial cells; HPMECs, human pulmonary microvascular endothelial cells; FACS, fluorescence-activated cell sorting; NPR3, natriur

- Submitted by
- Invitrogen Antibodies (provider)
- Main image
- Experimental details
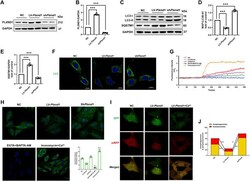
- FIGURE 3 PLXND1 inhibits autophagy via intracellular calcium signaling. Mouse EECs were treated with NC, LV- Plxnd1 , and sh Plxnd1 . (A) Representative WB of PLXND1 in EECs subjected to the indicated treatments. (B) Quantitative analysis of the efficacy of overexpression and knockdown of Plxnd1 . (C) Representative western blots of autophagic markers in EECs subjected to the indicated treatments. (D-E) Quantitative analysis indicates that PLXND1 significantly affects the level of autophagy. (F) Immunofluorescence staining was used to detect MAP1LC3B in EECs. Scale bar: 20 mum. (G) Intracellular calcium was marked by the Fluo-3-AM probe and measured continuously for 8 min (H) EECs were incubated with the calcium probe Fluo-3-AM. EGTA + BAPTA-AM was used to obtain the minimum fluorescence intensity (F min ), whereas ionomycin + calcium was used to obtain the maximum fluorescence intensity (F max ). Scale bar: 20 mum. Quantitative analysis showed the fluorescence intensity in the different groups. (I-J) EECs were infected with a tandem GFP-mRFP-LC3 adenovirus for 24 h. Representative merged images (I) and quantitative analysis (J) of yellow and free red puncta in merged images of different treatment groups. Scale bar: 10 mum. EECs, endocardial endothelial cells; NC, negative control; PLXND1, plexinD1; WB, western blotting; EGTA, ethylene glycol tetraacetic acid.

- Submitted by
- Invitrogen Antibodies (provider)
- Main image

- Experimental details
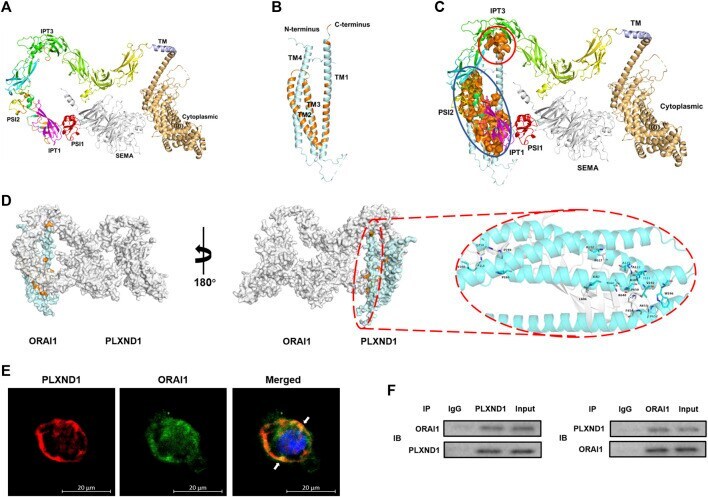
- FIGURE 4 PLXND1 binds to ORAI1 in endocardial endothelial cells to regulate intracellular calcium levels. (A-B) Structure of predicted PLXND1 (A) and ORAI1 (B) . The elements of secondary structure (alpha-helices and beta-sheets) are represented by different colors. (C) Schematic visualization of the PLXND1-ORAI1 complex, and the coupling regions were marked by red and blue solid circle respectively. (D) Three-dimensional structure showing PLXND1-ORAI1 in (C) . PLXND1 and ORAI1 are represented as the grey and blue ribbon respectively. A view rotated 180deg about the y axis is shown with the enlargement of interact surface in red solid circle (right). (E) Immunofluorescent staining was applied to mark PLXND1 (red) and ORAI1 (green) in EECs. White arrows represent their colocalization on the EECs. Scale bar: 20 mum. (F) Lysates from EECs were subjected to IP with IgG, anti-PLXND1, or anti-ORAI1 antibody, followed by western blotting for PLXND1 and ORAI1. PLXND1, plexinD1; EECs, endocardial endothelial cells; IP, immunoprecipitation; IB, immunoblotting; NC, negative control; WB, western blot.
- Submitted by
- Invitrogen Antibodies (provider)
- Main image
- Experimental details
- Neutralization of PLXND1 in HUVEC human umbilical vein endothelial cells. Samples were incubated in PLXND1 polyclonal antibody (Product # PA5-47012). Recombinant Human Semaphorin 3E inhibits proliferation in the HUVEC human umbilical vein endothelial cells in a dose-dependent manner (orange line). Plexin D1 mediated inhibition elicited by Recombinant Human Semaphorin 3E (5 µg/mL) is neutralized (green line) by increasing concentrations of Goat Anti-Human Plexin D1 Antigen Affinity-purified Polyclonal Antibody. The ND50 is typically 0.5-2 µg/mL.

- Submitted by
- Invitrogen Antibodies (provider)
- Main image

- Experimental details
- Neutralization antibody testing demonstrates the specificity of an antibody through a correlation between antibody binding and the activity of the target. Neutralization of PLXND1 is shown by the increase in mean RFU (relative fluorescent units - measure of proliferation of HUVEC cells) with increasing concentrations of PLXND1 Polyclonal Antibody (PA5-47012).
