Explore
 Validate
 Learn
Learn Immunohistochemistry
Antibody data
- Antibody Data
- Antigen structure
- References [2]
- Comments [0]
- Validations
- Immunohistochemistry [4]
- Flow cytometry [1]
- Other assay [3]
Submit
Validation data
Reference
Comment
Report error
- Product number
- PA5-18522 - Provider product page

- Provider
- Invitrogen Antibodies
- Product name
- Leptin Receptor Polyclonal Antibody
- Antibody type
- Polyclonal
- Antigen
- Synthetic peptide
- Description
- This antibody is predicted to react with canine based on sequence homology. This antibody is tested in Peptide ELISA: antibody detection limit dilution 128,000.
- Reactivity
- Human
- Host
- Goat
- Isotype
- IgG
- Vial size
- 100 μg
- Concentration
- 0.5 mg/mL
- Storage
- -20°C, Avoid Freeze/Thaw Cycles
Submitted references Silicified collagen scaffold induces semaphorin 3A secretion by sensory nerves to improve in-situ bone regeneration.
Epiregulin as an Alternative Ligand for Leptin Receptor Alleviates Glucose Intolerance without Change in Obesity.
Ma YX, Jiao K, Wan QQ, Li J, Liu MY, Zhang ZB, Qin W, Wang KY, Wang YZ, Tay FR, Niu LN
Bioactive materials 2022 Mar;9:475-490
Bioactive materials 2022 Mar;9:475-490
Epiregulin as an Alternative Ligand for Leptin Receptor Alleviates Glucose Intolerance without Change in Obesity.
Song NJ, Lee A, Yasmeen R, Shen Q, Yang K, Kumar SB, Muhanna D, Arnipalli S, Noria SF, Needleman BJ, Hazey JW, Mikami DJ, Ortega-Anaya J, Jiménez-Flores R, Prokop J, Ziouzenkova O
Cells 2022 Jan 26;11(3)
Cells 2022 Jan 26;11(3)
No comments: Submit comment
Supportive validation
- Submitted by
- Invitrogen Antibodies (provider)
- Main image

- Experimental details
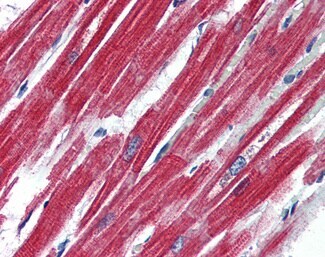
- Immunohistochemistry analysis of Leptin Receptor in human heart. Samples were incubated with Leptin Receptor polyclonal antibody (Product # PA5-18522) using a dilution of 4 µg/mL. Formalin-fixed, paraffin-embedded tissue after heat-induced antigen retrieval.
- Submitted by
- Invitrogen Antibodies (provider)
- Main image
- Experimental details
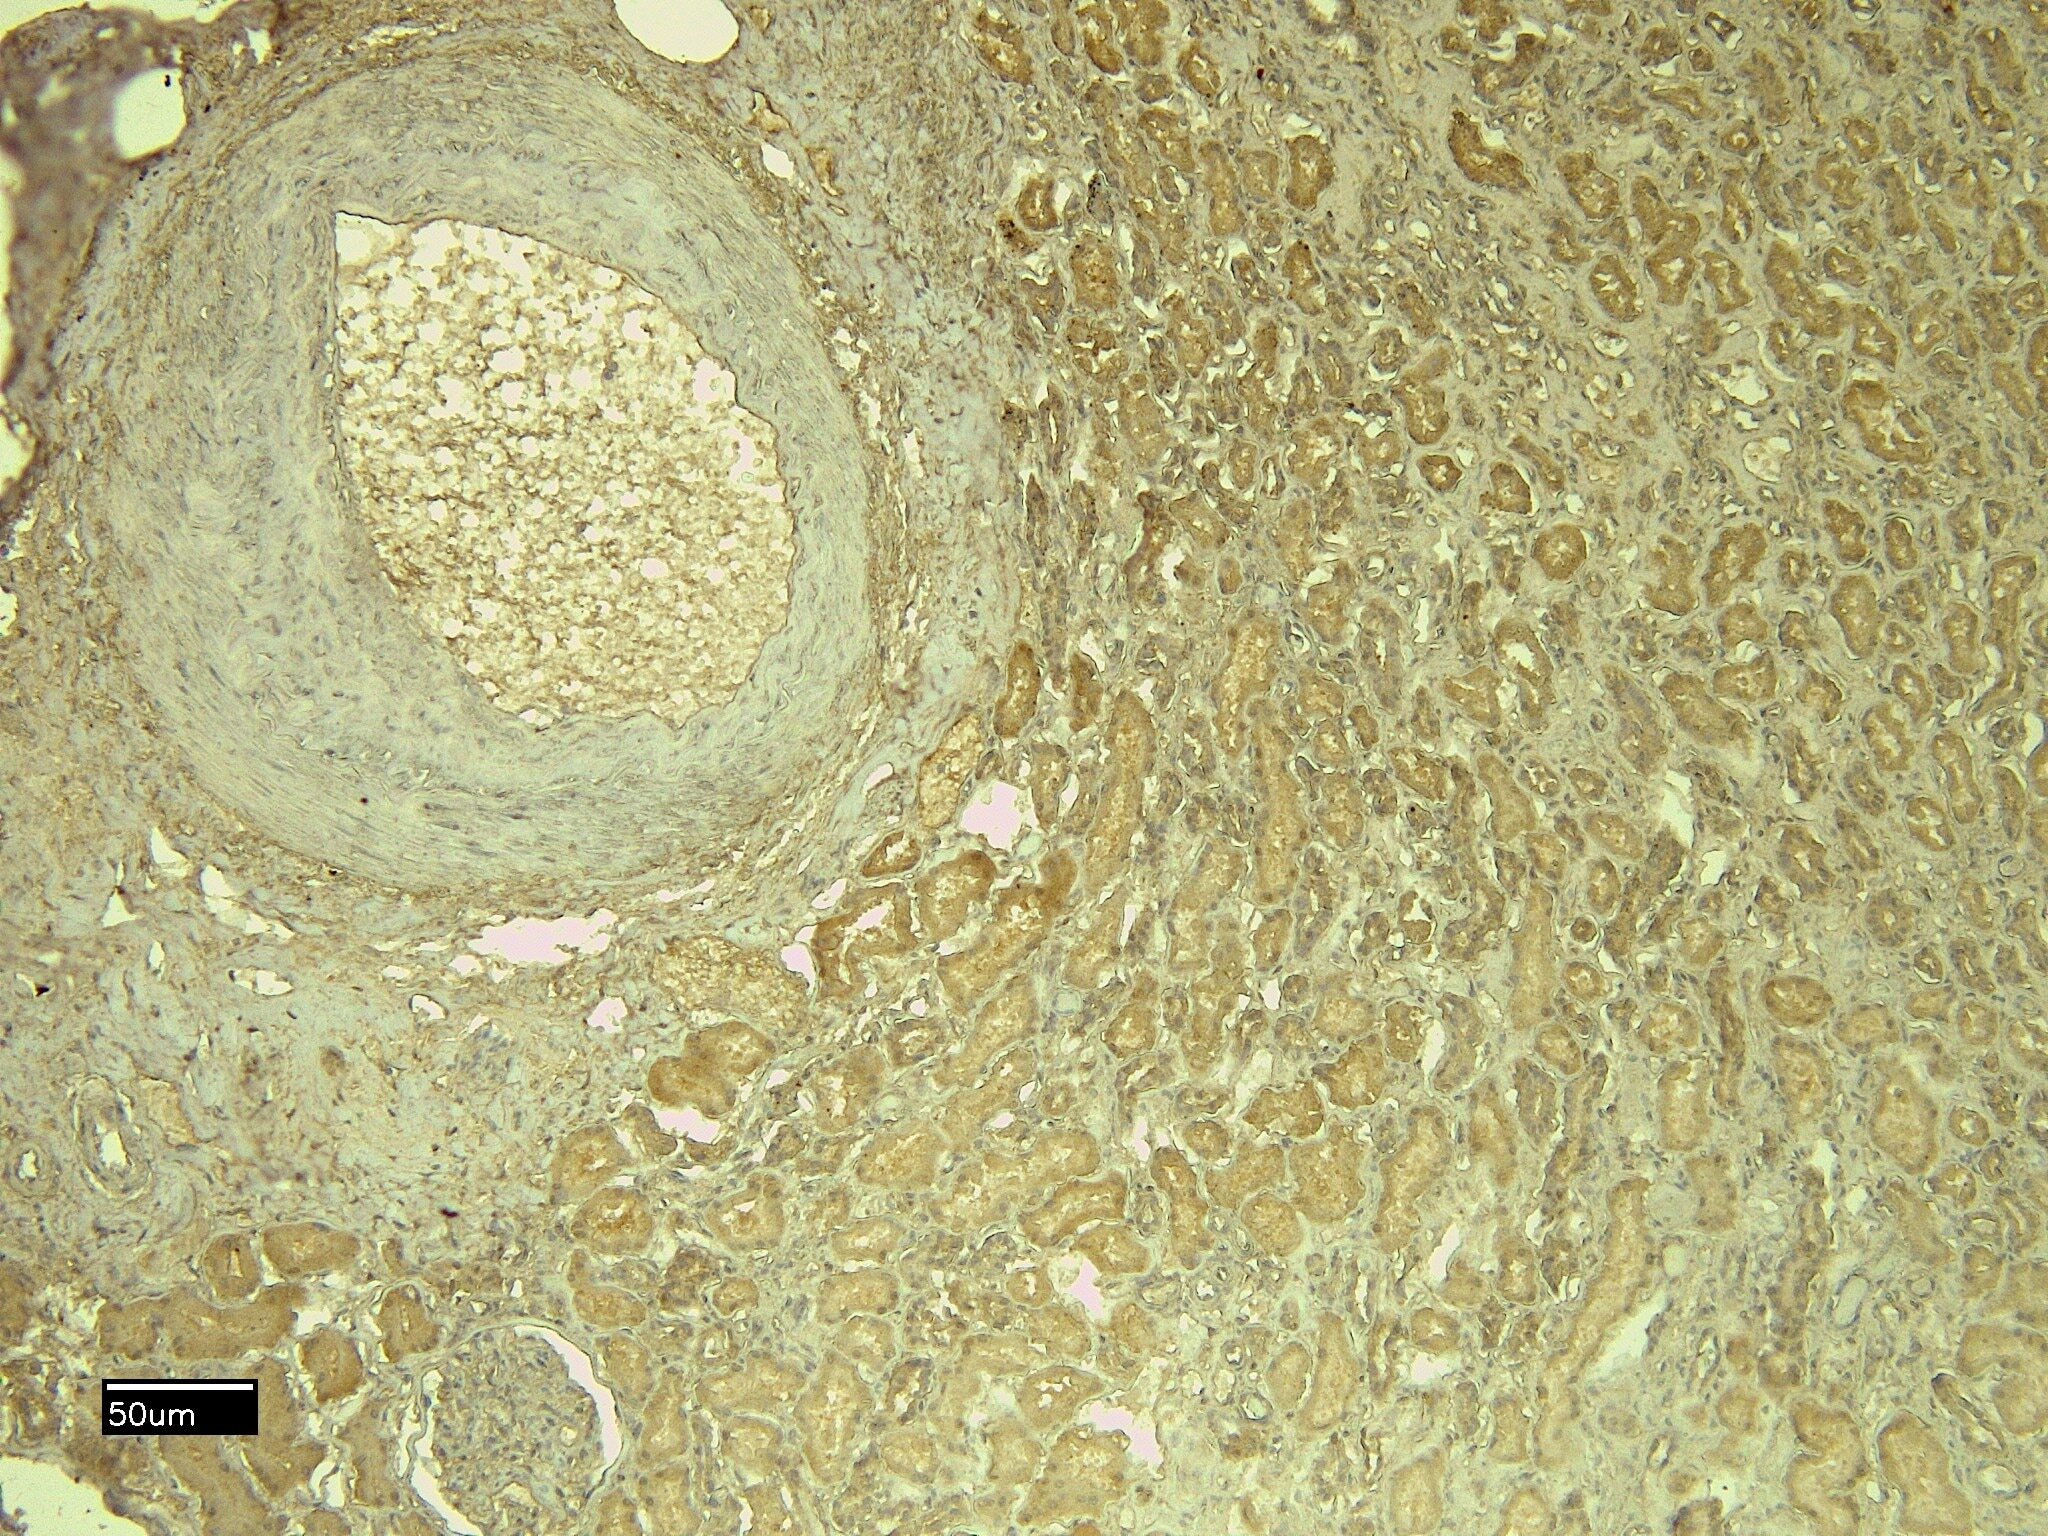
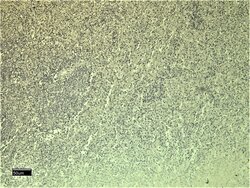
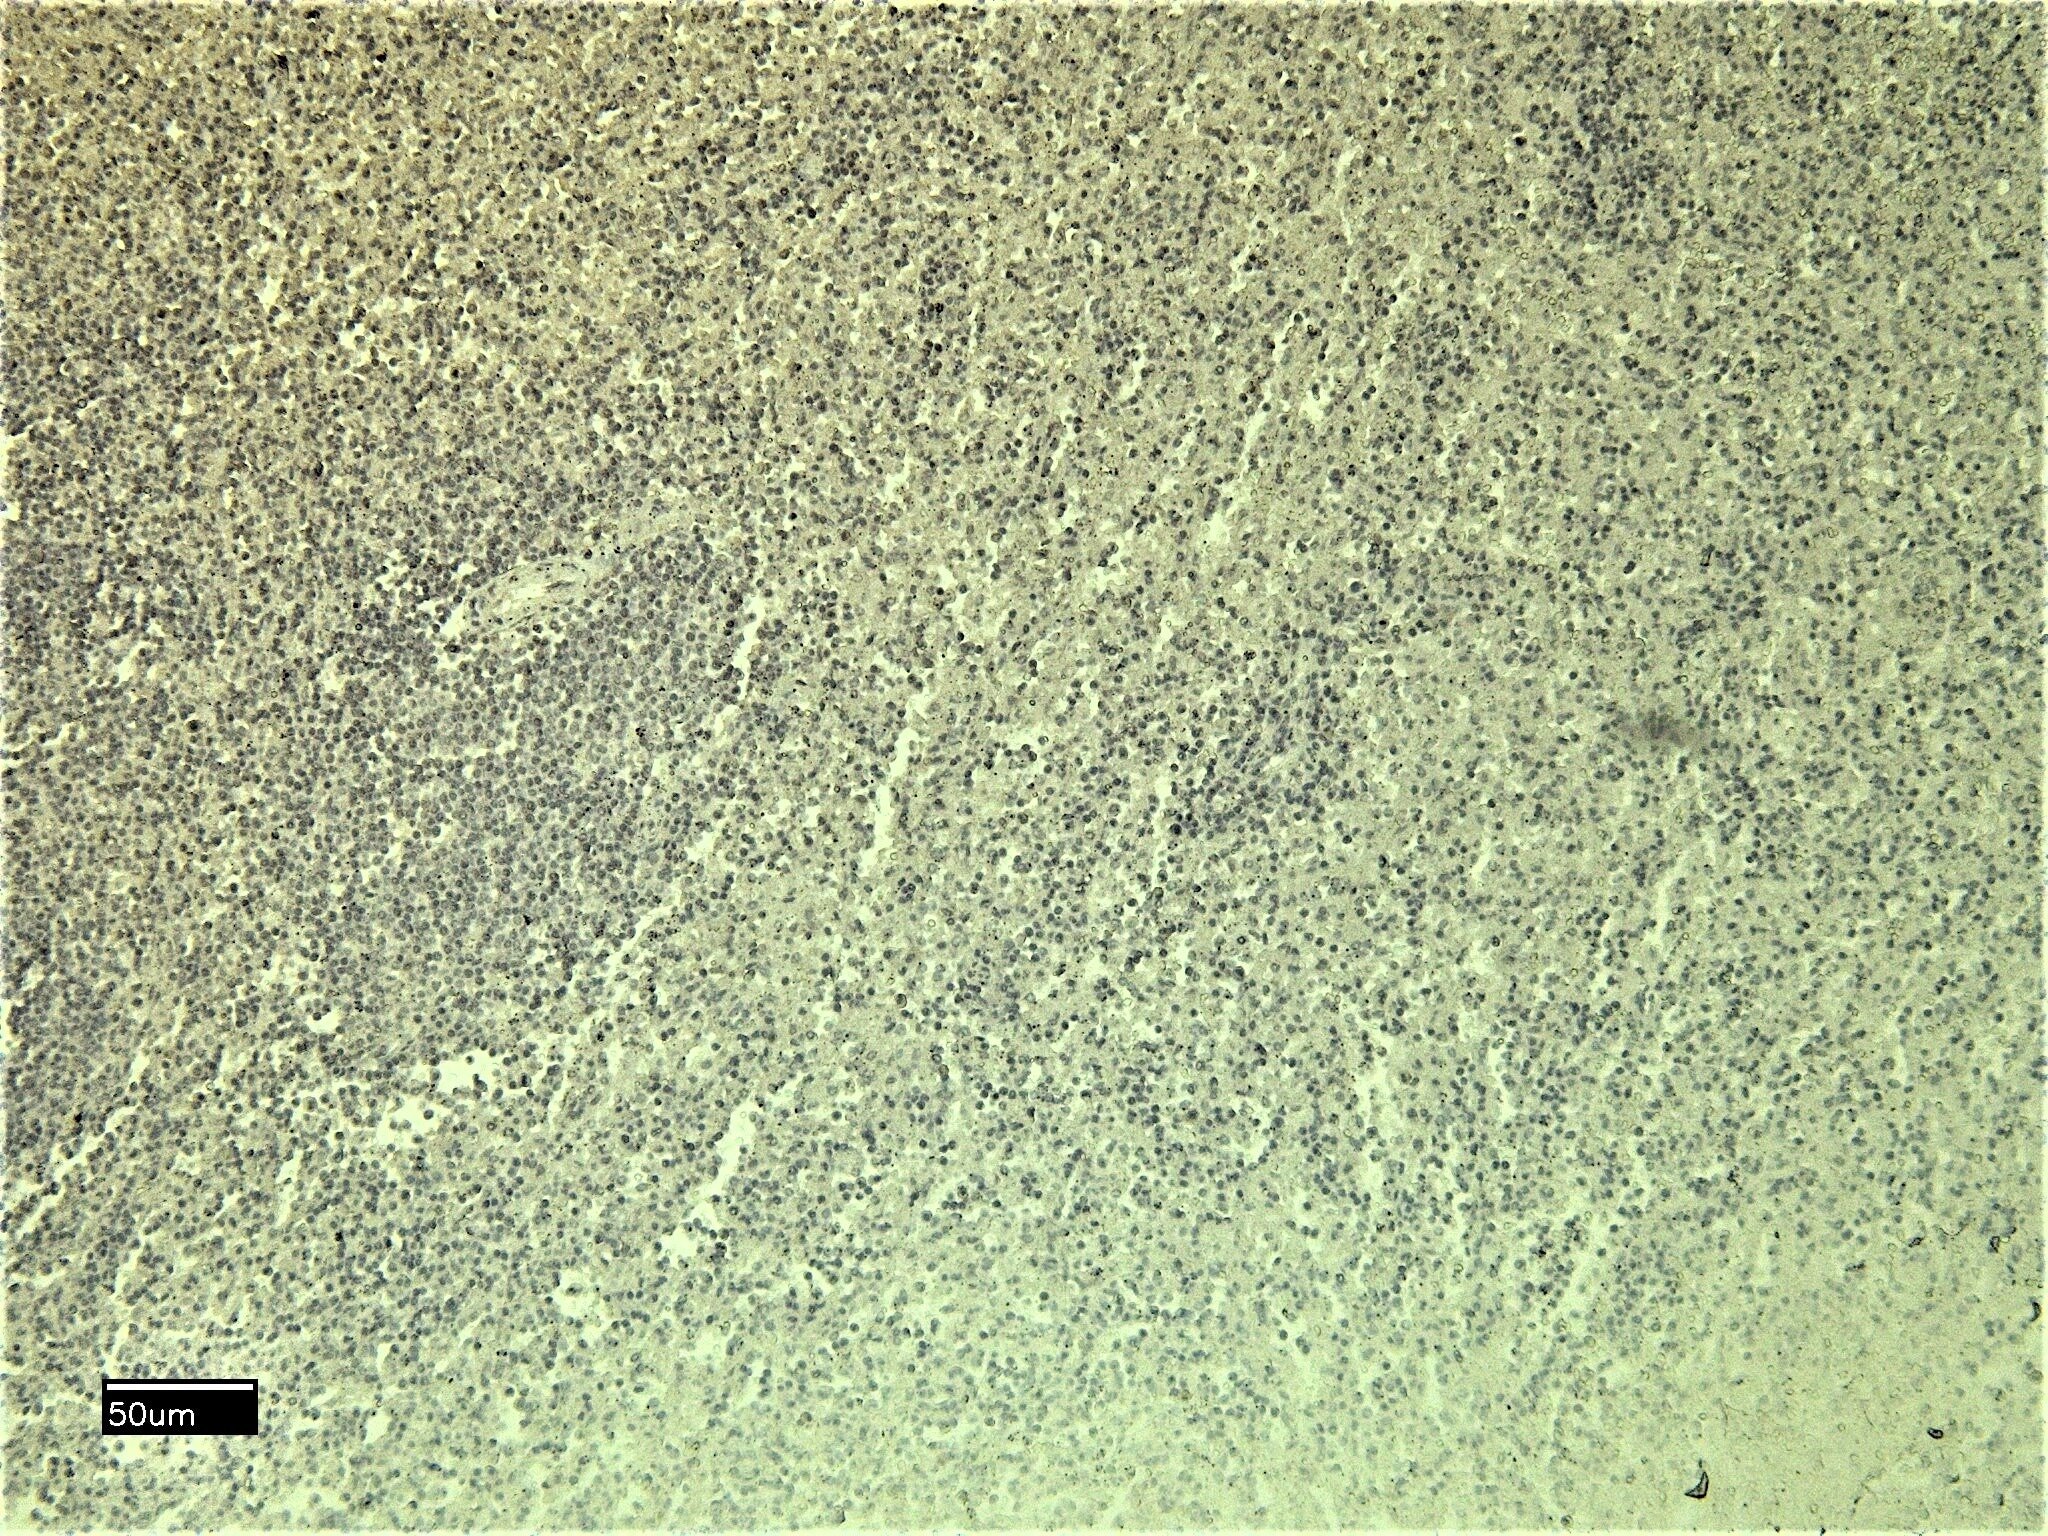
- Immunohistochemistry (PFA fixed) analysis of Leptin Receptor using Leptin Receptor Polyclonal Antibody (Product # PA5-18522) (6 µg/mL) in staining of paraffin embedded Human Spleen. Heat induced antigen retrieval with citrate buffer Ph 6, HRP-staining.
- Submitted by
- Invitrogen Antibodies (provider)
- Main image
- Experimental details
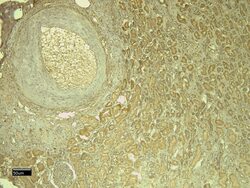
- Negative Control for Leptin Receptor Polyclonal Antibody (Product # PA5-18522), showing immunohistochemical staining of paraffin embedded Human Spleen, with no primary antibody.
- Submitted by
- Invitrogen Antibodies (provider)
- Main image

- Experimental details
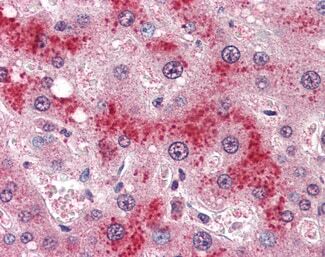
- Immunohistochemistry analysis of Leptin Receptor in human liver. Samples were incubated with Leptin Receptor polyclonal antibody (Product # PA5-18522) using a dilution of 4 µg/mL. Formalin-fixed, paraffin-embedded tissue after heat-induced antigen retrieval.
Supportive validation
- Submitted by
- Invitrogen Antibodies (provider)
- Main image
- Experimental details
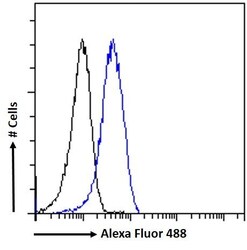
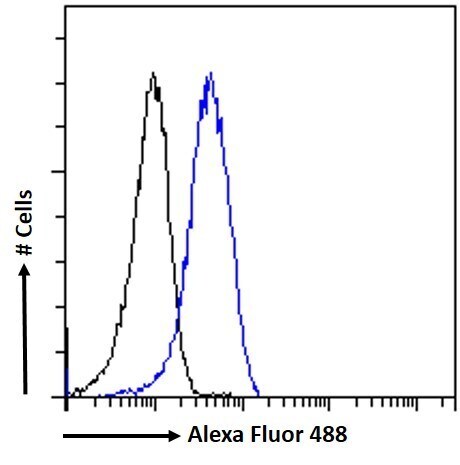
- Flow Cytometry analysis of Leptin Receptor using Leptin Receptor Polyclonal Antibody (Product # PA5-18522) in paraformaldehyde fixed K562 cells (blue line), permeabilized with 0.5% Triton. Primary incubation 1hr (10 µg/mL) followed by Alexa Fluor 488 secondary antibody (1 µg/mL). IgG control: Unimmunized goat IgG (black line) followed by Alexa Fluor 488 secondary antibody.
Supportive validation
- Submitted by
- Invitrogen Antibodies (provider)
- Main image
- Experimental details
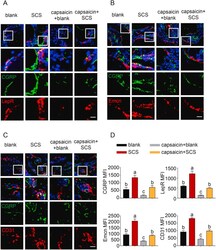
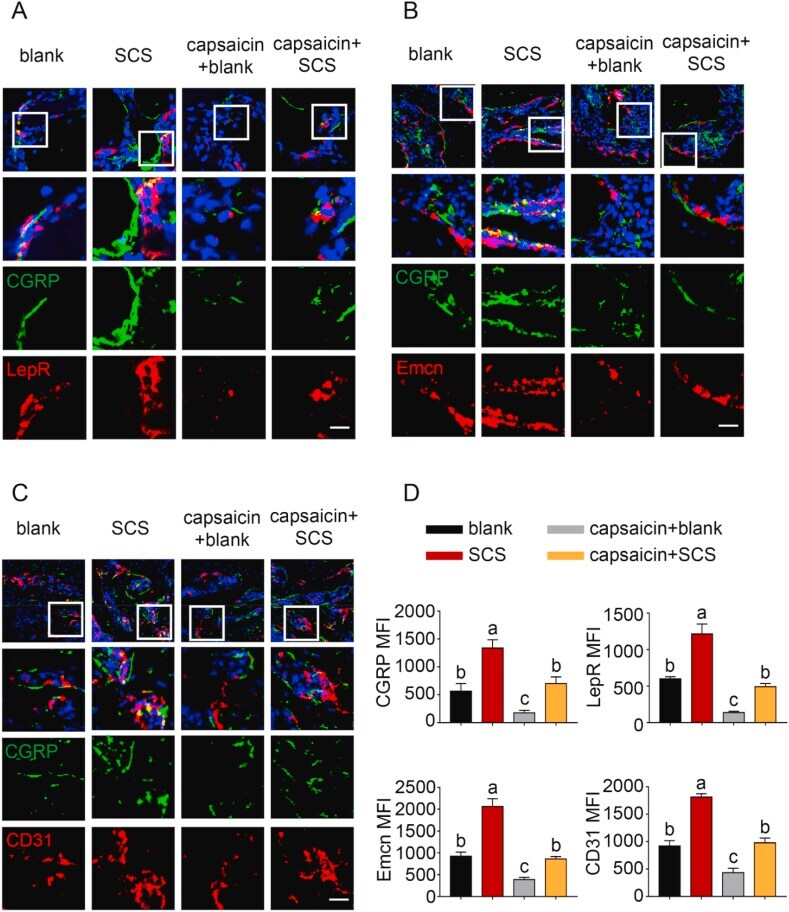
- Fig. 4 Immunofluorescence staining of defect areas at 6 weeks after surgery. ( A ) Representative images of immunofluorescence staining of CGRP and LepR. ( B ) Representative images of CGRP and Emcn staining. ( C ) Representative images of CGRP and CD31 staining. ( D ) Quantification of CGRP, LepR, Emcn and CD31 median fluorescence intensity (MFI) per field view. Nuclei were stained with DAPI (blue). Scale bar: 100 mum. Data represent means +- standard deviations (n = 6). For all charts, groups labeled with different lowercase letters are significantly different (p < 0.05). Fig. 4
- Submitted by
- Invitrogen Antibodies (provider)
- Main image
- Experimental details
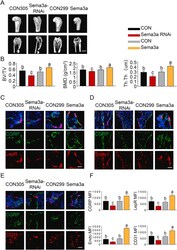
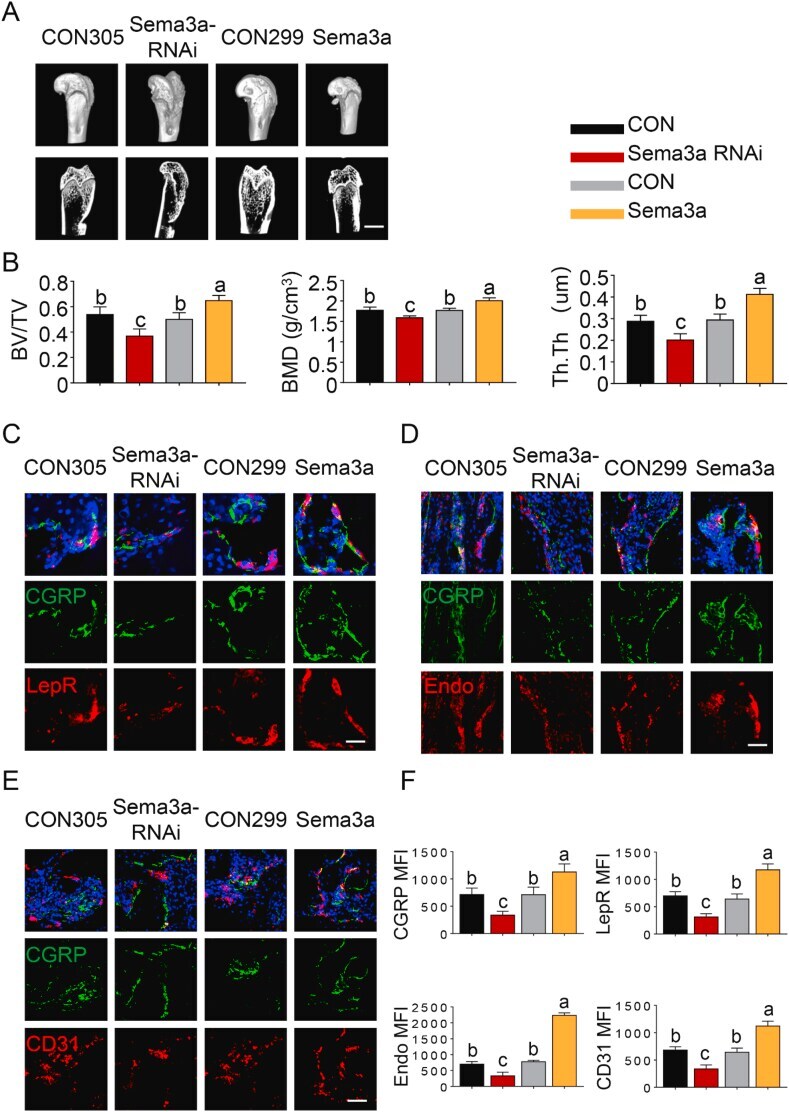
- Fig. 7 Sensory nerve-derived Sema3A promotes osteogenesis and angiogenesis in SCS-mediated bone regeneration. ( A ) Micro-CT analysis of bone regeneration at 12 weeks. 3D reconstructed superficial and interior images of femoral condyle defects in different groups. Scale bar: 4 cm. ( B ) Quantitative analysis of bone volume/total volume (TV/BV), bone mineral density (BMD) and Trabecular Thickness (Tb.Th) (n = 6). ( C ) Representative images of immunofluorescence staining of Leptin Receptor and CGRP. ( D ) Representative images of immunofluorescence staining of CGRP and Emcn. ( E ) Representative images of immunofluorescence staining of CGRP and CD31. ( F ) Quantification of CGRP, LepR, Emcn and CD31 median fluorescence intensity (MFI) per field view. Nuclei were stained with DAPI (blue). Scale bar: 100 mum. For all charts, data represent means +- standard deviations (n = 6). Groups labeled with different lowercase letters are significantly different (p < 0.05). Fig. 7
- Submitted by
- Invitrogen Antibodies (provider)
- Main image
- Experimental details
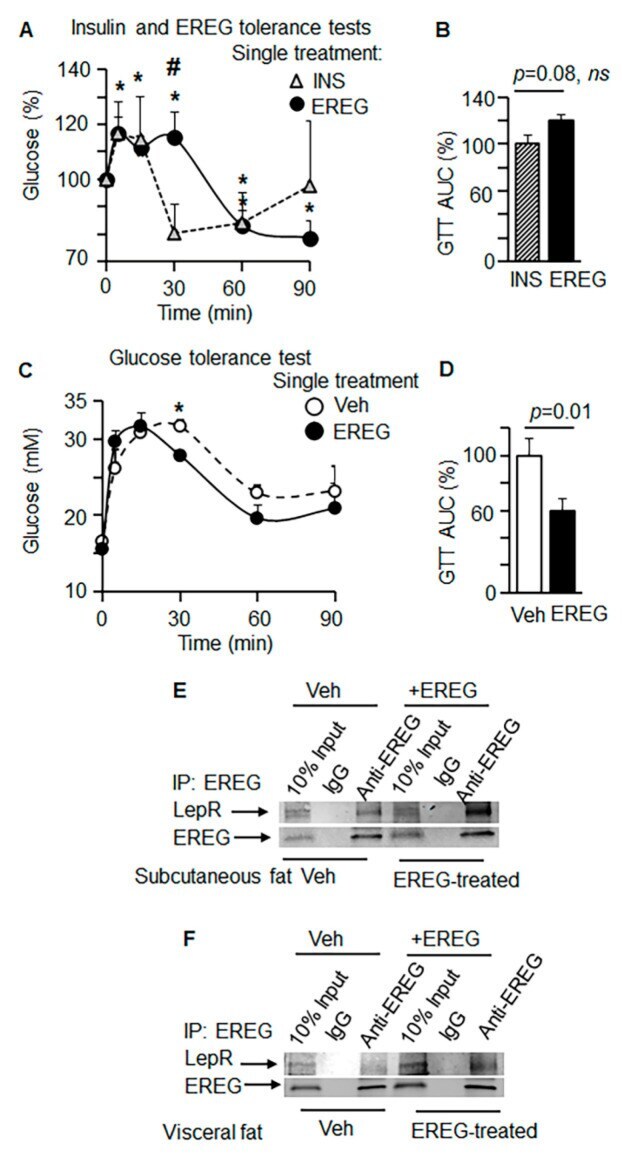
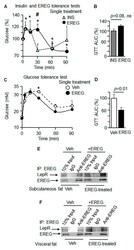
- Figure 2 EREG regulated glucose uptake via binding with LepR in Lep ob mice. ( A ) EREG and insulin tolerance test in Lep ob mice ( n = 5 per group) treated with a single intraperitoneal injection of insulin (0.012 IU/g BW, triangle dashed line) or EREG (80 ng/g BW, closed circles. Asterisks, significant (* p < 0.05) compared to glucose levels before EREG treatment. # Hashtag, significant difference in glucose levels 30 min after treatment with EREG or insulin. Unpaired Student's t -test. ( B ) Area under the curve (AUC) quantification of insulin (hatched bar) and EREG (black bar) tolerance tests. Unpaired Student's t -test, ns . ( C ) GTT kinetics were measured in Lep ob mice ( n = 5 per treatment) treated with a single injection of PBS (Veh, open circles) or EREG (closed circles). Student's t -test. * p < 0.05 from comparison between control and EREG treated mice at each time point. ( D ) Area under the curve (AUC) quantification of insulin (hatched bar) and EREG (black bar) tolerance tests. Unpaired Student's t -test. ( E , F ). Immunoprecipitation of LepR was performed with anti-EREG antibody using homogenates from subcutaneous fat ( C ) and visceral fat ( D ). Fat tissue was isolated from non-treated Lep ob (Veh) as well as Lep ob mice 15 min after injection of EREG (50 ng/mL).