Explore
 Validate
 Learn
Learn Western blot
 Immunocytochemistry
Antibody data
- Antibody Data
- Antigen structure
- References [2]
- Comments [0]
- Validations
- Immunocytochemistry [2]
- Other assay [4]
Submit
Validation data
Reference
Comment
Report error
- Product number
- PA5-34864 - Provider product page

- Provider
- Invitrogen Antibodies
- Product name
- DEPDC1 Polyclonal Antibody
- Antibody type
- Polyclonal
- Antigen
- Recombinant full-length protein
- Description
- Recommended positive controls: 293T, A431, HepG2. Predicted reactivity: Rat (87%). Store product as a concentrated solution. Centrifuge briefly prior to opening the vial.
- Reactivity
- Human
- Host
- Rabbit
- Isotype
- IgG
- Vial size
- 100 μL
- Concentration
- 1 mg/mL
- Storage
- Store at 4°C short term. For long term storage, store at -20°C, avoiding freeze/thaw cycles.
Submitted references Linc-ROR facilitates progression and angiogenesis of hepatocellular carcinoma by modulating DEPDC1 expression.
DEPDC1 drives hepatocellular carcinoma cell proliferation, invasion and angiogenesis by regulating the CCL20/CCR6 signaling pathway.
Tian C, Abudoureyimu M, Lin X, Chu X, Wang R
Cell death & disease 2021 Nov 5;12(11):1047
Cell death & disease 2021 Nov 5;12(11):1047
DEPDC1 drives hepatocellular carcinoma cell proliferation, invasion and angiogenesis by regulating the CCL20/CCR6 signaling pathway.
Guo W, Li H, Liu H, Ma X, Yang S, Wang Z
Oncology reports 2019 Sep;42(3):1075-1089
Oncology reports 2019 Sep;42(3):1075-1089
No comments: Submit comment
Supportive validation
- Submitted by
- Invitrogen Antibodies (provider)
- Main image

- Experimental details
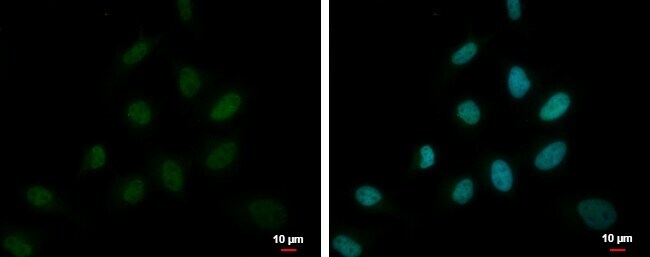
- DEPDC1 Polyclonal Antibody detects DEPDC1 protein at nucleus by immunofluorescent analysis. Sample: HeLa cells were fixed in 4% paraformaldehyde at RT for 15 min. Green: DEPDC1 protein stained by DEPDC1 Polyclonal Antibody (Product # PA5-34864) diluted at 1:500. Blue: Hoechst 33342 staining. Scale bar = 10 µm.
- Submitted by
- Invitrogen Antibodies (provider)
- Main image

- Experimental details
- DEPDC1 Polyclonal Antibody detects DEPDC1 protein at nucleus by immunofluorescent analysis. Sample: HeLa cells were fixed in 4% paraformaldehyde at RT for 15 min. Green: DEPDC1 protein stained by DEPDC1 Polyclonal Antibody (Product # PA5-34864) diluted at 1:500. Blue: Hoechst 33342 staining. Scale bar = 10 µm.

Supportive validation
- Submitted by
- Invitrogen Antibodies (provider)
- Main image
- Experimental details
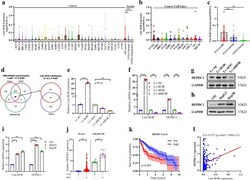
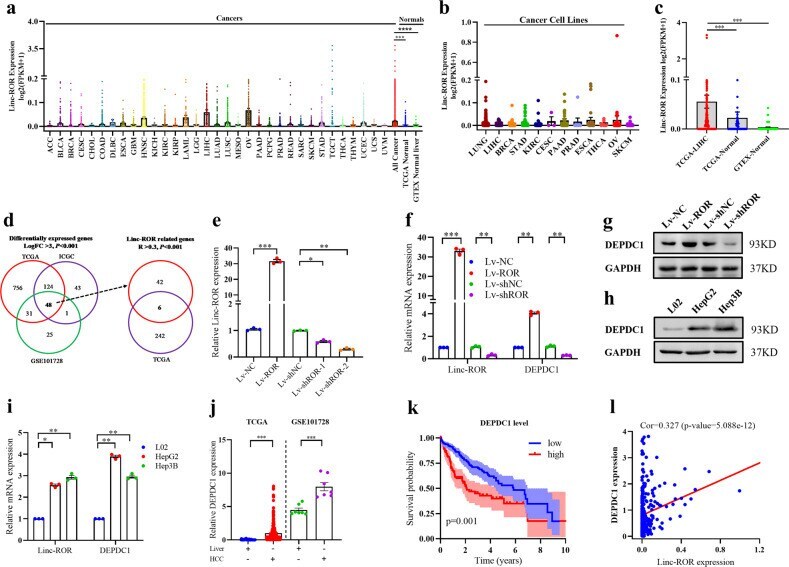
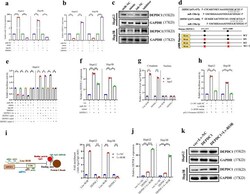
- Fig. 1 Linc-ROR was upregulated and regulated DEPDC1 expression. a Expression of Linc-ROR in TCGA tumors and normal tissue samples from GTEx and TCGA. b Expression of THOR in the CCLE cell line panel. c Expression of Linc-ROR in the TCGA Liver hepatocellular carcinoma (LIHC) and matched normal samples and GTEx tissue samples. d Venn diagram showing the screening of Linc-ROR-specific mRNAs. Aberrantly mRNAs were analyzed in liver cancer using the TCGA, ICGC and GSE101728 database. A total of 48 genes were differentially expressed in these three database (LogFC > 3, P < 0.001). These genes are then intersected with the genes co-expressed by Linc-ROR ( R > 0.3, P < 0.001) in the TCGA database. e The overexpression and interference efficiency of Linc-ROR in HepG2 cells were detected using qRT-PCR. f , g The mRNA and protein levels of Linc-ROR and DEPDC1 in HepG2 cells after transfection with overexpression Lv-ROR or interference Lv-shROR. h , i The mRNA and protein expression level of Linc-ROR and DEPDC1 in a normal liver cell line (L02) and HepG2 and Hep3B cell lines were tested by quantitative qRT-PCR. j Expression of DEPC1 in the TCGA and GSE101728 databases. k The overall survival curve in HCC patients with high or low DEPDC1 expression based on TCGA data. l Expression level of Linc-ROR was significantly correlated with DEPDC1 expression in patients with LIHC of the TCGA database. Data are shown as mean +- SD, n = 3. The data statistical significance is assessed by Student's
- Submitted by
- Invitrogen Antibodies (provider)
- Main image
- Experimental details
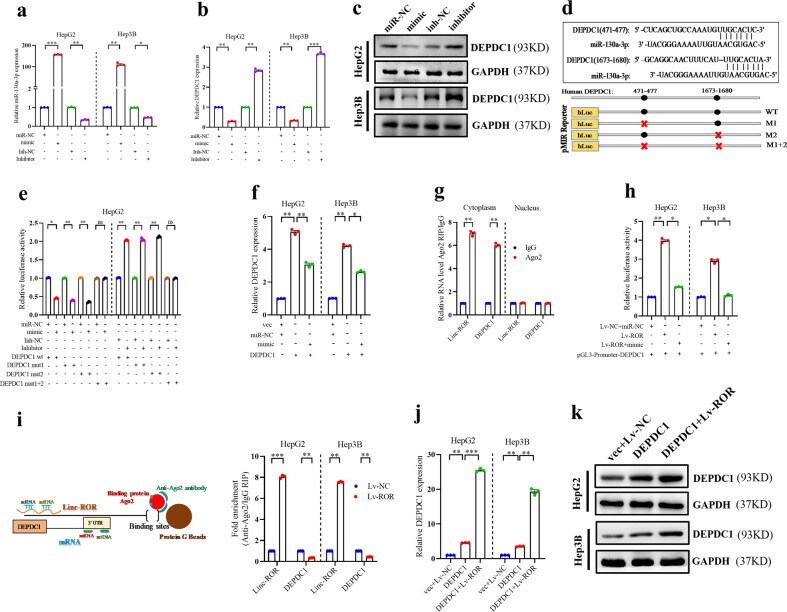
- Fig. 3 Linc-ROR act as ceRNAs. a The qRT-PCR assay revealed the overexpression and knockdown efficiency of miR-130a-3p in HepG2 and Hep3B cells. b , c The mRNA and protein levels of DEPDC1 in HepG2 and Hep3B cells after transfection with miR-130a-3p mimic or miR-130a-3p inhibitor. d The miR-130a-3p binding sequence in the DEPDC1 3' UTR and the generation of dual-luciferase reporter plasmids of wild-type (WT) or mutant (MUT) were shown. e Luciferase activity assays were performed in HepG2 cells co-transfected with DEPDC1 WT or DEPDC1 MUT and miR-130a-3p mimic or miR-130a-3p inhibitor. f The relative expressions of DEPDC1 were determined transfected with miR-130a-3p mimic or DEPDC1 by qRT-PCR. g RIP experiments revealed that Linc-ROR and DEPDC1 mRNA coexisted in the anti-Ago2 complex in the cell cytoplasm. IgG was used as the negative control. h Luciferase activity in HCC cells co-transfected with pGL3-promoter-DEPDC1 and ceRNAs. Data were presented as the relative ratio of renilla luciferase activity and firefly luciferase activity. i The schematic diagram and qRT-PCR results of the RIP based on Ago2 showed that Linc-ROR can compete with the DEPDC1 transcript for the binding of miRNAs. j , k The relative expression levels of DEPDC1 were determined by qRT-PCR and western blotting in HepG2 and Hep3B cells after co-transfecting ceRNAs. Data are shown as mean +- SD, n = 3. The data statistical significance is assessed by Student's t test. * P < 0.05, ** P < 0.01, *** P < 0.001.
- Submitted by
- Invitrogen Antibodies (provider)
- Main image
- Experimental details
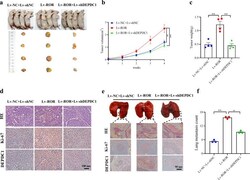
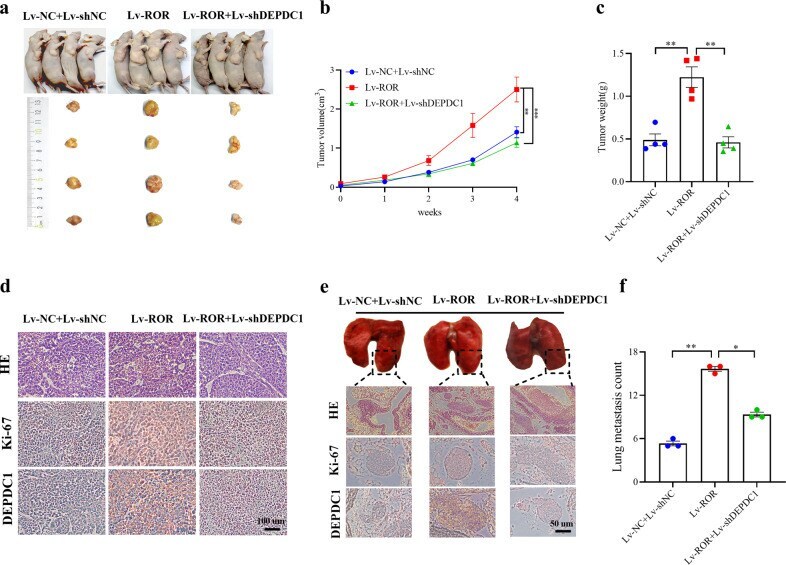
- Fig. 7 Carcinogenesis of Linc-ROR requires DEPDC1 in vivo. a - d Representative images, in vivo growth curve, HE, Ki-67 and DEPDC1 immunostaining, and weight at the end points of subcutaneous xenograft tumors formed by HepG2 cells stably transfected with Lv-NC + Lv-shNC, Lv-ROR or Lv-ROR + Lv-shDEPDC1 in nude mice ( n = 4 per group). Scale bar, 100 mum. e , f In vivo representative images, HE, Ki-67 and DEPDC1 immunostaining, and metastatic counts of lungs of nude mice ( n = 3 per group) treated with tail vein injection of HepG2 cells stably transfected with Lv-NC + Lv-shNC, Lv-ROR or Lv-ROR + Lv-shDEPDC1. Scale bar, 50 mum. g Linc-ROR promoted angiogenesis by the CAM angiogenesis analysis in HepG2 cells. Data are shown as mean +- SD, n = 3. The data statistical significance is assessed by Student's t test. * P < 0.05, ** P < 0.01, *** P < 0.001.
- Submitted by
- Invitrogen Antibodies (provider)
- Main image
- Experimental details
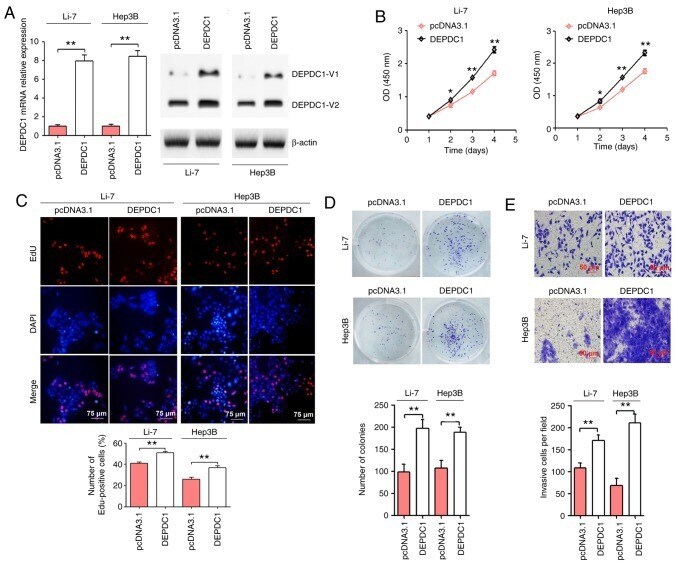
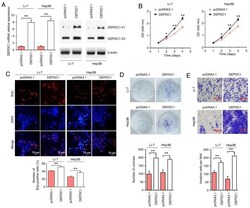
- Figure 2. DEPDC1 upregulation promotes HCC cell progression. (A) Li-7 and Hep3B cells were transfected with pcDNA3.1 control and pcDNA3.1 DEPDC1 expression vectors. After transfection for 72 h, DEPDC1 mRNA and protein expression was confirmed via reverse RT-qPCR and western blotting, respectively. Li-7 and Hep3B cells were transfected as described above. Cell growth was evaluated via (B) Cell Counting Kit-8, (C) EdU and (D) colony formation assays. Scale bar, 75 um. (E) Cell invasion was determined by performing a Transwell assay. Scale bar, 50 um. *P