Explore
 Validate
 Learn
Learn Western blot
 Immunohistochemistry
Antibody data
- Antibody Data
- Antigen structure
- References [1]
- Comments [0]
- Validations
- Immunohistochemistry [1]
- Other assay [1]
Submit
Validation data
Reference
Comment
Report error
- Product number
- PA5-97117 - Provider product page

- Provider
- Invitrogen Antibodies
- Product name
- Thrombospondin 2 Polyclonal Antibody
- Antibody type
- Polyclonal
- Antigen
- Recombinant full-length protein
- Description
- Sequence of this protein is as follows: MEGPRGWLVL CVLAISLASM VTEDLCRAPD GKKGEAGRPG RRGRPGLKGE QGEPGAPGIR TGIQGLKGDQ GEPGPSGNPG KVGYPGPSGP LGARGIPGIK GTKGSPGNIK DQPRPAFSAI RRNPPMGGNV VIFDTVITNQ EEPYQNHSGR FVCTVPGYYY FTFQVLSQWE ICLSIVSSSR GQVRRSLGFC DTTNKGLFQV VSGGMVLQLQ QGDQVWVEKD PKKGHIYQGS EADSVFSGFL IFPSA
- Reactivity
- Human, Mouse, Rat
- Host
- Rabbit
- Isotype
- IgG
- Vial size
- 100 µL
- Concentration
- 0.83 mg/mL
- Storage
- -20° C, Avoid Freeze/Thaw Cycles
Submitted references Coding transcriptome analyses reveal altered functions underlying immunotolerance of PEG-fused rat sciatic nerve allografts.
Smith TA, Ghergherehchi CL, Tucker HO, Bittner GD
Journal of neuroinflammation 2020 Oct 2;17(1):287
Journal of neuroinflammation 2020 Oct 2;17(1):287
No comments: Submit comment
Supportive validation
- Submitted by
- Invitrogen Antibodies (provider)
- Main image
- Experimental details
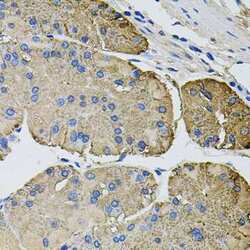
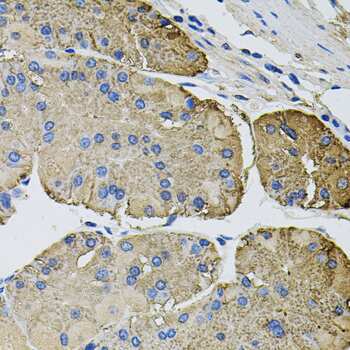
- Immunohistochemistry analysis of Thrombospondin 2 in paraffin-embedded human stomach using Thrombospondin 2 Polyclonal Antibody (Product # PA5-97117) at a dilution of 1:200.
Supportive validation
- Submitted by
- Invitrogen Antibodies (provider)
- Main image
- Experimental details
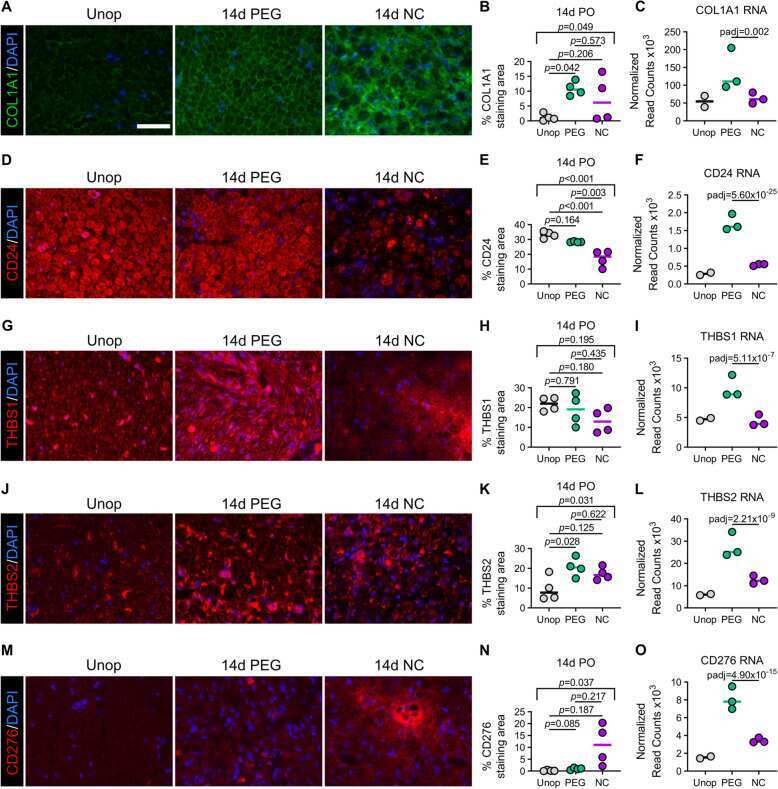
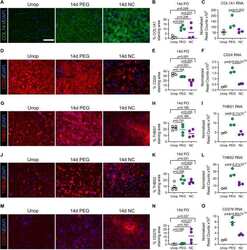
- Fig. 7 Immunohistochemical analyses of cell adhesion and extracellular matrix DEGs. a Fluorescence images showing cross-sections of unoperated control nerve, 14 days PO PEG-fused PNA, and 14 days PO NC PNA immunostained for COL1A1 (green). b Percent (%) COL1A1 staining area comparisons at 14 days PO ( n = 4 per treatment group). c Normalized read counts of COL1A1 RNA transcripts at 14 days PO. Fluorescence images showing immunostaining for CD24 (red) in cross-sections. d Fluorescence images showing immunostaining for CD24 (red). e Percent (%) CD24 staining area comparisons at 14 days PO ( n = 4 per treatment group). f Normalized read counts of CD24 RNA transcripts at 14 days PO. Fluorescence images showing immunostaining for CD24 (red) in cross-sections. g Fluorescence images showing immunostaining for THBS1 (red). h Percent (%) THBS1 staining area comparisons at 14 days PO ( n = 4 per treatment group). i Normalized read counts of THBS1 RNA transcripts at 14 days PO. j Fluorescence images showing immunostaining for THBS2 (red). k Percent (%) THBS2 staining area comparisons at 14 days PO ( n = 4 per treatment group). l Normalized read counts of THBS2 RNA transcripts at 14 days PO. m Fluorescence images showing immunostaining for CD276 (red). n Percent (%) CD276 staining area comparisons at 14 days PO ( n = 4 per treatment group). o Normalized read counts of CD276 RNA transcripts at 14 days PO. Nuclei are stained with DAPI (blue). Scale = 50 mum. In graphs, data are shown as me