Explore
 Validate
 Learn
Learn Western blot
 Flow cytometry
Antibody data
- Antibody Data
- Antigen structure
- References [1]
- Comments [0]
- Validations
- Flow cytometry [2]
- Other assay [1]
Submit
Validation data
Reference
Comment
Report error
- Product number
- MA1-20347 - Provider product page

- Provider
- Invitrogen Antibodies
- Product name
- CD254 (RANK Ligand) Monoclonal Antibody (12A380)
- Antibody type
- Monoclonal
- Antigen
- Other
- Description
- MA1-20347 detects sRANKL in Human and Mouse samples.
- Reactivity
- Human, Mouse
- Host
- Mouse
- Isotype
- IgG
- Antibody clone number
- 12A380
- Vial size
- 50 µg
- Concentration
- 1 mg/mL
- Storage
- Store at 4°C short term. For long term storage, store at -20°C, avoiding freeze/thaw cycles.
Submitted references Total body proton and heavy-ion irradiation causes cellular senescence and promotes pro-osteoclastogenic activity in mouse bone marrow.
Kumar K, Datta K, Fornace AJ Jr, Suman S
Heliyon 2022 Jan;8(1):e08691
Heliyon 2022 Jan;8(1):e08691
No comments: Submit comment
Supportive validation
- Submitted by
- Invitrogen Antibodies (provider)
- Main image
- Experimental details
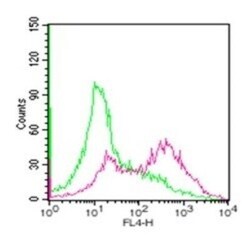
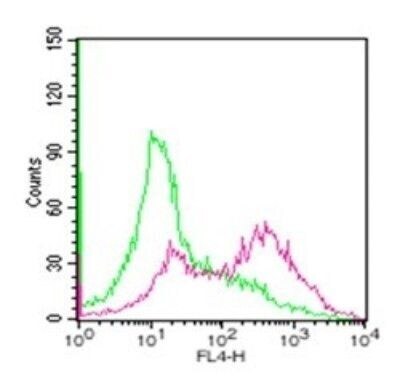
- Flow Cytometry analysis of IBA1 was performed in mouse splenocytes using 1 µg of IBA1 Monoclonal Antibody (GT10312) (Product # MA5-27726). Green : untreated mouse splenocytes, Red : 72 hour ConA-stimulated mouse splenocytes.
- Submitted by
- Invitrogen Antibodies (provider)
- Main image
- Experimental details
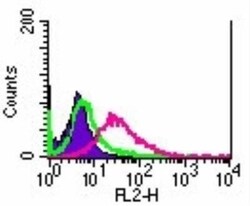
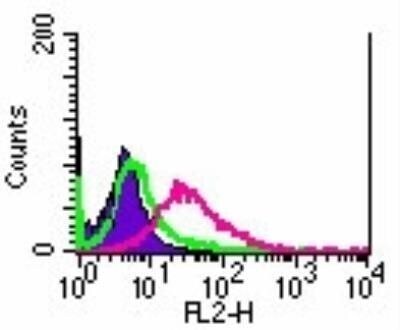
- Flow Cytometry analysis of SOX9 was performed in RAW264.7 using 2 µg of SOX9 Polyclonal Antibody (Product # PA5-85275) (Purple). Green : isotype control. Shaded histogram : cells only.
Supportive validation
- Submitted by
- Invitrogen Antibodies (provider)
- Main image

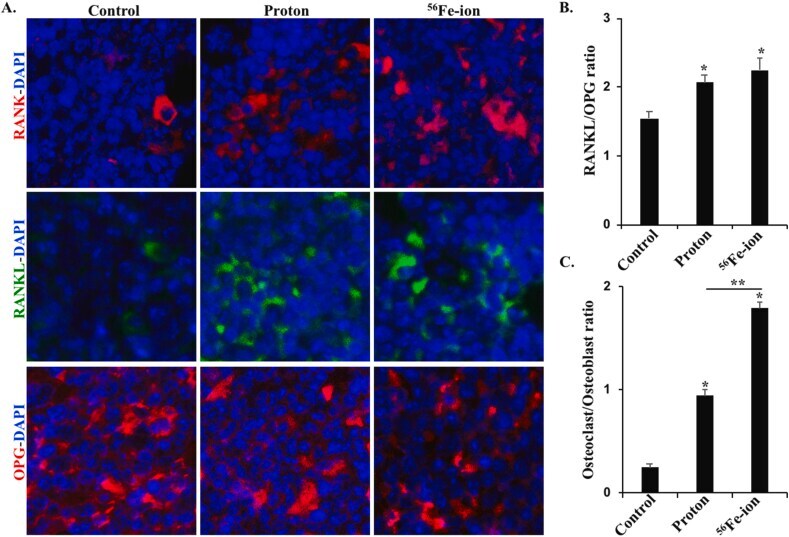
- Experimental details
- Figure 3 Analysis of osteoclastogenic markers in the bone marrow cells after proton and 56 Fe exposure. A) Representative immunofluorescence images (magnification 400x) depicting RANK (osteoclast marker), RANKL (osteoclastogenesis marker) and OPG (osteoblast marker) expressing cells. B) Quantification of RANKL/OPG ratio from immuno-stained sections. C) Quantification of osteoclast/osteoblast ratio from immuno-stained sections. Each bar represents mean +- SEM values from 10 to 12 HPF with n = 5 mice/group. * denotes p < 0.05 compared to the control group and ** denotes p < 0.05 between irradiated groups. Figure 3