Explore
 Validate
 Learn
LearnMA5-31715
antibody from Invitrogen Antibodies
Targeting: DDX58
DKFZp434J1111, FLJ13599, RIG-1, RIG-I, RIG1
 Western blot
 ELISA
ELISAAntibody data
- Antibody Data
- Antigen structure
- References [2]
- Comments [0]
- Validations
- ELISA [2]
- Immunocytochemistry [4]
- Flow cytometry [2]
- Other assay [1]
Submit
Validation data
Reference
Comment
Report error
- Product number
- MA5-31715 - Provider product page

- Provider
- Invitrogen Antibodies
- Product name
- RIG-I Monoclonal Antibody (4G1B6)
- Antibody type
- Monoclonal
- Antigen
- Purifed from natural sources
- Description
- MA5-31715 has been tested in indirect ELISA.
- Reactivity
- Human
- Host
- Mouse
- Isotype
- IgM
- Antibody clone number
- 4G1B6
- Vial size
- 100 μL
- Concentration
- 1 mg/mL
- Storage
- Store at 4°C short term. For long term storage, store at -20°C, avoiding freeze/thaw cycles.
Submitted references Complement Potentiates Immune Sensing of HIV-1 and Early Type I Interferon Responses.
Activation of NF-κB signaling via cytosolic mitochondrial RNA sensing in kerotocytes with mitochondrial DNA common deletion.
Posch W, Bermejo-Jambrina M, Steger M, Witting C, Diem G, Hörtnagl P, Hackl H, Lass-Flörl C, Huber LA, Geijtenbeek TBH, Wilflingseder D
mBio 2021 Oct 26;12(5):e0240821
mBio 2021 Oct 26;12(5):e0240821
Activation of NF-κB signaling via cytosolic mitochondrial RNA sensing in kerotocytes with mitochondrial DNA common deletion.
Zhou X, Backman LJ, Danielson P
Scientific reports 2021 Apr 1;11(1):7360
Scientific reports 2021 Apr 1;11(1):7360
No comments: Submit comment
Supportive validation
- Submitted by
- Invitrogen Antibodies (provider)
- Main image
- Experimental details
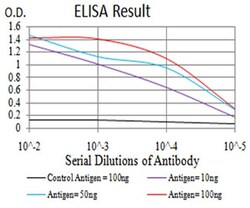
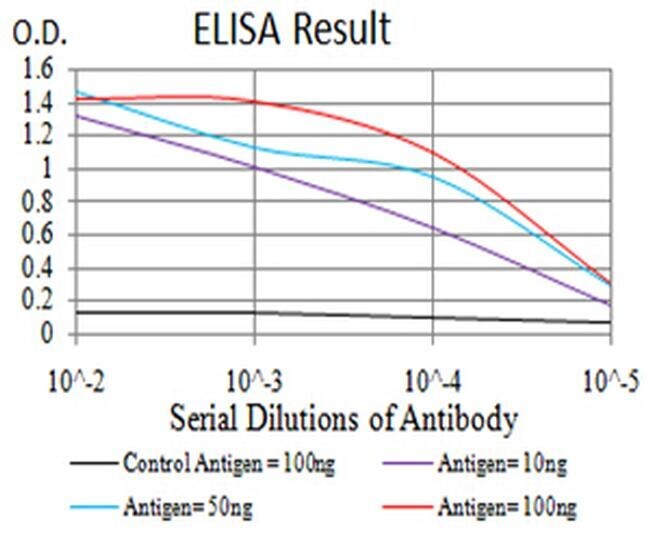
- ELISA analysis of RIG-I in Control Antigen (black line, 100 ng); Antigen (purple line, 10 ng); Antigen (blue line, 50 ng); Antigen (red line, 100 ng). Samples were incubated with RIG-I monoclonal antibody (Product # MA5-31715) using a dilution of 1:10,000.

- Submitted by
- Invitrogen Antibodies (provider)
- Main image

- Experimental details
- ELISA analysis of RIG-I in Control Antigen (black line, 100 ng); Antigen (purple line, 10 ng); Antigen (blue line, 50 ng); Antigen (red line, 100 ng). Samples were incubated with RIG-I monoclonal antibody (Product # MA5-31715) using a dilution of 1:10,000.
Supportive validation
- Submitted by
- Invitrogen Antibodies (provider)
- Main image
- Experimental details
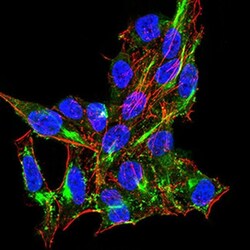
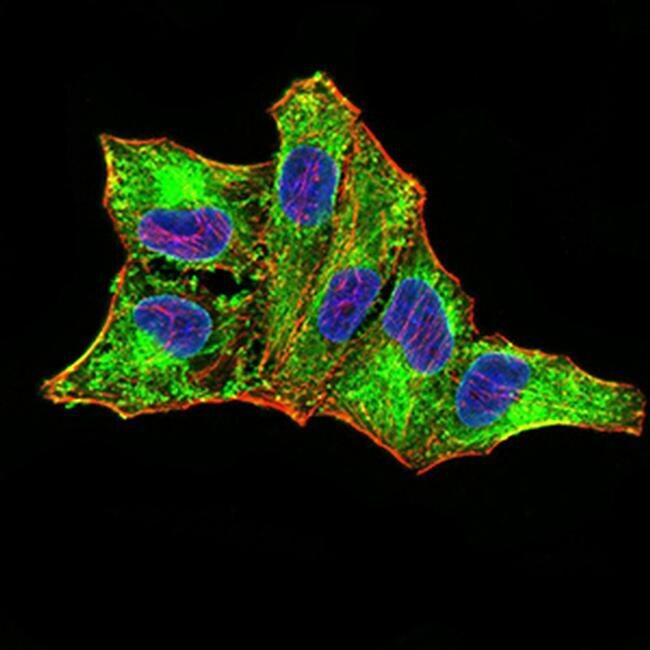
- Immunocytochemistry analysis of RIG-I in Hela cells (green). Sample was incubated with RIG-I monoclonal antibody (Product # MA5-31715) using a dilution of 1:200-1:1000 followed by DRAQ5 fluorescent DNA dye (blue), and Alexa Fluor- 555 phalloidin (red labeled actin filaments) .

- Submitted by
- Invitrogen Antibodies (provider)
- Main image

- Experimental details
- Immunocytochemistry analysis of RIG-I in MCF-7 cells (green). Sample was incubated with RIG-I monoclonal antibody (Product # MA5-31715) using a dilution of 1:200-1:1000 followed by DRAQ5 fluorescent DNA dye (blue), and Alexa Fluor- 555 phalloidin (red labeled actin filaments) .
- Submitted by
- Invitrogen Antibodies (provider)
- Main image

- Experimental details
- Immunocytochemistry analysis of RIG-I in Hela cells (green). Sample was incubated with RIG-I monoclonal antibody (Product # MA5-31715) using a dilution of 1:200-1:1000 followed by DRAQ5 fluorescent DNA dye (blue), and Alexa Fluor- 555 phalloidin (red labeled actin filaments) .

- Submitted by
- Invitrogen Antibodies (provider)
- Main image

- Experimental details
- Immunocytochemistry analysis of RIG-I in MCF-7 cells (green). Sample was incubated with RIG-I monoclonal antibody (Product # MA5-31715) using a dilution of 1:200-1:1000 followed by DRAQ5 fluorescent DNA dye (blue), and Alexa Fluor- 555 phalloidin (red labeled actin filaments) .

Supportive validation
- Submitted by
- Invitrogen Antibodies (provider)
- Main image
- Experimental details
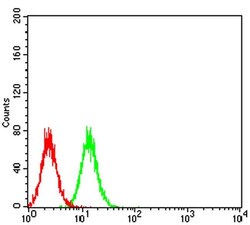
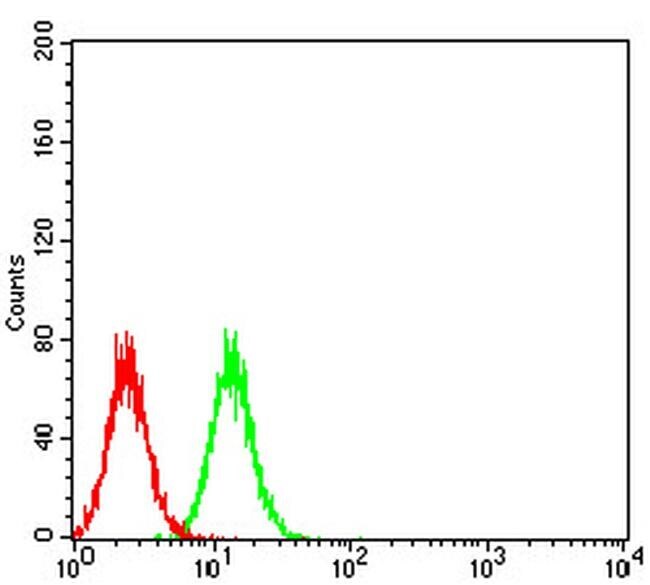
- Flow cytometry of RIG-I in HeLa cells (green). Sample was incubated with RIG-I monoclonal antibody (Product # MA5-31715) using a dilution of 1:200-1:400 followed by negative control (red).
- Submitted by
- Invitrogen Antibodies (provider)
- Main image

- Experimental details
- Flow cytometry of RIG-I in HeLa cells (green). Sample was incubated with RIG-I monoclonal antibody (Product # MA5-31715) using a dilution of 1:200-1:400 followed by negative control (red).

Supportive validation
- Submitted by
- Invitrogen Antibodies (provider)
- Main image
- Experimental details
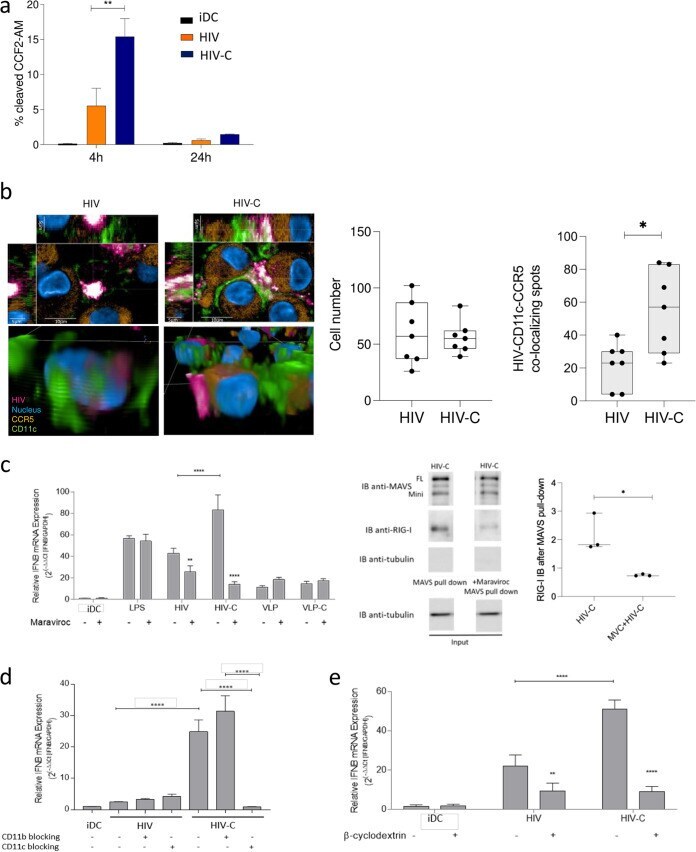
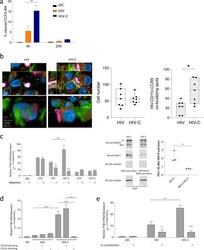
- FIG 5 CR4 and CCR5 act in concert via rafts to enhance early type I IFN responses in HIV-C-exposed DCs. (a) BlaM-Vpr analyses of HIV and HIV-C in moDCs after 4 h and 24 h infection. Noninfected DCs served as controls. Data are means and SD from four independent experiments using cells from different donors. Unpaired Student's t test was used to characterize differences between HIV and HIV-C (**, P < 0.01). (b) (Left) Representative confocal microscopic analyses (top, xyz stack; bottom, 3D analysis) of HIV (pink), CD11c (green), CCR5 (orange), and nucleus (blue) in DCs infected 1 h with HIV or HIV-C-mCherry. (Right) Quantitative analyses of DC numbers (white plots) and numbers of HIV-CD11c-CCR5 colocalizing spots (gray plots) are illustrated. For each condition, at least 350 cells were analyzed, and data were generated using the RMS spot analysis of Harmony software (Perkin Elmer). (c) (Left) RT-PCR analyses of type I IFN (IFN-beta) levels after blocking CCR5 using maraviroc in LPS-, HIV-, HIV-C, VLP- or VLP-C-exposed moDCs. Data are means and SD for analyses of cells from 4 donors, done in duplicate. In HIV-C-exposed DCs, type I IFN levels were highly significantly down-modulated upon CCR5 blocking (**, P < 0.01; ****, P < 0.0001), and this too was associated with a reduced RIG-I signal (middle and right) after IP (MAVS pulldown) and IB using MAVS and RIG-I Abs. Tubulin was used as loading control. A representative IB after IP (middle) and the quantification of the RIG-I sign