Explore
 Validate
 Learn
Learn Western blot
 Immunocytochemistry
Antibody data
- Antibody Data
- Antigen structure
- References [1]
- Comments [0]
- Validations
- Immunocytochemistry [4]
- Other assay [2]
Submit
Validation data
Reference
Comment
Report error
- Product number
- PA5-12142 - Provider product page

- Provider
- Invitrogen Antibodies
- Product name
- AGL Polyclonal Antibody
- Antibody type
- Polyclonal
- Antigen
- Synthetic peptide
- Reactivity
- Human
- Host
- Rabbit
- Isotype
- IgG
- Vial size
- 400 μL
- Storage
- Store at 4°C short term. For long term storage, store at -20°C, avoiding freeze/thaw cycles.
Submitted references Intracellular calcium leak lowers glucose storage in human muscle, promoting hyperglycemia and diabetes.
Tammineni ER, Kraeva N, Figueroa L, Manno C, Ibarra CA, Klip A, Riazi S, Rios E
eLife 2020 May 4;9
eLife 2020 May 4;9
No comments: Submit comment
Supportive validation
- Submitted by
- Invitrogen Antibodies (provider)
- Main image

- Experimental details
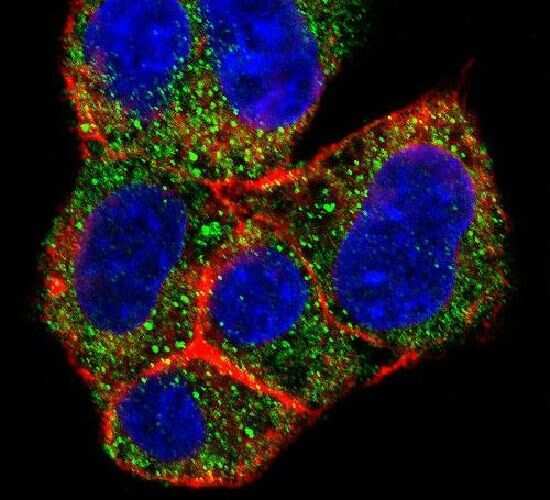
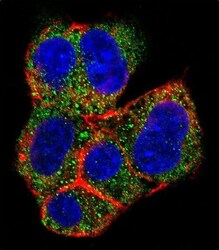
- Immunofluorescent analysis of HepG2 cells using an AGL polyclonal antibody (Product # PA5-12142) at a dilution of 1:10-50, followed by a fluor-conjugated goat anti-rabbit secondary antibody (green). Actin filaments were stained with dye-conjugated phalloidin (red). Nuclei were stained with DAPI (blue).
- Submitted by
- Invitrogen Antibodies (provider)
- Main image
- Experimental details
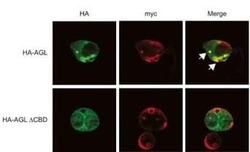
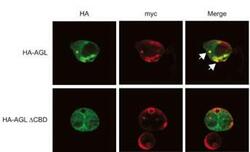
- Immunofluorescent analysis of HepG2 cells transfected with either HA-tagged or wild-type AGL using an AGL polyclonal antibody (Product # PA5-12142) at a 1:25 dilution. Cells were fixed in formalin and processed for IF using a HA (green) and anti-myc (red) antibodies. White arrows indicate colocalization of HA-AGL and myc-GS.

- Submitted by
- Invitrogen Antibodies (provider)
- Main image
- Experimental details
- Immunocytochemistry analysis of AGL in HepG2 cells. Samples were incubated in AGL polyclonal antibody (Product # PA5-12142) followed by Alexa Fluor 488-conjugated goat anti-rabbit lgG (green). Actin filaments have been labeled with Alexa Fluor 555 phalloidin (red). DAPI was used to stain the cell nuclear (blue).

- Submitted by
- Invitrogen Antibodies (provider)
- Main image
- Experimental details
- Immunocytochemistry analysis of AGL in HepG2 cells. Samples were incubated with AGL polyclonal antibody (Product # PA5-12142). Expression of myc-GS causes wild type but not the CBD mutant of AGL to aggregate around the PAS-stain-positive inclusions. Cells were transfected with either HA-tagged wild-type AGL (HA-AGL) or HA-AGL CBD. Cells were fixed in formalin and processed for IF using anti-HA (green) and anti-myc (red) antibodies. White arrows indicate colocalization of HA-AGL and myc-GS.

Supportive validation
- Submitted by
- Invitrogen Antibodies (provider)
- Main image
- Experimental details
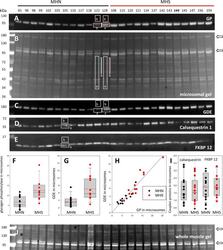
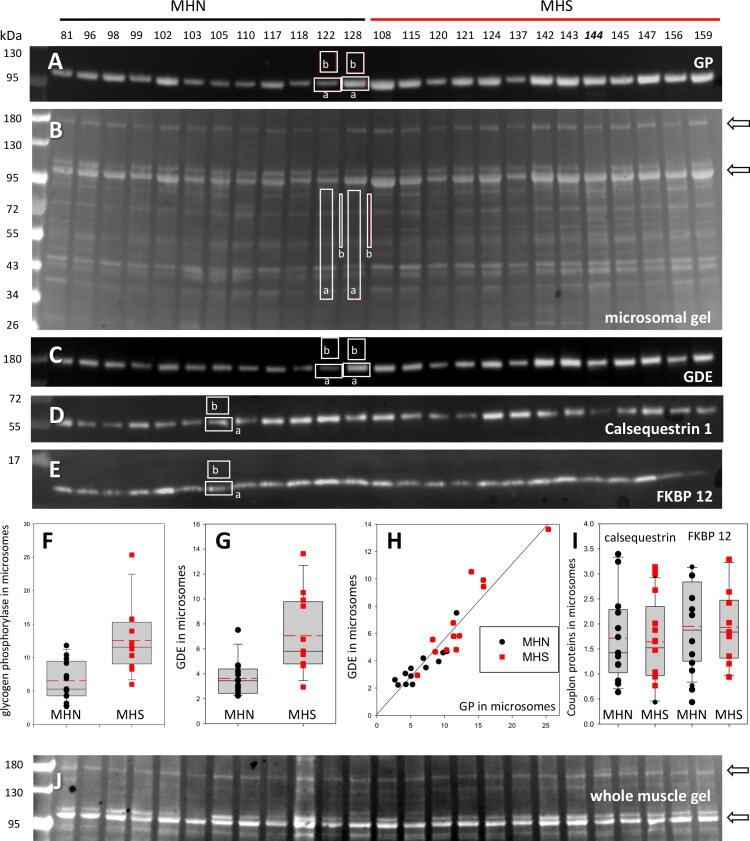
- Figure 2. Protein content in patients' microsomes. ( A ) Western blot analysis of glycogen phosphorylase (GP) for 25 subjects, in a luminescence scale with black as 0 and white as saturating value. The numbers above each lane are patient identifiers that apply to all 25-lane gels shown in the article. The twelve lanes under the black bar have protein from MHN patients; those under the red bar are from MHS patients, except #144, which was reclassified as MHN. ( B ) Ponceau-stained gel that originated all blots in the figure. A and B illustrate our custom quantitative analysis. The content of every protein quantified in blots was calculated as the signal mass within region a above background (average level in b). Content was normalized for quantity of preparation in the lane dividing by the signal similarly calculated in the gel in B. The signal in B is computed in a large area of the lane to average multiple proteins in the fraction. The method is fully demonstrated in Video 1 . Arrows in B mark two bands, near 100 and 180 kDa, with a visibly greater signal in the MHS group. Their main components were GP and glycogen debranching enzyme (GDE) respectively. ( C-E ) Western blots of GDE, calsequestrin 1 and FKBP12 in different sections of gel B (identified by molecular weight markers at left). ( F and G ) Box plots of GP and GDE content. In both cases the content was greater on average for MHS and the differences significant (data in Table 1 ). ( H ) GP vs. GDE in blots A and C;
- Submitted by
- Invitrogen Antibodies (provider)
- Main image
- Experimental details
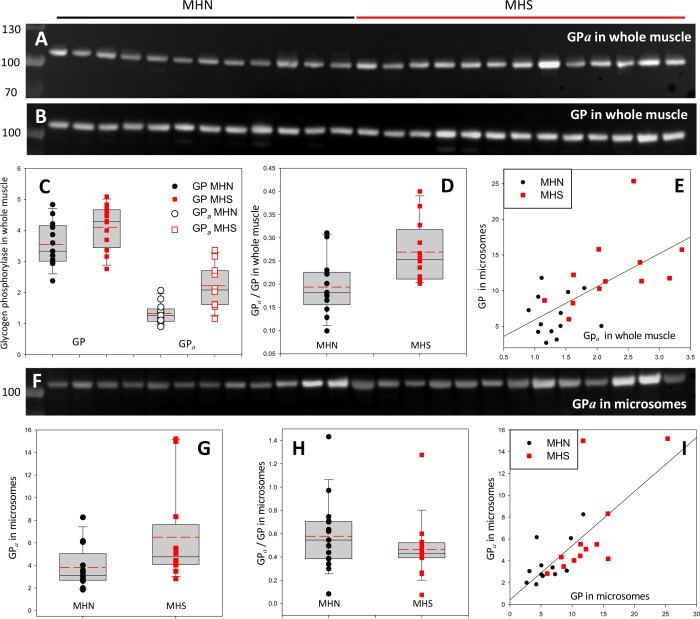
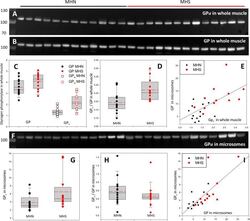
- Figure 3. Phosphorylation of glycogen phosphorylase. ( A, B ) Western blots of 13 MHN and 12 MHS whole tissue lysates, identified in Figure 2 . Blots were derived from different gels loaded with aliquots of the same preparations. Originating gels for this blot and others are in Figure 3--figure supplement 1 . ( C ) The distribution of band signals in blots A and B. Statistical measures are listed in Table 1 . GP ( all-forms ) and GP a were higher in the MHS (p=0.07 for GP and 3 10 -4 for GP a ). ( D ) The median content ratio GP a /GP was 42% higher in the MHS (p = 0.005). ( E ) Cross-plot demonstrating correlation between GP a content in whole muscle and GP in microsomes ( r = 0.64, p = 5 10 -4 ). ( F ) Western blot of GP a in the microsomal fractions studied in Figure 2 . ( G, H ) Distributions of GP a in blot F and of the content ratio GP a /GP (the all-forms GP content was determined with blot A of Figure 2 ). GP a was higher by 71% (p = 0.05) but the phosphorylation ratio did not change significantly in the microsomal fraction (p = 0.28). ( I ) GP a vs. GP in microsomes. The correlation is high and highly significant ( r = 0.72, p < 10 -4 .). Figure 3--figure supplement 1. Protein gels for blots. ( A, B ) Ponceau-stained whole tissue extract gels used to derive Western blots of PhK, GPa and GDE ( A ) and all-forms GP ( B ). C-F. Ponceau-stained microsomal extract gels used to derive Western blots of GS ( C ), GSa ( D ), GDE ( E ) and GLUT4 and Casq1 ( F ). The signal in