Explore
 Validate
 Learn
Learn Western blot
 Immunohistochemistry
Antibody data
- Antibody Data
- Antigen structure
- References [1]
- Comments [0]
- Validations
- Immunohistochemistry [4]
- Other assay [2]
Submit
Validation data
Reference
Comment
Report error
- Product number
- PA5-55866 - Provider product page

- Provider
- Invitrogen Antibodies
- Product name
- HENMT1 Polyclonal Antibody
- Antibody type
- Polyclonal
- Antigen
- Recombinant protein fragment
- Description
- Immunogen sequence: MEENNLQCSS VVDGNFEEVP RETAIQFKPP LYRQRYQFVK NLVDQHEPKK VADLGCGDTS LLRLLKVNPC IELLVGV Highest antigen sequence identity to the following orthologs: Mouse - 68%, Rat - 47%.
- Reactivity
- Human
- Host
- Rabbit
- Isotype
- IgG
- Vial size
- 100 μL
- Concentration
- 0.1 mg/mL
- Storage
- Store at 4°C short term. For long term storage, store at -20°C, avoiding freeze/thaw cycles.
Submitted references Integrative analyses of the RNA modification machinery reveal tissue- and cancer-specific signatures.
Begik O, Lucas MC, Liu H, Ramirez JM, Mattick JS, Novoa EM
Genome biology 2020 May 7;21(1):97
Genome biology 2020 May 7;21(1):97
No comments: Submit comment
Supportive validation
- Submitted by
- Invitrogen Antibodies (provider)
- Main image
- Experimental details
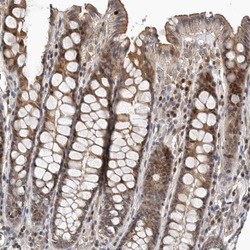
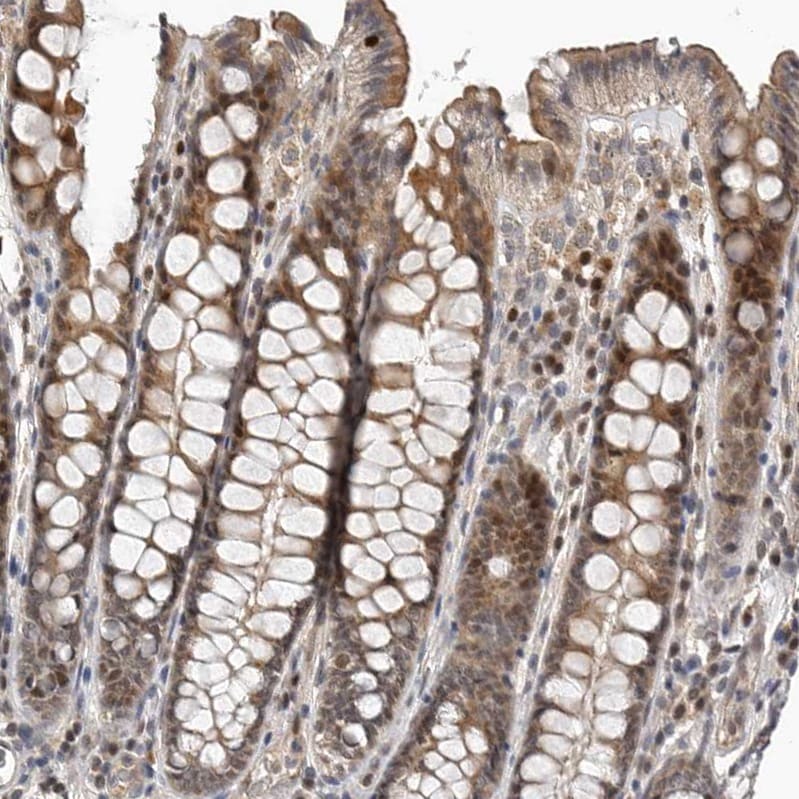
- Immunohistochemical staining of HENMT1 in colon using HENMT1 Polyclonal Antibody (Product # PA5-55866) shows moderate positivity in glandular cells.
- Submitted by
- Invitrogen Antibodies (provider)
- Main image
- Experimental details
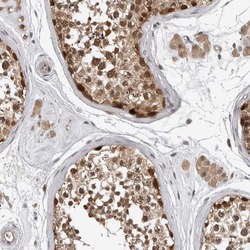
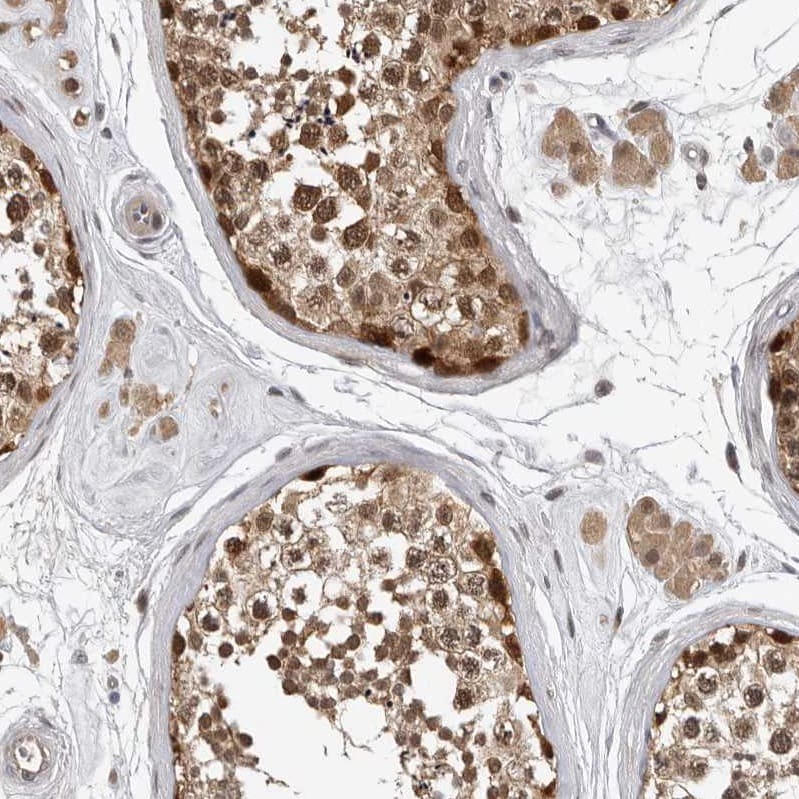
- Immunohistochemical staining of HENMT1 in human testis using HENMT1 Polyclonal Antibody (Product # PA5-55866) shows moderate to strong nuclear and cytoplasmic positivity in cells in seminiferous ducts.
- Submitted by
- Invitrogen Antibodies (provider)
- Main image
- Experimental details
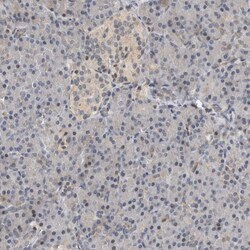
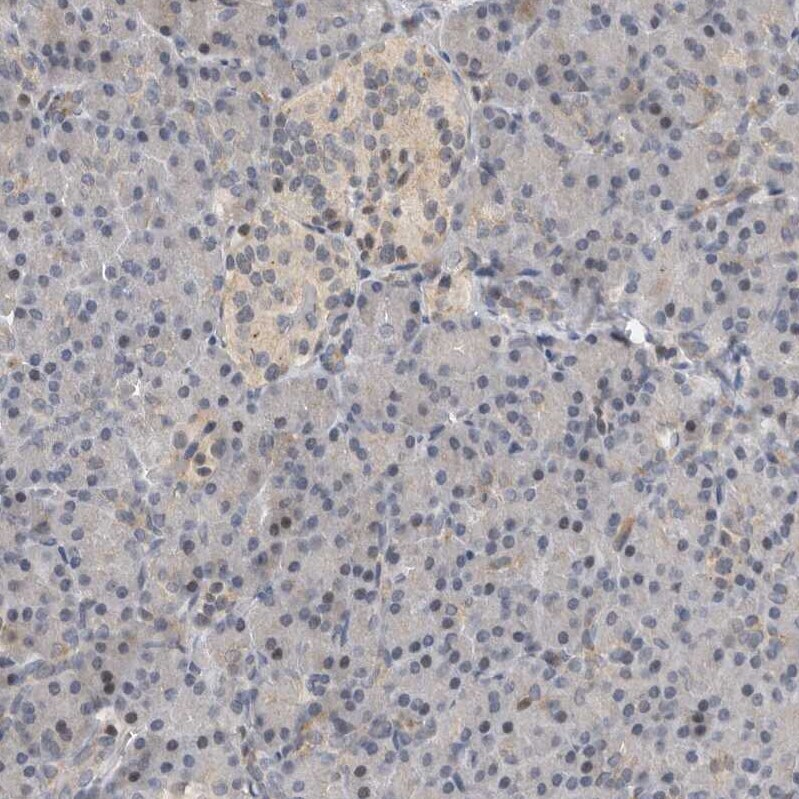
- Immunohistochemical staining of HENMT1 in human pancreas using HENMT1 Polyclonal Antibody (Product # PA5-55866) shows low positivity in exocrine and endocrine glandular cells.
- Submitted by
- Invitrogen Antibodies (provider)
- Main image
- Experimental details
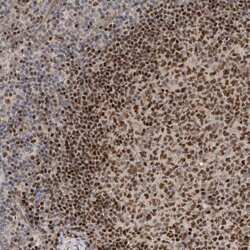
- Immunohistochemical staining of HENMT1 in human lymph node using HENMT1 Polyclonal Antibody (Product # PA5-55866) shows strong nuclear positivity in germinal center cells.

Supportive validation
- Submitted by
- Invitrogen Antibodies (provider)
- Main image
- Experimental details
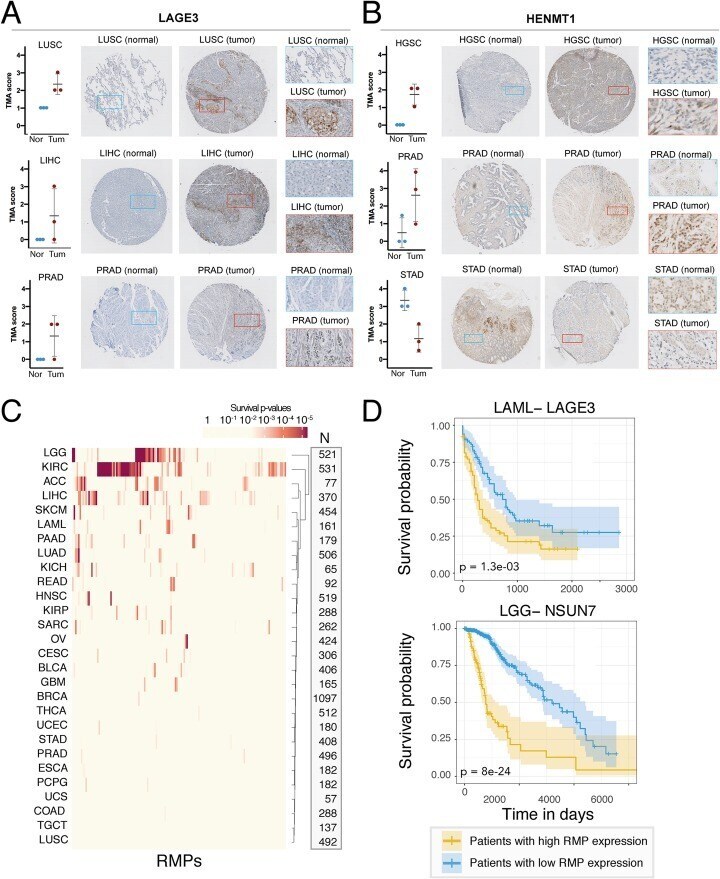
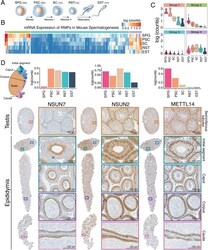
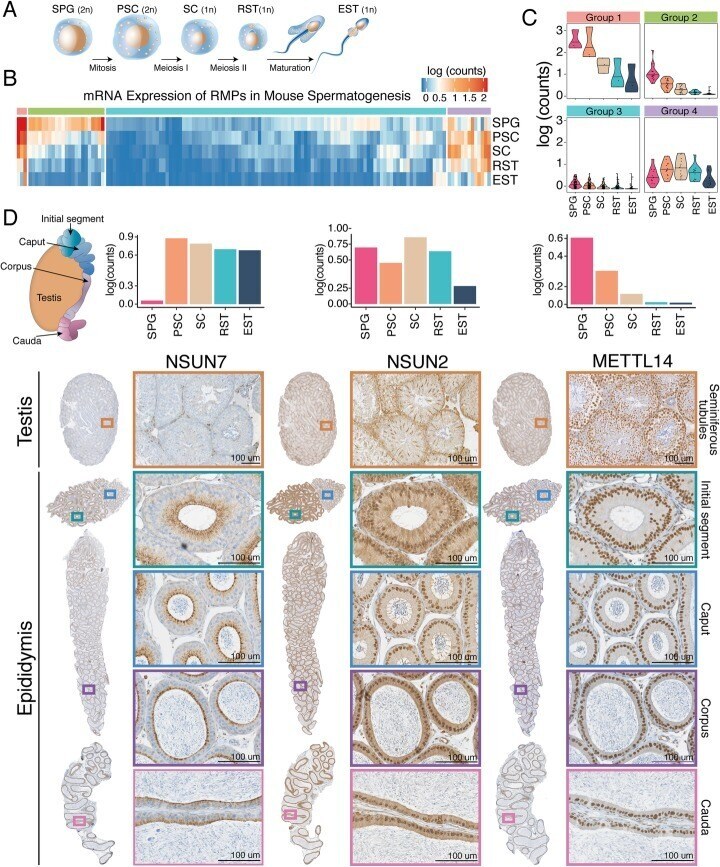
- Fig. 3 Analysis of RMP gene expression during spermatogenesis. a Schematic representation of the four main phases of spermatogenesis: (i) mitotic division of spermatogonia (SPG) into primary spermatocytes (PSC), (ii) meiotic division of PSCs into secondary spermatocytes (SC), (iii) meiotic division SCs into round spermatids (RST), and (iv) spermiogenesis, in which round spermatids (RST) mature into elongated spermatids (EST). b Heatmap of RMP expression levels in mouse testis. RMPs were clustered into 4 groups based on k-means analysis of their normalized average mRNA expression values. c Violin plots of the expression patterns of each of the 4 identified clusters. d RNA median expression barplot and immunohistochemistry of NSUN7, NSUN2, and METTL14, depicting distinct protein expression levels along the different sections of the testis and epididymis, as well as different subcellular localizations. Brown color indicates a specific staining of the antibody whereas blue represents hematoxylin counterstain
- Submitted by
- Invitrogen Antibodies (provider)
- Main image
- Experimental details
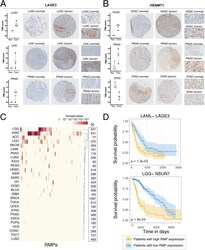
- Fig. 5 Immunohistochemical analysis and prognostic value of RMP expression levels in different cancer types. a , b Immunohistochemical analysis and images of normal and tumor LAGE-3 stained LUSC (lung squamous cell carcinoma), LIHC (liver hepatocellular carcinoma), and PRAD (prostate adenocarcinoma) ( a ) and HENMT-1 stained HGSC (High-grade serous carcinoma), LUSC, and STAD (stomach adenocarcinoma) TMAs ( b ). Representative cores and subsets are shown for each tissue and antibody, where the brown color indicates a specific staining of the antibody and blue represents the hematoxylin counterstain. Mean TMA score is plotted for each core, with three cores from different individuals per condition quantified. Two-sided Wilcoxon tests did not yield significant differences in any comparison, p values of all tumor-normal comparisons for each cancer type and antibody are shown in Figure S13. c Heatmap of survival p values of 146 RMPs across 28 cancer types. Survival p values are calculated by comparing the prognosis of patients that express high (upper 50%) versus low (lower 50%) RMP levels. ""N"" column shows the number of patients included for the analysis of each cancer type. d Individual examples of survival plots where the expression levels of the RMP are predictive of cancer prognosis. p values have been calculated by comparing the survival between patients expressing high levels (yellow, top 50%) versus low expression levels (blue, bottom 50%)