 Explore
 Validate
 Learn
Learn Immunohistochemistry
Antibody data
- Antibody Data
- Antigen structure
- References [1]
- Comments [0]
- Validations
- Immunohistochemistry [2]
- Other assay [2]
Submit
Validation data
Reference
Comment
Report error
- Product number
- PA5-67612 - Provider product page

- Provider
- Invitrogen Antibodies
- Product name
- ECT2 Polyclonal Antibody
- Antibody type
- Polyclonal
- Antigen
- Synthetic peptide
- Description
- Predicted to react with Mouse samples.
- Reactivity
- Human, Mouse
- Host
- Rabbit
- Isotype
- IgG
- Vial size
- 100 μL
- Concentration
- 0.5 mg/mL
- Storage
- -20°C
Submitted references ECT2 overexpression promotes the polarization of tumor-associated macrophages in hepatocellular carcinoma via the ECT2/PLK1/PTEN pathway.
Xu D, Wang Y, Wu J, Zhang Z, Chen J, Xie M, Tang R, Chen C, Chen L, Lin S, Luo X, Zheng J
Cell death & disease 2021 Feb 8;12(2):162
Cell death & disease 2021 Feb 8;12(2):162
No comments: Submit comment
Supportive validation
- Submitted by
- Invitrogen Antibodies (provider)
- Main image
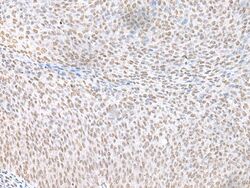
- Experimental details
- Immunohistochemical analysis of ECT2 in paraffin-embedded Human cervical cancer tissue using (left) ECT2 Polyclonal Antibody (Product # PA5-67612) at a 1:20 dilution and (right) is treated with synthetic peptide. (Original magnification: x200).
- Submitted by
- Invitrogen Antibodies (provider)
- Main image
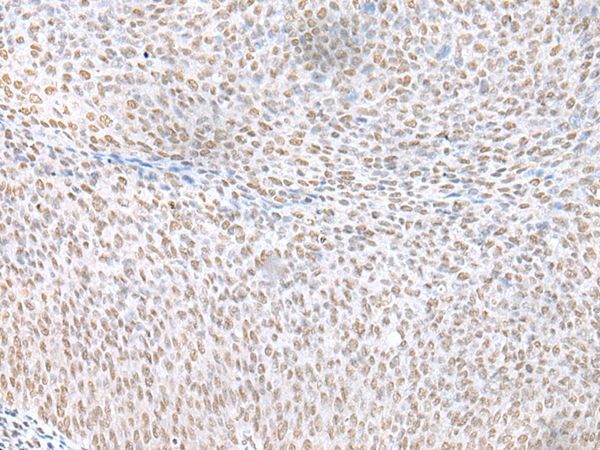
- Experimental details
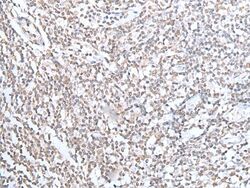
- Immunohistochemical analysis of ECT2 in paraffin-embedded Human tonsil tissue using (left) ECT2 Polyclonal Antibody (Product # PA5-67612) at a 1:20 dilution and (right) is treated with synthetic peptide. (Original magnification: x200).

Supportive validation
- Submitted by
- Invitrogen Antibodies (provider)
- Main image

- Experimental details
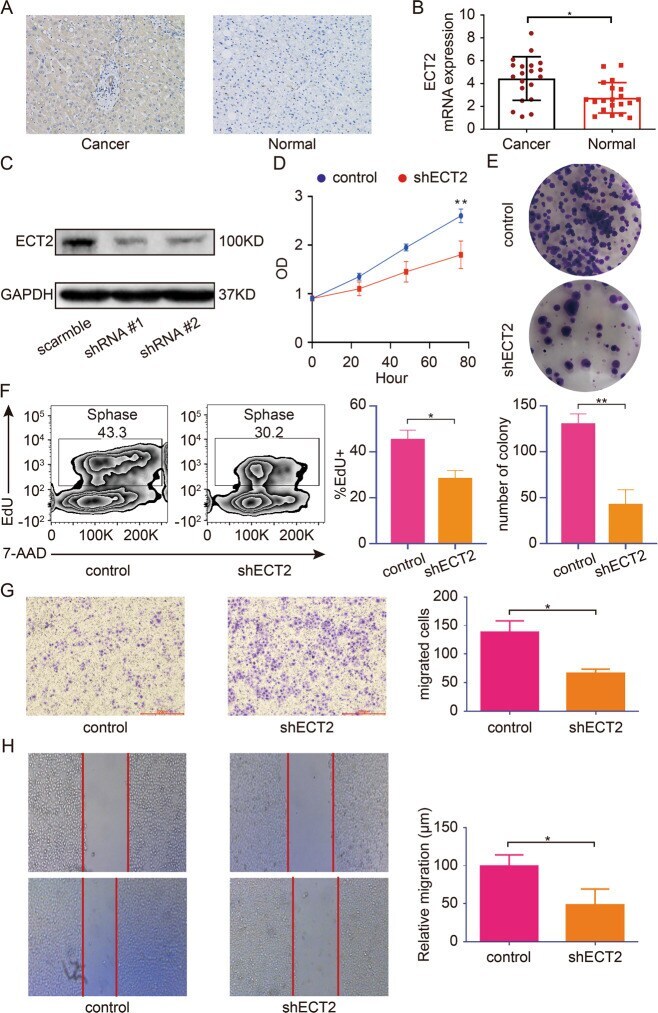
- Fig. 3 Downregulation of ECT2 inhibits the proliferation and migration of HCC cells. A Representative immunohistochemistry stain of ECT2 in HCC and para-cancerous normal tissues. B Quantification of PCR analysis of ECT2 expression in HCC and para-cancerous normal tissues. C Western blot analysis of ECT2 after transfection of ECT2-targeting shRNA. D ECT2 downregulation inhibits cell proliferation. Cancer cells were transfected with ECT2-targeting shRNA, and the absorption (A450 nm) was detected at 0, 24, 48, and 72 h. E Cancer cells transfected with ECT2-targeting shRNA and the normal control were assayed for clonogenicity in adherent cultures. F EdU incorporation assay was used to examine the proliferation of cancer cells after ECT2 knockdown. G Transwell assay was used for cancer cells transfected with ECT2-targeting shRNA (magnification 100x). H Wound-healing assay was used for cancer cells transfected with ECT2-targeting shRNA (magnification 50x, scale bar: 500 mum). Error bars represent means +- SD. * p < 0.05, ** p < 0.01. NS means ""not significant"" by paired two-sided Student's t -test.
- Submitted by
- Invitrogen Antibodies (provider)
- Main image
- Experimental details
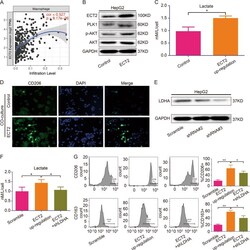
- Fig. 6 ECT2 overexpression increases the production of lactic acid and subsequently promotes M2 macrophage polarization. A Correlation analysis between ECT2 and macrophages. B Western blot analysis of p-AKT, PLK1, and AKT expression levels after ECT2 was overexpressed in the HepG2 cell line. C Lactate acid production by cancer cells was evaluated after ECT2 was overexpressed. D Immunofluorescence analysis of macrophage polarization markers. E Western blot analysis was used to evaluate the effect of LDHA knockdown. F Lactate acid production by cancer cells was evaluated after ECT2 was overexpressed and/or LDHA was knocked down. G CD206 and CD163, which are polarization markers, were evaluated by flow cytometry after macrophages were co-cultured with cancer cells whose LDHA and/or ECT2 expression was influenced. Error bars represent means +- SD. * p < 0.05, ** p < 0.01. NS means ""not significant"" by paired two-sided Student's t -test.
