Explore
 Validate
 Learn
Learn Western blot
 Immunoprecipitation
Antibody data
- Antibody Data
- Antigen structure
- References [1]
- Comments [0]
- Validations
- Western blot [3]
- Flow cytometry [1]
- Other assay [3]
Submit
Validation data
Reference
Comment
Report error
- Product number
- PA5-77618 - Provider product page

- Provider
- Invitrogen Antibodies
- Product name
- KV1.3 (KCNA3) (extracellular) Polyclonal Antibody
- Antibody type
- Polyclonal
- Antigen
- Synthetic peptide
- Description
- For reconstitution, we recommend adding 100 µL distilled water to a final antibody concentration of about 1 mg/mL. To use this carrier-free antibody for conjugation experiments, we strongly recommend performing another round of desalting. (Zeba Spin Desalting Columns, 7KMWCO, 0.5 mL, Product # 89882)
- Reactivity
- Human, Mouse, Rat
- Host
- Rabbit
- Isotype
- IgG
- Vial size
- 50 µL
- Concentration
- 0.8 mg/mL
- Storage
- -20°C
Submitted references IL-17 Inhibits Oligodendrocyte Progenitor Cell Proliferation and Differentiation by Increasing K(+) Channel Kv1.3.
Liu H, Yang X, Yang J, Yuan Y, Wang Y, Zhang R, Xiong H, Xu Y
Frontiers in cellular neuroscience 2021;15:679413
Frontiers in cellular neuroscience 2021;15:679413
No comments: Submit comment
Supportive validation
- Submitted by
- Invitrogen Antibodies (provider)
- Main image

- Experimental details
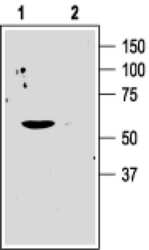
- Western blot analysisof human Jurkat T cells with KV1.3 (KCNA3) (extracellular) polyclonal antibody (Product # PA5-77618) using a dilution of 1:200.

- Submitted by
- Invitrogen Antibodies (provider)
- Main image
- Experimental details
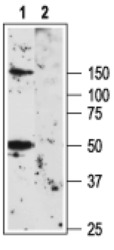
- Western blot analysis of human Jurkat T cells with KV1.3 (KCNA3) (extracellular) polyclonal antibody (Product # PA5-77618) using a dilution of 1:200.

- Submitted by
- Invitrogen Antibodies (provider)
- Main image
- Experimental details
- Western blot analysis of human Jurkat T cells with KV1.3 (KCNA3) (extracellular) polyclonal antibody (Product # PA5-77618) using a dilution of 1:200.

Supportive validation
- Submitted by
- Invitrogen Antibodies (provider)
- Main image
- Experimental details
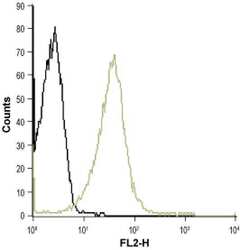
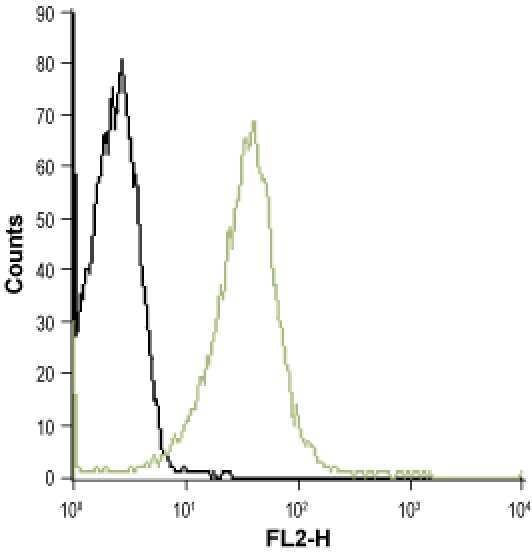
- Flow cytometry analysis of Jurkat cells using polyclonal KV1.3 (KCNA3) (extracellular) antibody (Product # PA5-77618) with a dilution of 1:25 followed by a goat-anti-rabbit-PE secondary antibody.
Supportive validation
- Submitted by
- Invitrogen Antibodies (provider)
- Main image
- Experimental details
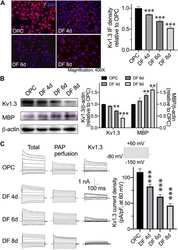
- FIGURE 1 Expression of Kv1.3 in OPCs/Ols during development. OPCs were cultured in OPCDM to differentiate into mature Ols. OPCs were transferred into OPCDM for 4 days (DF 4d), 6 days (DF 6d), and 8 days (DF 8d). (A) Representative images of Kv1.3 immunofluorescence staining (red) in cultures. Intact cell nuclei were visualized with DAPI (blue). The immunofluorescence density of Kv1.3 was summarized in a bar graph at the right. With the maturity of OPCs, Kv1.3 decreased in a development-dependent manner. (B) Western blot analysis of MBP expression in cells collected from different periods of OPCs/Ols. Band densitometry data are shown in the bar graph (right). Data are normalized to beta-actin shown in each gel. In contrast to the Kv1.3 alterations, the expression of MBP increased with differentiation. (C) Representative current traces of outward K + currents recorded during depolarizing and hyperpolarizing pulses are shown in cells of OPCs, DF 4d, DF 6d, and DF 8d. The whole-cell outward K + currents recorded before (Total) and 15 min after superfusion of 10 nM PAP (PAP perfusion) to the bath. The Kv1.3 currents were then isolated by subtraction of outward K + currents recorded in the presence of PAP from the total currents (Kv1.3). The summary bar graph illustrating average Kv1.3 current density measured at +60 mV (pA/pF) obtained from OPCs and Ols ( n = 16). With the maturation of Ols, the Kv1.3-conducted potassium currents decreased. All data expressed were obtained from th

- Submitted by
- Invitrogen Antibodies (provider)
- Main image
- Experimental details
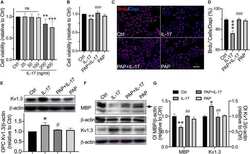
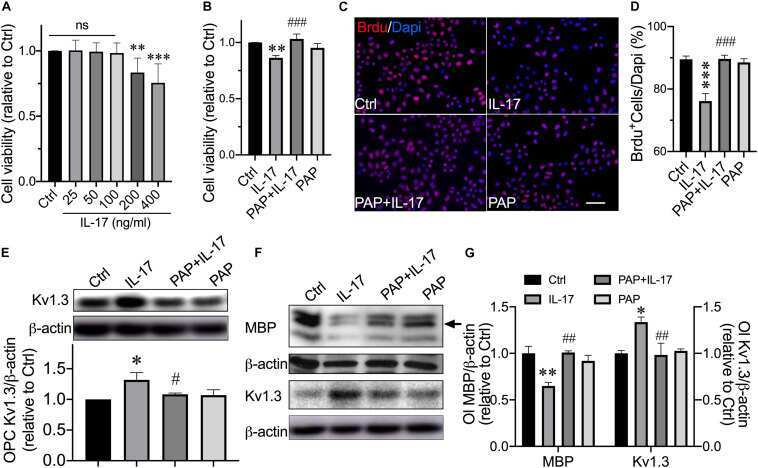
- FIGURE 2 Kv1.3 blockade prevented OPCs from IL-17-induced inhibition of proliferation and differentiation. OPCs were exposed to IL-17 (200 ng/mL) for 48 h with or without preaddition of PAP (10 nM) for 30 min. (A) The dose of IL-17 was tittered by MTT assay performed in OPCs ( n = 6). IL-17 significantly reduced cell viability at a concentration of 200 ng/mL and further reduced at the concentration of 400 ng/mL. (B) MTT assay was performed to detect OPC viability ( n = 7). PAP pretreatment counteracted the loss of cell viability induced by IL-17. (C) OPCs were treated with IL-17 with or without PAP in the presence of BrdU (10 muM) for 48 h. Representative images of merged BrdU immunofluorescence staining (red) and DAPI (blue) are shown. Scale bar = 20 mum. The average percentage of BrdU + cells from five independent experiments are summarized in (D) There were 10 randomly selected visual fields counted for each group from three independent experimental treatments. IL-17-induced reduction of BrdU + cells was attenuated by PAP. (E) Western blot analysis of Kv1.3 expression in OPCs. Band densitometry data are shown in the bar graph (below) ( n = 4). IL-17 treatment for 48 h elevated the Kv1.3 protein expression in OPCs, whereas the PAP attenuated this elevation. For experiments conducted with Ols in (F,G) , Ols were exposed to IL-17 (200 ng/mL) with or without prior addition of PAP (10 nM) for 30 min during the differentiation culture in OPCDM for 6 days. (F , G) Representative
- Submitted by
- Invitrogen Antibodies (provider)
- Main image
- Experimental details
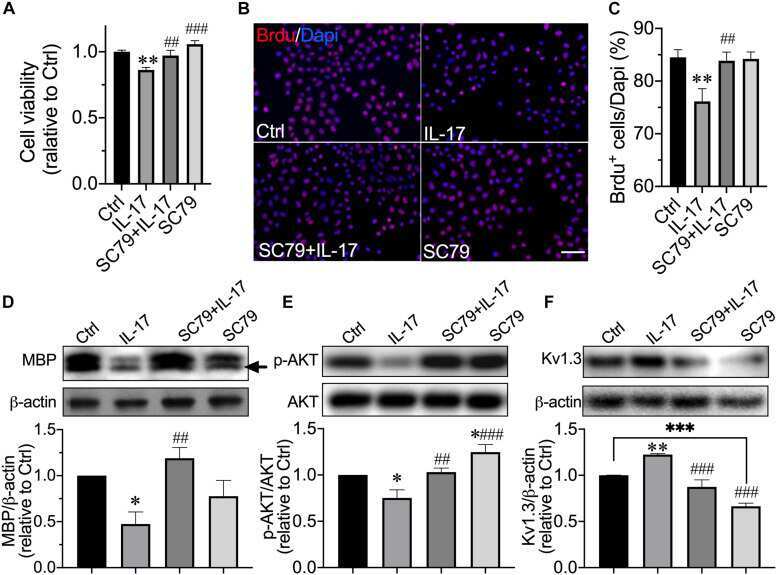
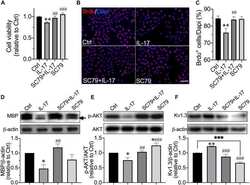
- FIGURE 4 Protection of AKT activator on IL-17-induced inhibition of OPC proliferation and differentiation. OPCs were exposed to IL-17 (200 ng/mL) for 48 h with or without AKT activator SC79 (10 muM). (A) MTT assay was performed to detect OPC viability ( n = 7). SC79 counteracted the decrease in cell viability induced by IL-17. (B) OPCs were treated as described before in the presence of BrdU (10 muM) for 48 h. Representative images of merged BrdU immunofluorescence staining (red) and DAPI (blue) are shown. Scale bar = 20 mum. The average percentage of BrdU + cells from five independent experiments are summarized in (C) There were 10 randomly selected visual fields counted for each experimental group from three independent treatments. IL-17-induced reduction of BrdU + cell percentage was attenuated by SC79. For experiments conducted with Ols in (D-F) , OPCs were exposed to IL-17 (200 ng/mL) with or without SC79 (10 muM) in OPCDM for 6 days. (D-F) Representative images and statistical analyses of MBP ( n = 4), p-AKT ( n = 4), and Kv1.3 ( n = 5) expressions in Ols of Western blot. Band densitometry data are shown in the bar graph (below). SC79 effectively activated AKT signal in our culture system. Similar to the PAP, SC79 counteracted the IL-17-induced decrease in MBP and increase in Kv1.3 expression and mitigated the decrease in p-AKT induced by IL-17. * P < 0.05 vs. control, ** P < 0.01 vs. control, *** P < 0.001 vs. control. ## P < 0.01 vs. IL-17, ### P < 0.001 vs. IL-17.