Explore
 Validate
 Learn
Learn Western blot
 Immunocytochemistry
 Immunohistochemistry
Antibody data
- Antibody Data
- Antigen structure
- References [1]
- Comments [0]
- Validations
- Immunocytochemistry [5]
- Flow cytometry [1]
- Other assay [1]
Submit
Validation data
Reference
Comment
Report error
- Product number
- 44-1160G - Provider product page

- Provider
- Invitrogen Antibodies
- Product name
- Phospho-PPP1R2 (Thr72) Polyclonal Antibody
- Antibody type
- Polyclonal
- Antigen
- Synthetic peptide
- Reactivity
- Human
- Host
- Rabbit
- Isotype
- IgG
- Vial size
- 100 μL
- Storage
- -20°C
Submitted references The PP1 regulator PPP1R2 coordinately regulates AURKA and PP1 to control centrosome phosphorylation and maintain central spindle architecture.
Bresch AM, Yerich N, Wang R, Sperry AO
BMC molecular and cell biology 2020 Nov 25;21(1):84
BMC molecular and cell biology 2020 Nov 25;21(1):84
No comments: Submit comment
Supportive validation
- Submitted by
- Invitrogen Antibodies (provider)
- Main image

- Experimental details
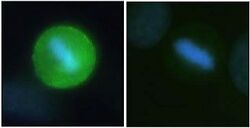
- HeLa cells grown on a chamber slide were fixed in cold 10% trichloroacetic acid for 10 minutes, rinsed in TBS and permeabilized with 0.1% Triton-X-100 for 15 minutes. Slides were incubated with the I-2 (pT72) antibody

- Submitted by
- Invitrogen Antibodies (provider)
- Main image
- Experimental details
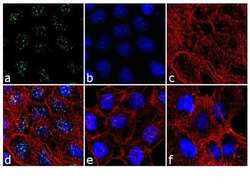
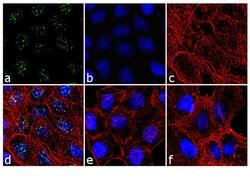
- Immunofluorescence analysis of Phospho-Inhibitor-2 pThr72 was done on 70% confluent log phase A431 cells treated with 3uM of Nocodazole for 24 hours. The cells were fixed with 4% paraformaldehyde for 10 minutes, permeabilized with 0.1% Triton™ X-100 for 10 minutes, and blocked with 1% BSA for 1 hour at room temperature. The cells were labeled with Phospho-Inhibitor-2 pThr72 Rabbit Polyclonal Antibody (Product # 44-1160G) at 1:250 dilution in 0.1% BSA and incubated for 3 hours at room temperature and then labeled with Goat anti-Rabbit IgG (H+L) Superclonal™ Secondary Antibody, Alexa Fluor® 488 conjugate (Product # A27034) at a dilution of 1:2000 for 45 minutes at room temperature (Panel a: green). Nuclei (Panel b: blue) were stained with SlowFade® Gold Antifade Mountant with DAPI (Product # S36938). F-actin (Panel c: red) was stained with Rhodamine Phalloidin (Product # R415, 1:300). Panel d is a merged image showing punctuated nuclear localization. Panel e is untreated cell with no signal. Panel f is a no primary antibody control. The images were captured at 60X magnification.
- Submitted by
- Invitrogen Antibodies (provider)
- Main image
- Experimental details
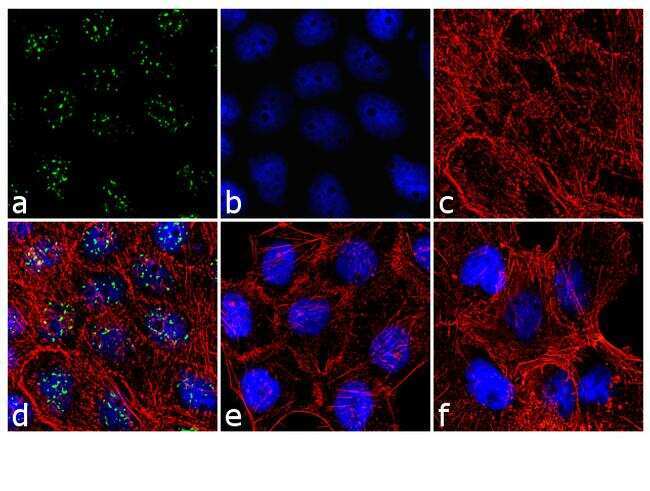
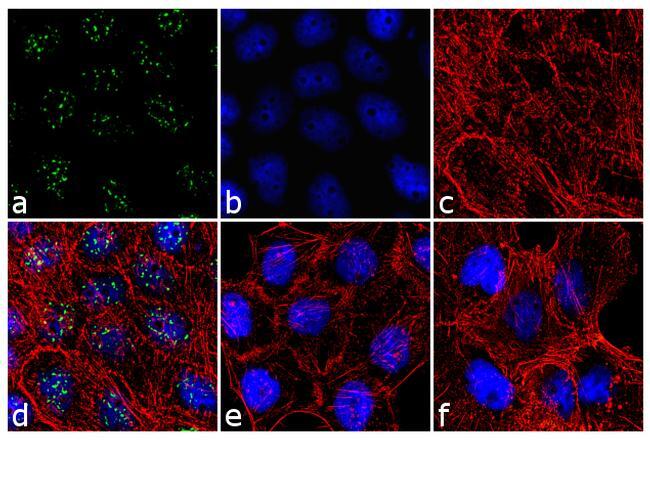
- Immunofluorescence analysis of Phospho-Inhibitor-2 pThr72 was done on 70% confluent log phase A431 cells treated with 3uM of Nocodazole for 24 hours. The cells were fixed with 4% paraformaldehyde for 10 minutes, permeabilized with 0.1% Triton™ X-100 for 10 minutes, and blocked with 1% BSA for 1 hour at room temperature. The cells were labeled with Phospho-Inhibitor-2 pThr72 Rabbit Polyclonal Antibody (Product # 44-1160G) at 1:250 dilution in 0.1% BSA and incubated for 3 hours at room temperature and then labeled with Goat anti-Rabbit IgG (Heavy Chain) Superclonal™ Secondary Antibody, Alexa Fluor® 488 conjugate (Product # A27034) at a dilution of 1:2000 for 45 minutes at room temperature (Panel a: green). Nuclei (Panel b: blue) were stained with SlowFade® Gold Antifade Mountant with DAPI (Product # S36938). F-actin (Panel c: red) was stained with Rhodamine Phalloidin (Product # R415, 1:300). Panel d is a merged image showing punctuated nuclear localization. Panel e is untreated cell with no signal. Panel f is a no primary antibody control. The images were captured at 60X magnification.
- Submitted by
- Invitrogen Antibodies (provider)
- Main image
- Experimental details
- HeLa cells grown on a chamber slide were fixed in cold 10% trichloroacetic acid for 10 minutes, rinsed in TBS and permeabilized with 0.1% Triton-X-100 for 15 minutes. Slides were incubated with the I-2 (pT72) antibody

Supportive validation
- Submitted by
- Invitrogen Antibodies (provider)
- Main image
- Experimental details
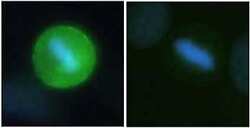
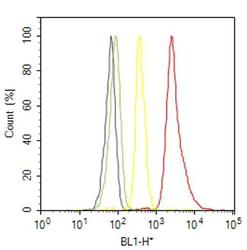
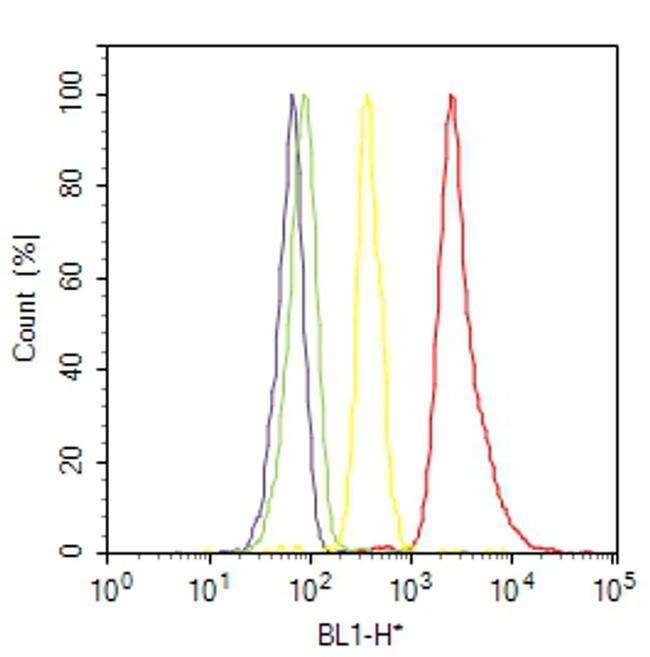
- Flow cytometry analysis of Phospho-Inhibitor-2 [pThr72] was done on HeLa cells. Cells were fixed with 70% ethanol for 10 minutes, permeabilized with 0.25% Triton™ X-100 for 20 minutes, and blocked with 5% BSA for 30 minutes at room temperature. Cells were labeled with Phospho-Inhibitor-2 [pThr72] Rabbit Polyclonal Antibody (441160G, red histogram) or with rabbit isotype control (yellow histogram) at 3-5 ug/million cells in 2.5% BSA. After incubation at room temperature for 2 hours, the cells were labeled with Alexa Fluor® 488 Goat Anti-Rabbit Secondary Antibody (A11008) at a dilution of 1:400 for 30 minutes at room temperature. The representative 10,000 cells were acquired and analyzed for each sample using an Attune® Acoustic Focusing Cytometer. The purple histogram represents unstained control cells and the green histogram represents no-primary-antibody control..
Supportive validation
- Submitted by
- Invitrogen Antibodies (provider)
- Main image
- Experimental details
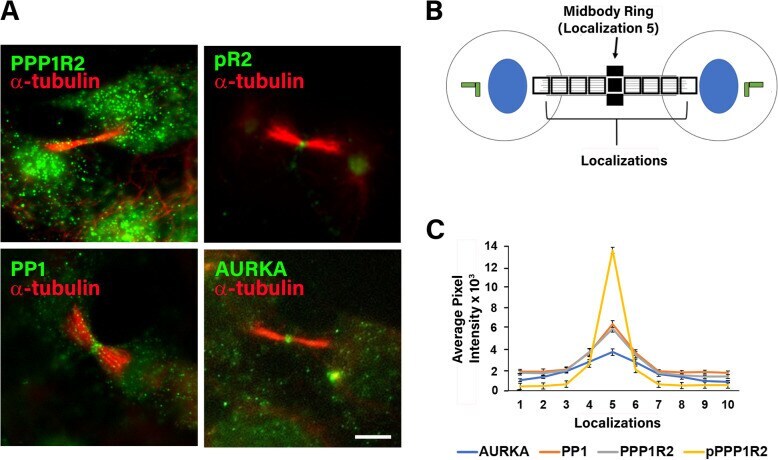
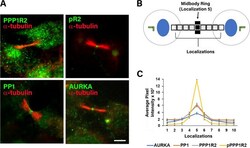
- Fig. 4 PP1, PPP1R2, pR2, and AURKA are localized at the midbody. a ARPE-19 cells were fixed and stained for the indicated endogenous proteins (green) localized relative to alpha-tubulin of the central spindle (red). b Average intensity from the green channel along the central spindle was measured in 10-0.87 mum 2 square regions spanning the length of the central spindle in 30 dividing cells and is plotted in ( c ). Size bar equals 5 mum. Asterisks indicate statistical significance compared to control (* p