Explore
 Validate
 Learn
Learn Western blot
 Immunohistochemistry
Antibody data
- Antibody Data
- Antigen structure
- References [6]
- Comments [0]
- Validations
- Immunohistochemistry [2]
- Flow cytometry [4]
- Other assay [5]
Submit
Validation data
Reference
Comment
Report error
- Product number
- PA5-22993 - Provider product page

- Provider
- Invitrogen Antibodies
- Product name
- Ferroportin Polyclonal Antibody
- Antibody type
- Polyclonal
- Antigen
- Synthetic peptide
- Description
- Suggested positive control: human intestine protein.
- Reactivity
- Human, Mouse, Rat, Bovine, Porcine
- Host
- Rabbit
- Isotype
- IgG
- Vial size
- 100 μL
- Concentration
- 1 mg/mL
- Storage
- Store at 4°C short term. For long term storage, store at -20°C, avoiding freeze/thaw cycles.
Submitted references Effect of Chronic Cadmium Exposure on Brain and Liver Transporters and Drug-Metabolizing Enzymes in Male and Female Mice Genetically Predisposed to Alzheimer's Disease.
Knocking out alpha-synuclein in melanoma cells dysregulates cellular iron metabolism and suppresses tumor growth.
β-Phenethyl Isothiocyanate Induces Cell Death in Human Osteosarcoma through Altering Iron Metabolism, Disturbing the Redox Balance, and Activating the MAPK Signaling Pathway.
Gestational diabetes mellitus affects placental iron homeostasis: Mechanism and clinical implications.
Iron Prevents Hypoxia-Associated Inflammation Through the Regulation of Nuclear Factor-κB in the Intestinal Epithelium.
Systemic Iron Deficiency in a Nonhuman Primate Model of Endometriosis.
Wang H, Zhang L, Xia Z, Cui JY
Drug metabolism and disposition: the biological fate of chemicals 2022 Oct;50(10):1414-1428
Drug metabolism and disposition: the biological fate of chemicals 2022 Oct;50(10):1414-1428
Knocking out alpha-synuclein in melanoma cells dysregulates cellular iron metabolism and suppresses tumor growth.
Shekoohi S, Rajasekaran S, Patel D, Yang S, Liu W, Huang S, Yu X, Witt SN
Scientific reports 2021 Mar 4;11(1):5267
Scientific reports 2021 Mar 4;11(1):5267
β-Phenethyl Isothiocyanate Induces Cell Death in Human Osteosarcoma through Altering Iron Metabolism, Disturbing the Redox Balance, and Activating the MAPK Signaling Pathway.
Lv H, Zhen C, Liu J, Shang P
Oxidative medicine and cellular longevity 2020;2020:5021983
Oxidative medicine and cellular longevity 2020;2020:5021983
Gestational diabetes mellitus affects placental iron homeostasis: Mechanism and clinical implications.
Zaugg J, Melhem H, Huang X, Wegner M, Baumann M, Surbek D, Körner M, Albrecht C
FASEB journal : official publication of the Federation of American Societies for Experimental Biology 2020 Jun;34(6):7311-7329
FASEB journal : official publication of the Federation of American Societies for Experimental Biology 2020 Jun;34(6):7311-7329
Iron Prevents Hypoxia-Associated Inflammation Through the Regulation of Nuclear Factor-κB in the Intestinal Epithelium.
Simmen S, Cosin-Roger J, Melhem H, Maliachovas N, Maane M, Baebler K, Weder B, Maeyashiki C, Spanaus K, Scharl M, de Vallière C, Zeitz J, Vavricka SR, Hausmann M, Rogler G, Ruiz PA
Cellular and molecular gastroenterology and hepatology 2019;7(2):339-355
Cellular and molecular gastroenterology and hepatology 2019;7(2):339-355
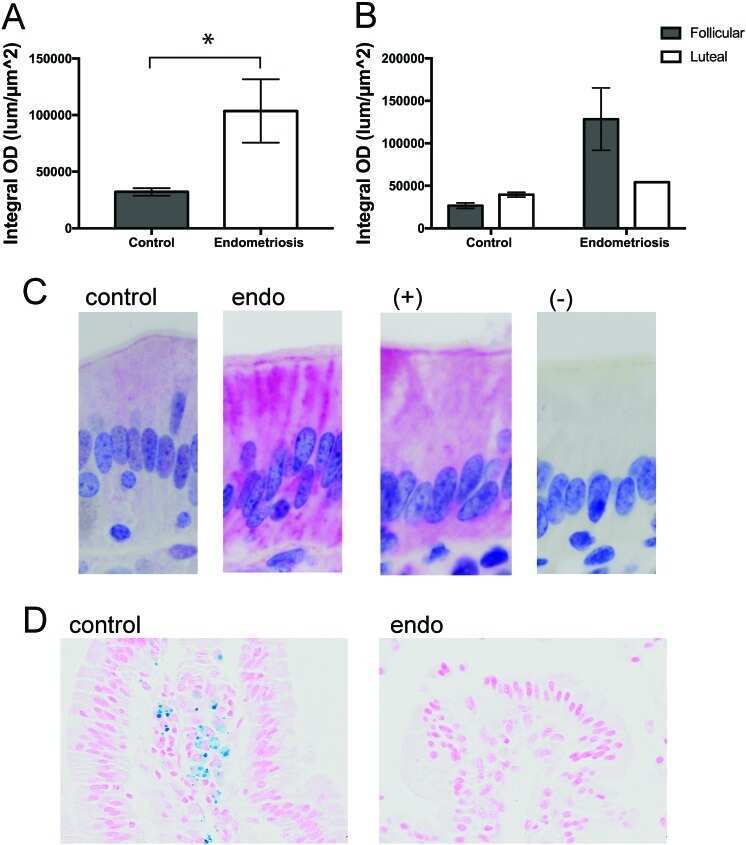
Systemic Iron Deficiency in a Nonhuman Primate Model of Endometriosis.
Atkins HM, Appt SE, Taylor RN, Torres-Mendoza Y, Lenk EE, Rosenthal NS, Caudell DL
Comparative medicine 2018 Aug 1;68(4):298-307
Comparative medicine 2018 Aug 1;68(4):298-307
No comments: Submit comment
Supportive validation
- Submitted by
- Invitrogen Antibodies (provider)
- Main image
- Experimental details
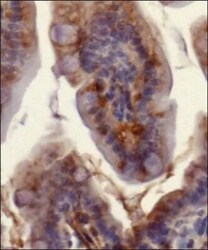
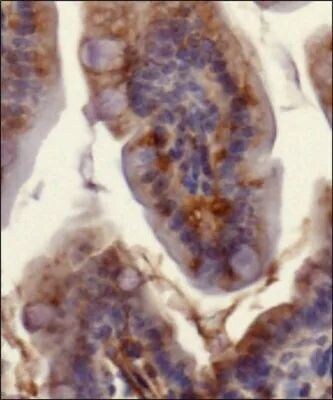
- Immunohistochemical analysis of Ferroportin in murine small intestinal section. Samples were incubated in Ferroportin polyclonal antibody (Product # PA5-22993) using a dilution of 1:200. The antibody primarily developed a membranous staining pattern in the intestinal epithelial cells.
- Submitted by
- Invitrogen Antibodies (provider)
- Main image
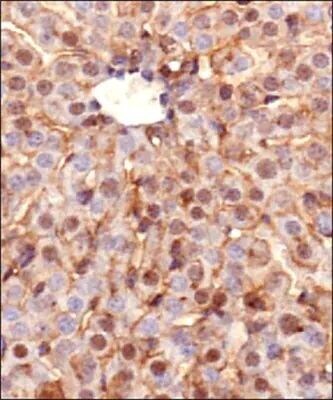
- Experimental details
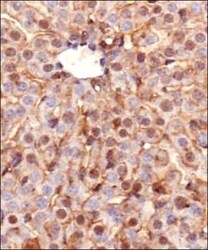
- Immunohistochemical analysis of Ferroportin in murine liver section. Samples were incubated in Ferroportin polyclonal antibody (Product # PA5-22993) using a dilution of 1:200. The representative image shows intense staining in the cellular membranes, whereas, a relatively milder postivity was observed in the cytoplasm of hepatocytes.
Supportive validation
- Submitted by
- Invitrogen Antibodies (provider)
- Main image
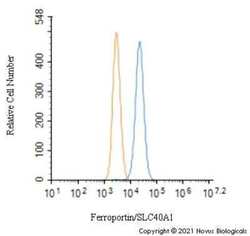
- Experimental details
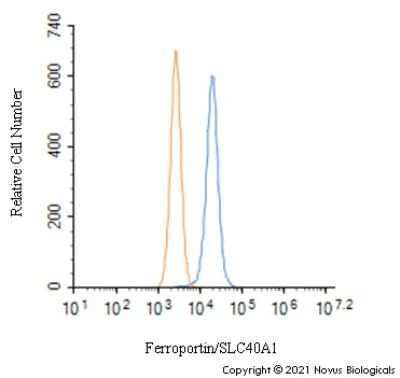
- Flow cytometry of Ferroportin in HepG2 cells (blue) and a matched isotype control (orange). Samples were incubated in Ferroportin polyclonal antibody (Product # PA5-22993) using a dilution of 1.0 µg/mL for 30 minutes at room temperature followed by a Rabbit IgG (H+L) Cross-Adsorbed Secondary Antibody, Dylight™ 550 (Product # SA5-10033). Cells were fixed with 4% PFA and then permeabilized with 0.1% saponin.
- Submitted by
- Invitrogen Antibodies (provider)
- Main image
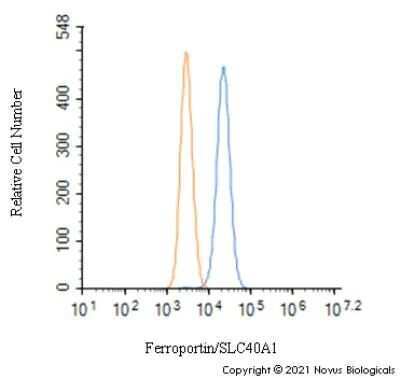
- Experimental details
- Flow cytometry of Ferroportin in Hek293 cells with (blue) and a matched isotype control (orange). Samples were incubated in Ferroportin polyclonal antibody (Product # PA5-22993) using a dilution of 1.0 µg/mL for 30 minutes at room temperature followed by a Rabbit IgG (H+L) Cross-Adsorbed Secondary Antibody, Dylight™ 550 (Product # SA5-10033). Cells were fixed with 4% PFA and then permeabilized with 0.1% saponin.
- Submitted by
- Invitrogen Antibodies (provider)
- Main image

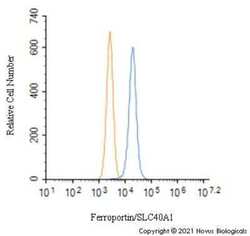
- Experimental details
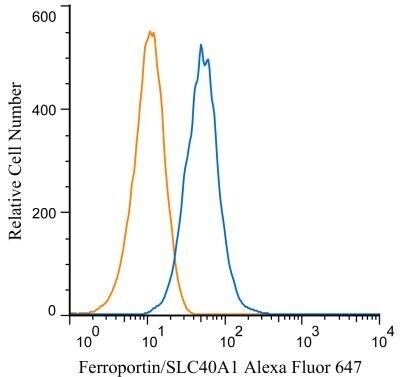
- Flow cytometry of Ferroportin in HepG2 cells. Samples were incubated in Ferroportin polyclonal antibody (Product # PA5-22993) using a dilution of 5 µg/mL for 30 minutes at room temperature. Antibody (blue) and a matched isotype control (orange). Cells were fixed with 4% PFA and then permeablized with 0.1% saponin. Both antibodies were conjugated to Alexa Fluor 647.
- Submitted by
- Invitrogen Antibodies (provider)
- Main image
- Experimental details
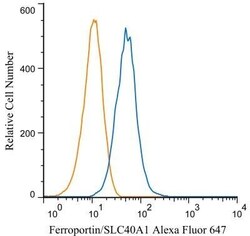
- Flow cytometry of Ferroportin in HepG2 cells. Samples were incubated in Ferroportin polyclonal antibody (Product # PA5-22993) using a dilution of 5 µg/mL for 30 minutes at room temperature. Antibody (blue) and a matched isotype control (orange). Cells were fixed with 4% PFA and then permeablized with 0.1% saponin. Both antibodies were conjugated to Alexa Fluor 647.

Supportive validation
- Submitted by
- Invitrogen Antibodies (provider)
- Main image
- Experimental details
- NULL
- Submitted by
- Invitrogen Antibodies (provider)
- Main image
- Experimental details
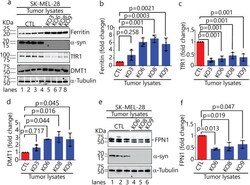
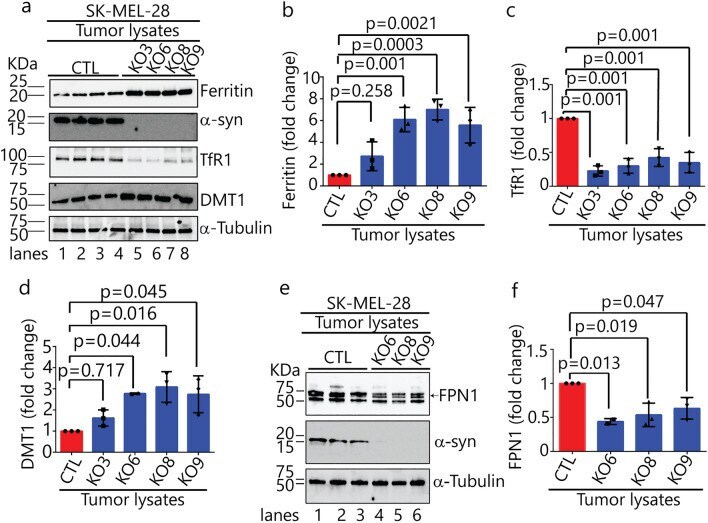
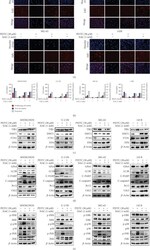
- Figure 7 Loss of alpha-syn alters levels of proteins involved in iron-homeostasis. ( a ) Representative Western blots of iron-related proteins (ferritin, alpha-syn, TfR1, and DMT1) in the indicated xenograft lysates. ( b - d) Quantitative analysis of fold changes in ferritin, TfR1 and DMT1, derived from densitometric analysis of band intensities normalized to alpha-tubulin. P-values were determined using a one-way ANOVA with Dunnett posthoc test (n = 3). ( e) Representative Western blots of ferroportin (FPN1) and alpha-syn in the indicated xenograft lysates. ( f ) Quantitative analysis of the fold change in FPN1, derived from densitometric analysis of band intensities normalized to alpha-tubulin. P-values were determined using a one-way ANOVA with Dunnett posthoc test (n = 3). Error bars in each plot are +- s.d. Uncropped sections of blots are shown in Supplementary Figure S5 .
- Submitted by
- Invitrogen Antibodies (provider)
- Main image
- Experimental details
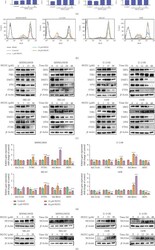
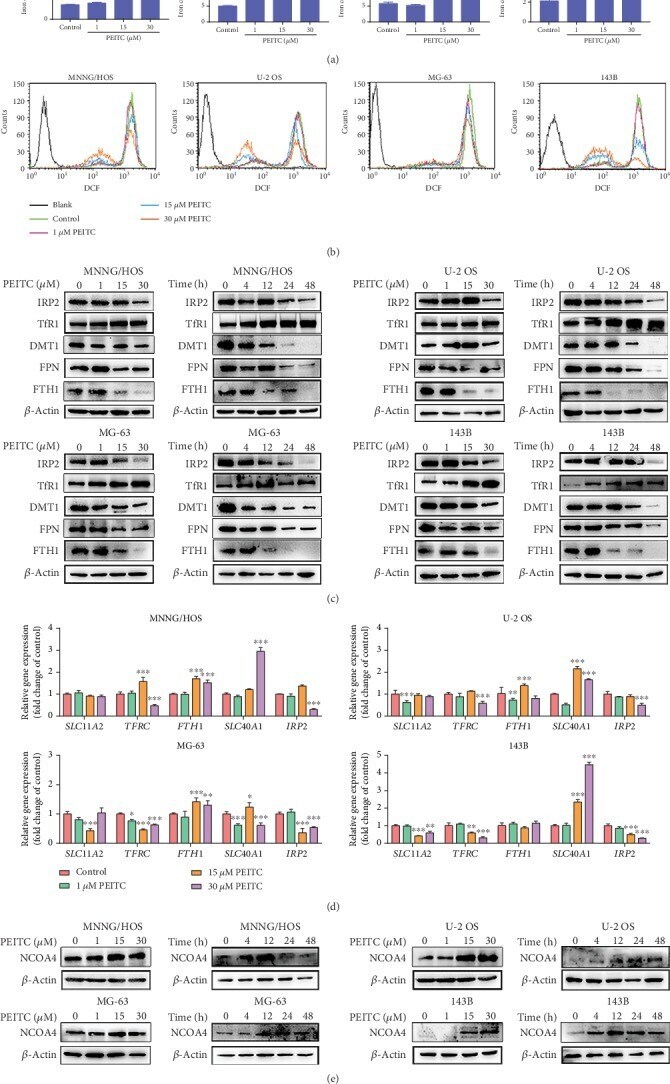
- Figure 4 PEITC altered iron metabolism in human OS cells. (a) Total iron level in MNNG/HOS, U-2 OS, MG-63, and 143B cells after the indicated concentrations of PEITC treatment for 24 h by AAS. (b) The level of labile iron in MNNG/HOS, U-2 OS, MG-63, and 143B cells after the indicated concentrations of PEITC treatment for 24 h with Calcein-AM staining by flow cytometry analysis. (c) Protein expression levels of TfR1, DMT1, FTH1, FPN, and IRP2 in MNNG/HOS, U-2 OS, MG-63, and 143B cells treated with the indicated concentrations of PEITC for 20 h or 30 mu M PEITC for 4 h, 12 h, 24 h, and 48 h. (d) mRNA levels of TFRC , SLC11A2 , FTH1 , SLC40A1 , and IRP2 in MNNG/HOS, U-2 OS, MG-63, and 143B cells after PEITC treatment for 24 h. (e) Protein expression levels of NCOA4 in MNNG/HOS, U-2 OS, MG-63, and 143B cells treated with the indicated concentrations of PEITC for 20 h or 30 mu M PEITC for 4 h, 12 h, 24 h, and 48 h. All data were presented as the means +- SD ( n = 3). * P < 0.05, ** P < 0.01, and *** P < 0.001 versus control group.
- Submitted by
- Invitrogen Antibodies (provider)
- Main image
- Experimental details
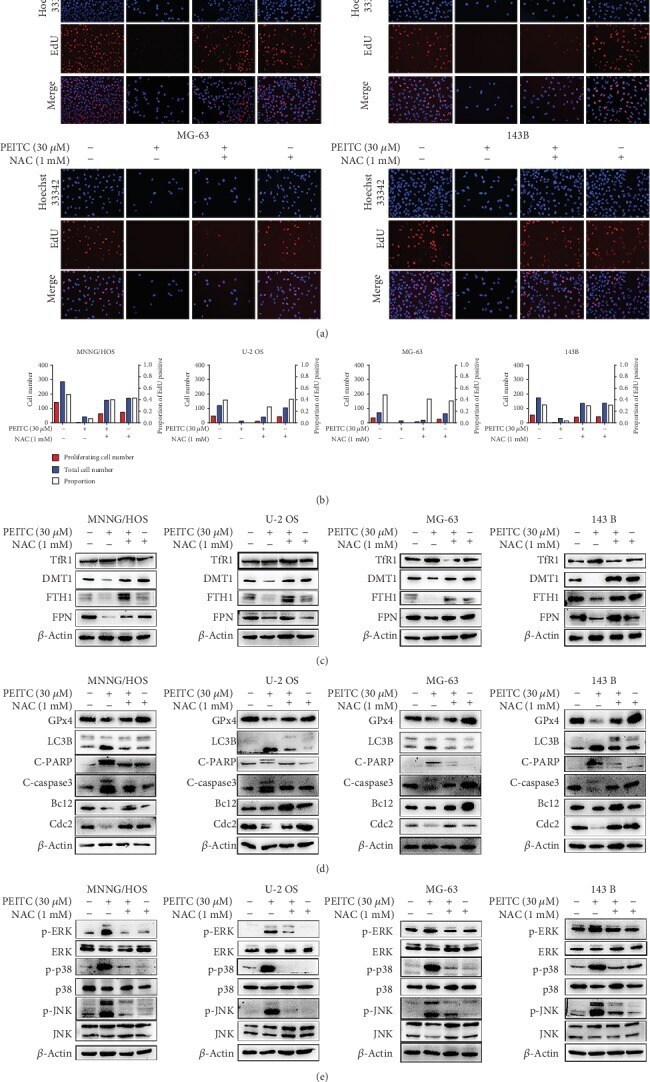
- Figure 9 PEITC induced cell death via ROS generation in human OS cells. (a) EdU staining assay of MNNG/HOS, U-2 OS, MG-63, and 143B cells treated with 30 mu M PEITC in the presence or absence of NAC for 24 h. (b) Quantitative analysis of EdU staining in (a). (c) Protein expression levels of TfR1, DMT1, FTH1, and FPN in MNNG/HOS, U-2 OS, MG-63, and 143B cells treated with 30 mu M PEITC in the presence or absence of NAC for 24 h. (d) Protein expression levels of GPx4, LC3B, C-PARP, C-caspase3, Bcl2, and Cdc2 in MNNG/HOS, U-2 OS, MG-63, and 143B cells treated with 30 mu M PEITC in the presence or absence of NAC 24 h. (e) Phosphorylation levels of ERK, p38, and JNK in MNNG/HOS, U-2 OS, MG-63, and 143B cells treated with 30 mu M PEITC in the presence or absence of NAC for 24 h.
- Submitted by
- Invitrogen Antibodies (provider)
- Main image
- Experimental details
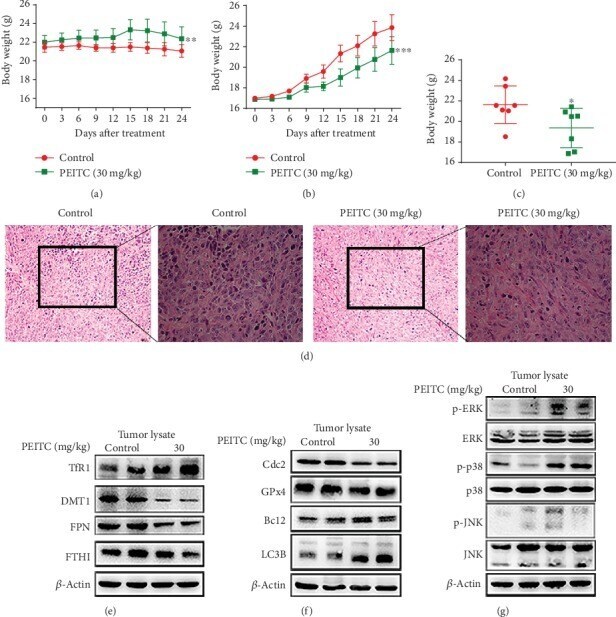
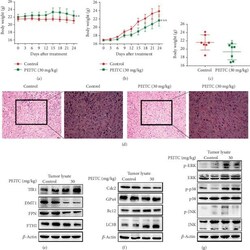
- Figure 10 PEITC suppressed OS growth in vivo . MNNG/HOS cells were injected subcutaneously into the right flank of the male BALB/c nude mice. One week after the OS xenograft mouse model was established, the mice were randomly divided into two groups and, respectively, administrated with 10% sesame seed oil and 30 mg/kg PEITC once daily for 24 consecutive days. (a) Body weight change of the two groups. (b) Volume change of OS tissues of the two groups. Data were calculated by the formula: volume = length x width 2 x 0.5. (c) Weight of OS tissues from the two groups. (d) H&E staining analysis of tumor tissues (200x and 400x). (e) The protein expression levels of TfR1, DMT1, FTH1, and FPN in tumor tissues. (f) The protein expression levels of LC3B, C-caspase3, GPx4, and Cdc2 in tumor tissues. (g) Phosphorylation levels of ERK, p38, and JNK in tumor tissues. All data were presented as the means +- SD ( n = 7). * P < 0.05, ** P < 0.01, and *** P < 0.001 versus control group.