Explore
 Validate
 Learn
Learn Western blot
 ELISA
ELISA Immunocytochemistry
Antibody data
- Antibody Data
- Antigen structure
- References [4]
- Comments [0]
- Validations
- Immunocytochemistry [6]
- Flow cytometry [5]
- Other assay [4]
Submit
Validation data
Reference
Comment
Report error
- Product number
- MA5-13778 - Provider product page

- Provider
- Invitrogen Antibodies
- Product name
- INSR beta Monoclonal Antibody (CT-1)
- Antibody type
- Monoclonal
- Antigen
- Synthetic peptide
- Description
- MA5-13778 targets Insulin Receptor beta in ELISA, AP, FACS, ICC/IF and IP applications and shows reactivity with Human, mouse, and Rat samples. The MA5-13778 immunogen is a 15-mer synthetic peptide corresponding to aa Tyr-KKNGRILTLPRSNPS from the C-terminal of human insulin receptor beta-subunit.
- Reactivity
- Human, Mouse, Rat
- Host
- Mouse
- Isotype
- IgG
- Antibody clone number
- CT-1
- Vial size
- 500 μL
- Concentration
- 0.2 mg/mL
- Storage
- 4°C
Submitted references Global proteomic analysis of insulin receptor interactors in glomerular podocytes.
Prediction of Drug Permeability Using In Vitro Blood-Brain Barrier Models with Human Induced Pluripotent Stem Cell-Derived Brain Microvascular Endothelial Cells.
SMPDL3b modulates insulin receptor signaling in diabetic kidney disease.
Coordinated regulation of insulin signaling by the protein tyrosine phosphatases PTP1B and TCPTP.
Hosawi SB, Humphries JD, Coward RJ, Knight D, Humphries MJ, Lennon R
Wellcome open research 2020;5:202
Wellcome open research 2020;5:202
Prediction of Drug Permeability Using In Vitro Blood-Brain Barrier Models with Human Induced Pluripotent Stem Cell-Derived Brain Microvascular Endothelial Cells.
Ohshima M, Kamei S, Fushimi H, Mima S, Yamada T, Yamamoto T
BioResearch open access 2019;8(1):200-209
BioResearch open access 2019;8(1):200-209
SMPDL3b modulates insulin receptor signaling in diabetic kidney disease.
Mitrofanova A, Mallela SK, Ducasa GM, Yoo TH, Rosenfeld-Gur E, Zelnik ID, Molina J, Varona Santos J, Ge M, Sloan A, Kim JJ, Pedigo C, Bryn J, Volosenco I, Faul C, Zeidan YH, Garcia Hernandez C, Mendez AJ, Leibiger I, Burke GW, Futerman AH, Barisoni L, Ishimoto Y, Inagi R, Merscher S, Fornoni A
Nature communications 2019 Jun 19;10(1):2692
Nature communications 2019 Jun 19;10(1):2692
Coordinated regulation of insulin signaling by the protein tyrosine phosphatases PTP1B and TCPTP.
Galic S, Hauser C, Kahn BB, Haj FG, Neel BG, Tonks NK, Tiganis T
Molecular and cellular biology 2005 Jan;25(2):819-29
Molecular and cellular biology 2005 Jan;25(2):819-29
No comments: Submit comment
Supportive validation
- Submitted by
- Invitrogen Antibodies (provider)
- Main image

- Experimental details
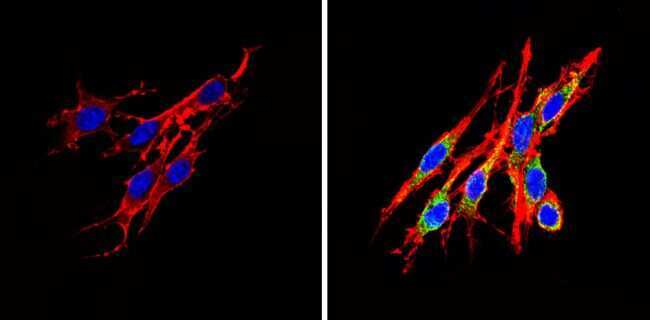
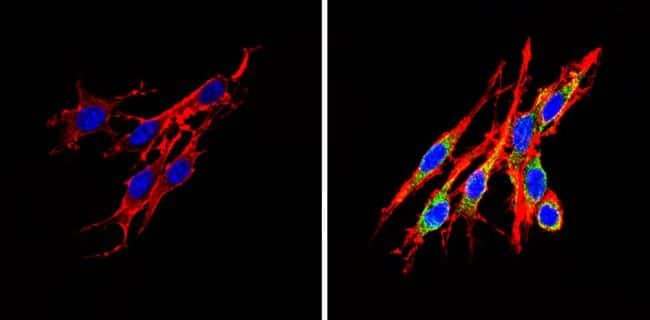
- Immunofluorescent analysis of Insulin Receptor beta (green) showing staining in the cytoplasm of C6 cells (right) compared to a negative control without primary antibody (left). Formalin-fixed cells were permeabilized with 0.1% Triton X-100 in TBS for 5-10 minutes and blocked with 3% BSA-PBS for 30 minutes at room temperature. Cells were probed with an Insulin Receptor beta monoclonal antibody (Product # MA5-13778) in 3% BSA-PBS at a dilution of 1:20 and incubated overnight at 4 ºC in a humidified chamber. Cells were washed with PBST and incubated with a DyLight-conjugated secondary antibody in PBS at room temperature in the dark. F-actin (red) was stained with a fluorescent red phalloidin and nuclei (blue) were stained with Hoechst or DAPI. Images were taken at a magnification of 60x.
- Submitted by
- Invitrogen Antibodies (provider)
- Main image
- Experimental details
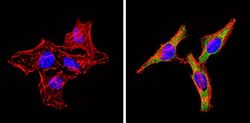
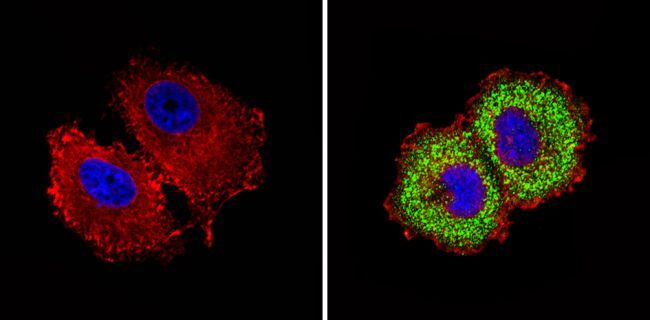
- Immunofluorescent analysis of Insulin Receptor beta (green) showing staining in the cytoplasm of Hela cells (right) compared to a negative control without primary antibody (left). Formalin-fixed cells were permeabilized with 0.1% Triton X-100 in TBS for 5-10 minutes and blocked with 3% BSA-PBS for 30 minutes at room temperature. Cells were probed with an Insulin Receptor beta monoclonal antibody (Product # MA5-13778) in 3% BSA-PBS at a dilution of 1:20 and incubated overnight at 4 ºC in a humidified chamber. Cells were washed with PBST and incubated with a DyLight-conjugated secondary antibody in PBS at room temperature in the dark. F-actin (red) was stained with a fluorescent red phalloidin and nuclei (blue) were stained with Hoechst or DAPI. Images were taken at a magnification of 60x.

- Submitted by
- Invitrogen Antibodies (provider)
- Main image

- Experimental details
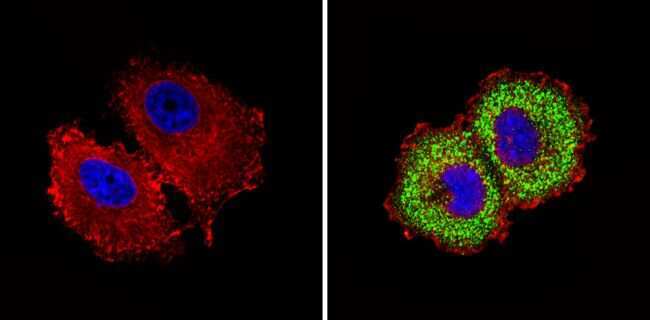
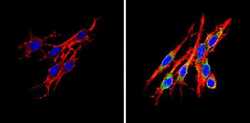
- Immunofluorescent analysis of Insulin Receptor beta (green) showing staining in the cytoplasm of MCF-7 cells (right) compared to a negative control without primary antibody (left). Formalin-fixed cells were permeabilized with 0.1% Triton X-100 in TBS for 5-10 minutes and blocked with 3% BSA-PBS for 30 minutes at room temperature. Cells were probed with an Insulin Receptor beta monoclonal antibody (Product # MA5-13778) in 3% BSA-PBS at a dilution of 1:20 and incubated overnight at 4 ºC in a humidified chamber. Cells were washed with PBST and incubated with a DyLight-conjugated secondary antibody in PBS at room temperature in the dark. F-actin (red) was stained with a fluorescent red phalloidin and nuclei (blue) were stained with Hoechst or DAPI. Images were taken at a magnification of 60x.
- Submitted by
- Invitrogen Antibodies (provider)
- Main image

- Experimental details
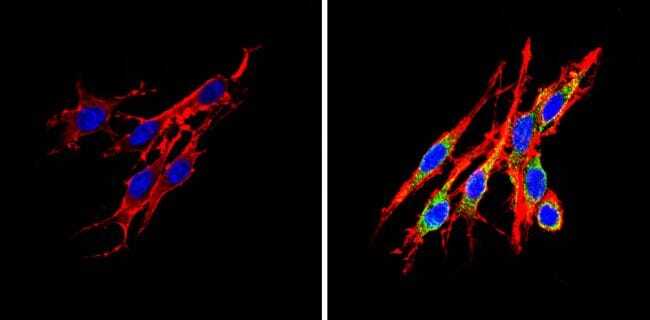
- Immunofluorescent analysis of Insulin Receptor beta (green) showing staining in the cytoplasm of C6 cells (right) compared to a negative control without primary antibody (left). Formalin-fixed cells were permeabilized with 0.1% Triton X-100 in TBS for 5-10 minutes and blocked with 3% BSA-PBS for 30 minutes at room temperature. Cells were probed with an Insulin Receptor beta monoclonal antibody (Product # MA5-13778) in 3% BSA-PBS at a dilution of 1:20 and incubated overnight at 4 ºC in a humidified chamber. Cells were washed with PBST and incubated with a DyLight-conjugated secondary antibody in PBS at room temperature in the dark. F-actin (red) was stained with a fluorescent red phalloidin and nuclei (blue) were stained with Hoechst or DAPI. Images were taken at a magnification of 60x.
- Submitted by
- Invitrogen Antibodies (provider)
- Main image

- Experimental details
- Immunofluorescent analysis of Insulin Receptor beta (green) showing staining in the cytoplasm of MCF-7 cells (right) compared to a negative control without primary antibody (left). Formalin-fixed cells were permeabilized with 0.1% Triton X-100 in TBS for 5-10 minutes and blocked with 3% BSA-PBS for 30 minutes at room temperature. Cells were probed with an Insulin Receptor beta monoclonal antibody (Product # MA5-13778) in 3% BSA-PBS at a dilution of 1:20 and incubated overnight at 4 ºC in a humidified chamber. Cells were washed with PBST and incubated with a DyLight-conjugated secondary antibody in PBS at room temperature in the dark. F-actin (red) was stained with a fluorescent red phalloidin and nuclei (blue) were stained with Hoechst or DAPI. Images were taken at a magnification of 60x.
- Submitted by
- Invitrogen Antibodies (provider)
- Main image
- Experimental details
- Immunofluorescent analysis of Insulin Receptor beta (green) showing staining in the cytoplasm of C6 cells (right) compared to a negative control without primary antibody (left). Formalin-fixed cells were permeabilized with 0.1% Triton X-100 in TBS for 5-10 minutes and blocked with 3% BSA-PBS for 30 minutes at room temperature. Cells were probed with an Insulin Receptor beta monoclonal antibody (Product # MA5-13778) in 3% BSA-PBS at a dilution of 1:20 and incubated overnight at 4 ºC in a humidified chamber. Cells were washed with PBST and incubated with a DyLight-conjugated secondary antibody in PBS at room temperature in the dark. F-actin (red) was stained with a fluorescent red phalloidin and nuclei (blue) were stained with Hoechst or DAPI. Images were taken at a magnification of 60x.
Supportive validation
- Submitted by
- Invitrogen Antibodies (provider)
- Main image
- Experimental details
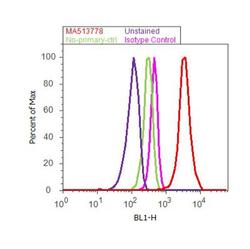
- Flow cytometry analysis of Insulin Receptor beta was done on MCF7 cells. Cells were fixed with 70% ethanol for 10 minutes, permeabilized with 0.25% Triton™ X-100 for 20 minutes, and blocked with 5% BSA for 30 minutes at room temperature. Cells were labeled with Insulin Receptor beta Mouse Monoclonal Antibody (MA513778, red histogram) or with mouse isotype control (pink histogram) at 3-5 ug/million cells in 2.5% BSA. After incubation at room temperature for 2 hours, the cells were labeled with Alexa Fluor® 488 Rabbit Anti-Mouse Secondary Antibody (A11059) at a dilution of 1:400 for 30 minutes at room temperature. The representative 10,000 cells were acquired and analyzed for each sample using an Attune® Acoustic Focusing Cytometer. The purple histogram represents unstained control cells and the green histogram represents no-primary-antibody control.

- Submitted by
- Invitrogen Antibodies (provider)
- Main image
- Experimental details
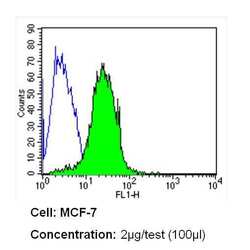
- Flow cytometry analysis of Insulin Receptor beta in MCF-7 cells (green) compared to an isotype control (blue). Cells were harvested, adjusted to a concentration of 1-5x10^6 cells/mL, fixed with 2% paraformaldehyde and washed with PBS. Cells were blocked with a 2% solution of BSA-PBS for 30 min at room temperature and incubated with a Insulin Receptor beta monoclonal antibody (Product # MA5-13778) at a dilution of 2 µg/test for 60 min at room temperature. Cells were then incubated for 40 min at room temperature in the dark using a Dylight 488-conjugated secondary antibody and re-suspended in PBS for FACS analysis.

- Submitted by
- Invitrogen Antibodies (provider)
- Main image
- Experimental details
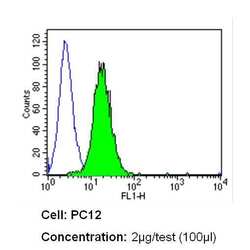
- Flow cytometry analysis of Insulin Receptor beta in PC12 cells (green) compared to an isotype control (blue). Cells were harvested, adjusted to a concentration of 1-5x10^6 cells/mL, fixed with 2% paraformaldehyde and washed with PBS. Cells were blocked with a 2% solution of BSA-PBS for 30 min at room temperature and incubated with a Insulin Receptor beta monoclonal antibody (Product # MA5-13778) at a dilution of 2 µg/test for 60 min at room temperature. Cells were then incubated for 40 min at room temperature in the dark using a Dylight 488-conjugated secondary antibody and re-suspended in PBS for FACS analysis.
- Submitted by
- Invitrogen Antibodies (provider)
- Main image

- Experimental details
- Flow cytometry analysis of Insulin Receptor beta in MCF-7 cells (green) compared to an isotype control (blue). Cells were harvested, adjusted to a concentration of 1-5x10^6 cells/mL, fixed with 2% paraformaldehyde and washed with PBS. Cells were blocked with a 2% solution of BSA-PBS for 30 min at room temperature and incubated with a Insulin Receptor beta monoclonal antibody (Product # MA5-13778) at a dilution of 2 µg/test for 60 min at room temperature. Cells were then incubated for 40 min at room temperature in the dark using a Dylight 488-conjugated secondary antibody and re-suspended in PBS for FACS analysis.

- Submitted by
- Invitrogen Antibodies (provider)
- Main image

- Experimental details
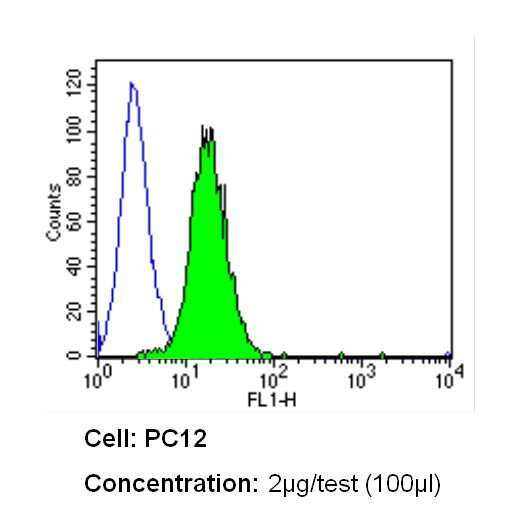
- Flow cytometry analysis of Insulin Receptor beta in PC12 cells (green) compared to an isotype control (blue). Cells were harvested, adjusted to a concentration of 1-5x10^6 cells/mL, fixed with 2% paraformaldehyde and washed with PBS. Cells were blocked with a 2% solution of BSA-PBS for 30 min at room temperature and incubated with a Insulin Receptor beta monoclonal antibody (Product # MA5-13778) at a dilution of 2 µg/test for 60 min at room temperature. Cells were then incubated for 40 min at room temperature in the dark using a Dylight 488-conjugated secondary antibody and re-suspended in PBS for FACS analysis.

Supportive validation
- Submitted by
- Invitrogen Antibodies (provider)
- Main image
- Experimental details
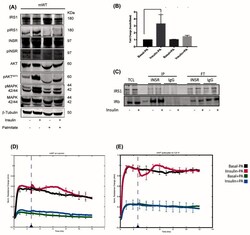
- Figure 2. Podocytes are insulin sensitive. ( A ) Cultured differentiated mouse wild-type (mWT) podocytes are insulin responsive and can activate the PI3K and MAPK pathway. In the presence of palmitate, the cells became insulin resistant with reduced activity of both pathways. ( B ) Podocytes responded to insulin stimulation by initiating 2-NBDG uptake (a glucose analogue) up to three-fold compared to the basal condition, which was lost in the palmitate treatment. ( C ) The insulin receptor (INSR) was isolated using immunoprecipitation, and the insulin receptor substrate 1 (IRS1) was co-immunoprecipitated with the receptor. ( D and E ) The electrical resistance formed by the adhesion of podocytes to laminin and collagen and their formation of a monolayer-like layer measured by electrical cell-substrate impedance sensing (ECIS).
- Submitted by
- Invitrogen Antibodies (provider)
- Main image
- Experimental details
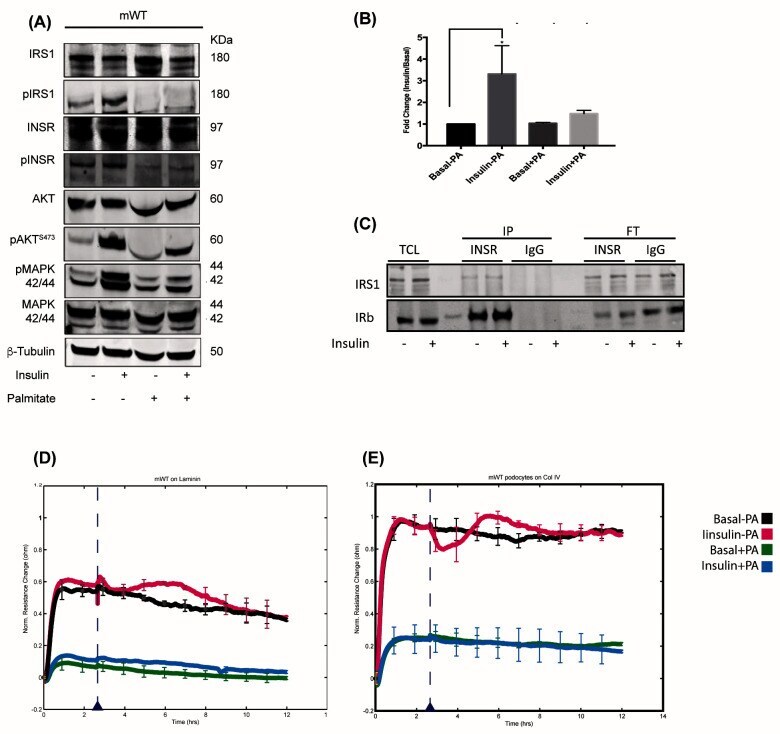
- Figure 5. DCDC2 interacts and co-localises with the INSR in podocytes. ( A ) DCDC2 co-immunoprecipitated with the INSR isolated from hWT-IR podocytes. Palmitate stabilised the interaction of DCDC2 with the INSR, while disrupting microtubules with nocodazole abrogated the interaction between the INSR and DCDC2. ( B - C ) Immunofluorescence imaging of DCDC2 and the INSR in differentiated hWT-IR podocytes showed perinuclear co-localisation and also at the processes of the podocytes as demonstrated by the line profile. DCDC2: Doublecortin containing protein 2, ITGB1: Integrin beta 1.

- Submitted by
- Invitrogen Antibodies (provider)
- Main image
- Experimental details
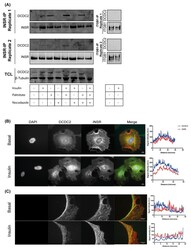
- FIG. 2. TEER and ICC. (A) All differentiated BMEC groups had high barrier function (>1000 Omega x cm 2 ), while Caco-2 and ratBBB kits showed barrier function

- Submitted by
- Invitrogen Antibodies (provider)
- Main image
- Experimental details
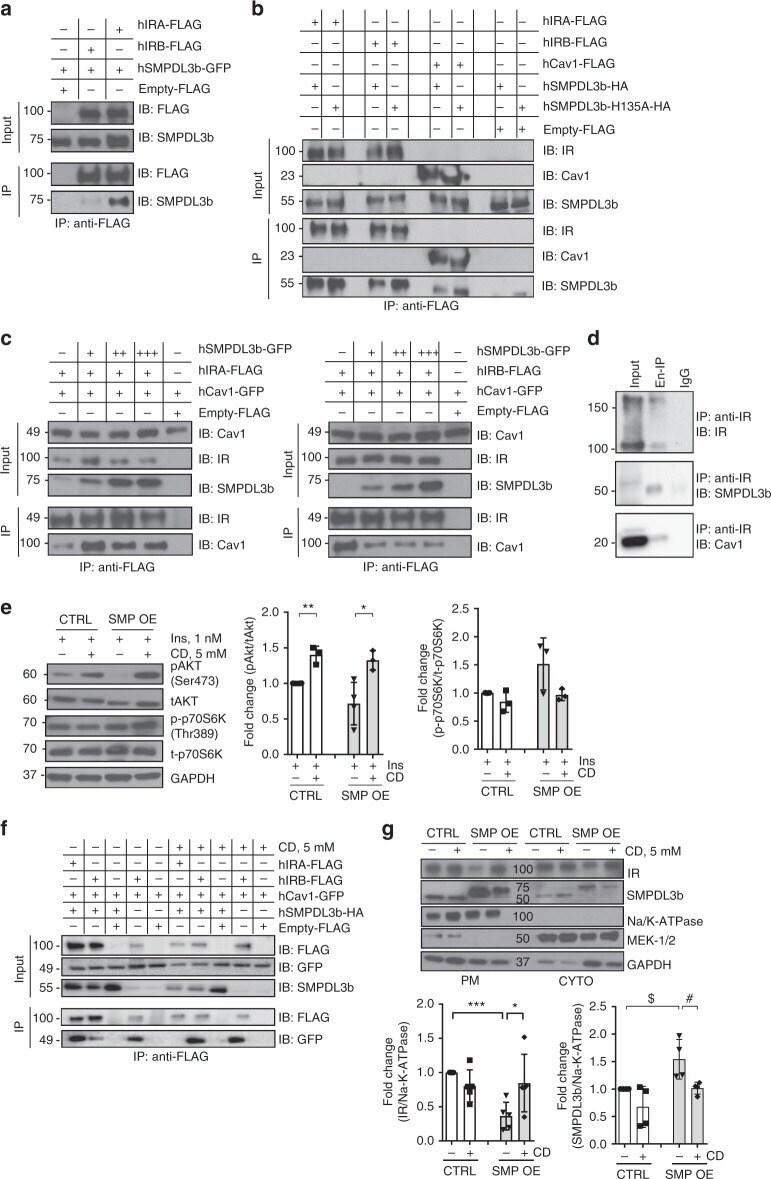
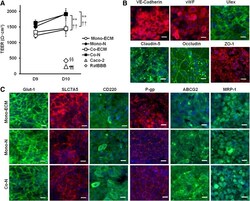
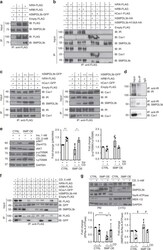
- Fig. 3 SMPDL3b interacts with IRA, IRB, and caveolin-1 in a competitive manner. a - c Immunoprecipitation (IP) experiments performed in HEK293 cells co-transfected with human hIRA-FLAG, hIRB-FLAG, hSMPDL3b-GFP, hSMPDL3b-HA hSMPDL3b-H135A-HA, hCav1-FLAG, and hCav1-GFP plasmids. Empty FLAG vector (Empty-FLAG) was used as a negative control. Antibodies (IB) against FLAG, SMPDL3b, insulin receptor beta-subunit (IR), or caveolin-1 (Cav1) were used in Western blot analysis. Each IP experiment was repeated at least three times. a SMPDL3b interacts with both IR isoforms but preferentially with IRA. b Wildtype SMPDL3b interacts with IRA, IRB, and caveolin-1, a mutation (H135A) in the phosphodiesterase activity domain of SMPDL3b does not affect these interactions. c Overexpression of SMPDL3b enhances the interaction between caveolin-1 and IRA (left panel) and suppresses the interaction between caveolin-1 and IRB (right panel). d Endogenous IP experiments using glomeruli isolated from five C57BL/6 mice indicate that SMPDL3b immunoprecipitates insulin receptor and caveolin-1. IgG served as a negative control. Each IP was repeated three times. e Western blot and bar graph analysis of AKT and p70S6K phosphorylation in control (CTRL) and SMPDL3b overexpressing (SMP OE) podocytes pre-treated with 5 mM methyl-beta-cyclodextrin (CD) and stimulated with 1 nM insulin; * P = 0.02, ** P = 0.001, two-tailed t -test. n = 3 independent experiments. f IP experiments performed in HEK