Explore
 Validate
 Learn
Learn Western blot
 Immunohistochemistry
Antibody data
- Antibody Data
- Antigen structure
- References [2]
- Comments [0]
- Validations
- Western blot [4]
- Immunocytochemistry [8]
- Flow cytometry [1]
- Other assay [1]
Submit
Validation data
Reference
Comment
Report error
- Product number
- PA5-35365 - Provider product page

- Provider
- Invitrogen Antibodies
- Product name
- Glutaminase Polyclonal Antibody
- Antibody type
- Polyclonal
- Antigen
- Synthetic peptide
- Description
- This antibody is predicted to react with rat based on sequence homology.
- Reactivity
- Human, Mouse, Rat
- Host
- Rabbit
- Isotype
- IgG
- Vial size
- 200 μL
- Concentration
- 0.5 mg/mL
- Storage
- Store at 4°C short term. For long term storage, store at -20°C, avoiding freeze/thaw cycles.
Submitted references Pharmacological Inhibition of Glutaminase 1 Normalized the Metabolic State and CD4+ T Cell Response in Sjogren's Syndrome.
Quantitative proteomic analysis of enhanced cellular effects of electrochemotherapy with Cisplatin in triple-negative breast cancer cells.
Fu J, Pu Y, Wang B, Li H, Yang X, Xie L, Shi H, Wang Z, Yin J, Zhan T, Shao Y, Chen C, Luo Q, Xu J, Zong Z, Wei X, Xiao W, Yu C, Zheng L
Journal of immunology research 2022;2022:3210200
Journal of immunology research 2022;2022:3210200
Quantitative proteomic analysis of enhanced cellular effects of electrochemotherapy with Cisplatin in triple-negative breast cancer cells.
Mittal L, Aryal UK, Camarillo IG, Ferreira RM, Sundararajan R
Scientific reports 2019 Sep 26;9(1):13916
Scientific reports 2019 Sep 26;9(1):13916
No comments: Submit comment
Supportive validation
- Submitted by
- Invitrogen Antibodies (provider)
- Main image
- Experimental details
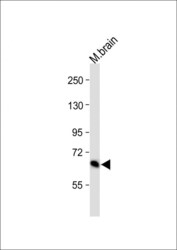
- Western blot analysis of Glutaminase in mouse brain lysate. Samples were incubated with Glutaminase polyclonal antibody (Product # PA5-35365) using a dilution of 1:1,000 followed by Goat Anti-Rabbit IgG, (H+L), Peroxidase conjugated at a dilution of 1:10,000. Lysates/proteins: 20 µg per lane.

- Submitted by
- Invitrogen Antibodies (provider)
- Main image
- Experimental details
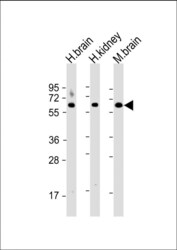
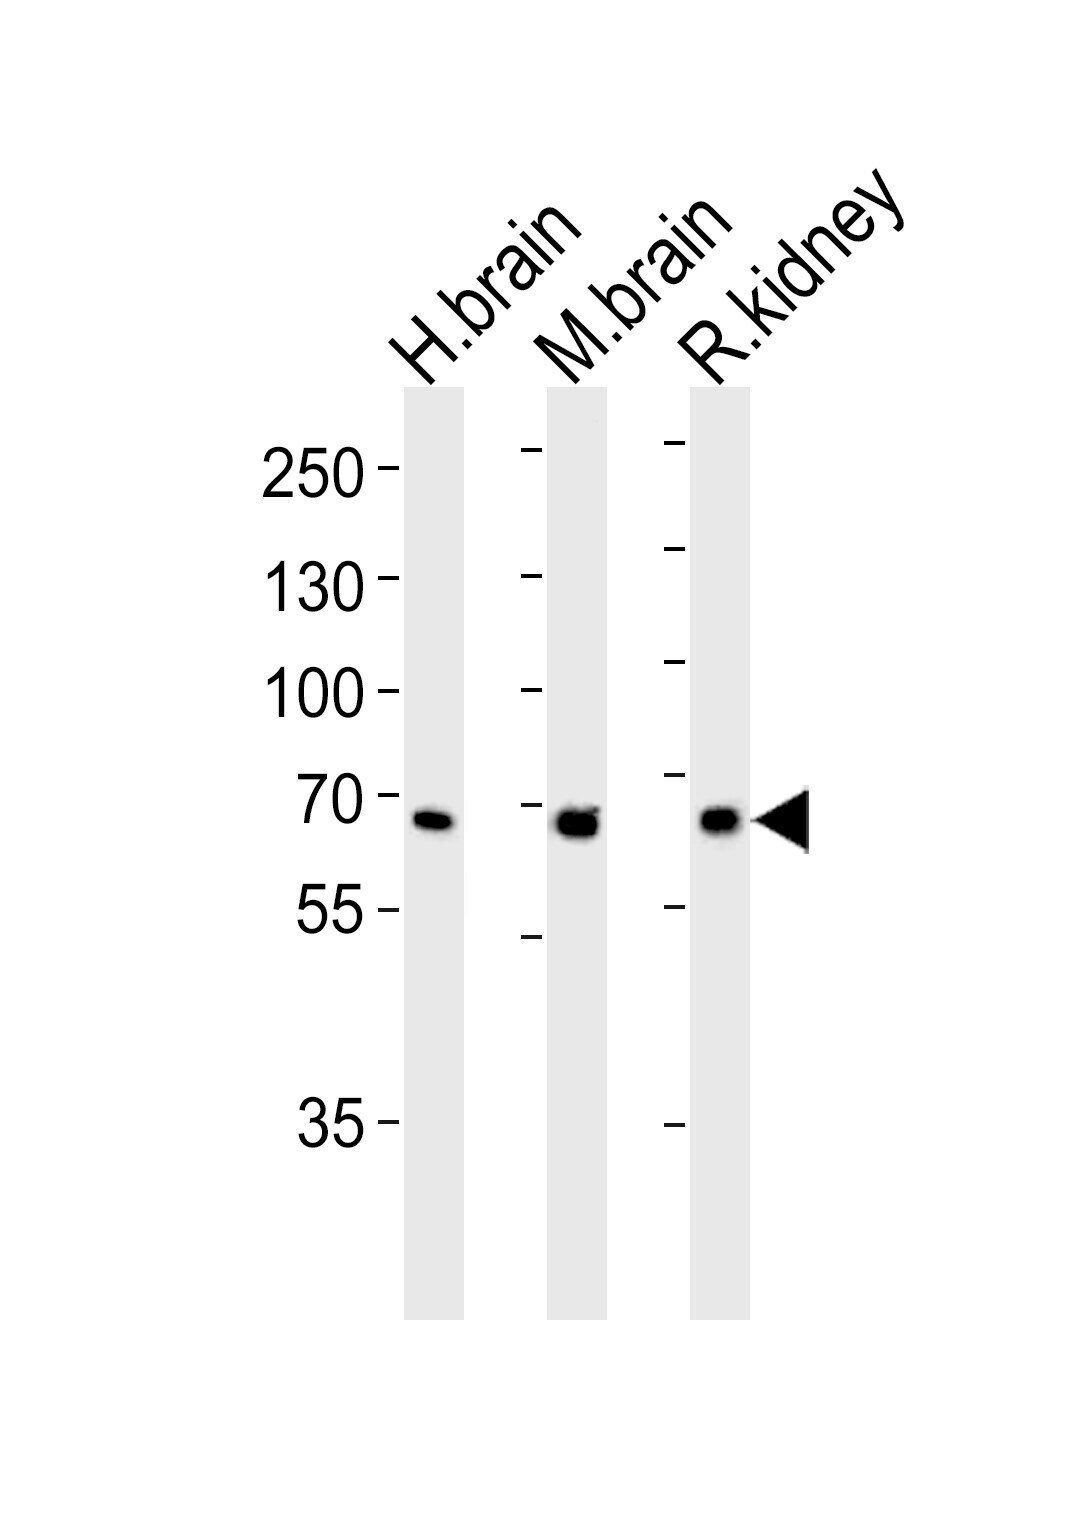
- Western blot analysis of Glutaminase in various lysates. Samples were incubated with Glutaminase polyclonal antibody (Product # PA5-35365) using a dilution of 1:2,000 followed by Goat Anti-Rabbit IgG, (H+L), Peroxidase conjugated at a dilution of 1:10,000. Lysates/proteins: 20 µg per lane. Lane 1: human brain lysate; Lane 2: human kidney lysate; Lane 3: mouse brain lysate. Predicted band size: 73 kDa. Blocking/Dilution buffer: 5% NFDM/TBST.

- Submitted by
- Invitrogen Antibodies (provider)
- Main image
- Experimental details
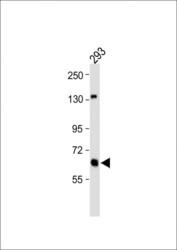
- Western blot analysis of Glutaminase in 293 whole cell lysate. Samples were incubated with Glutaminase polyclonal antibody (Product # PA5-35365) using a dilution of 1:1,000 followed by Goat Anti-Rabbit IgG, (H+L), Peroxidase conjugated at a dilution of 1:10,000. Lysates/proteins: 20 µg per lane.

- Submitted by
- Invitrogen Antibodies (provider)
- Main image

- Experimental details
- Western blot analysis of Glutaminase in rat kidney tissue lysate. Samples were incubated with Glutaminase polyclonal antibody (Product # PA5-35365) using a dilution of 1:1,000 followed by goat anti-rabbit IgG H&L (HRP) at a dilution of 1:5,000. Lysates at 35 µg per lane.
Supportive validation
- Submitted by
- Invitrogen Antibodies (provider)
- Main image
- Experimental details
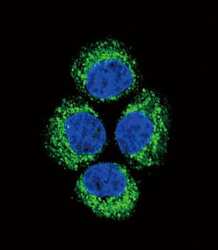
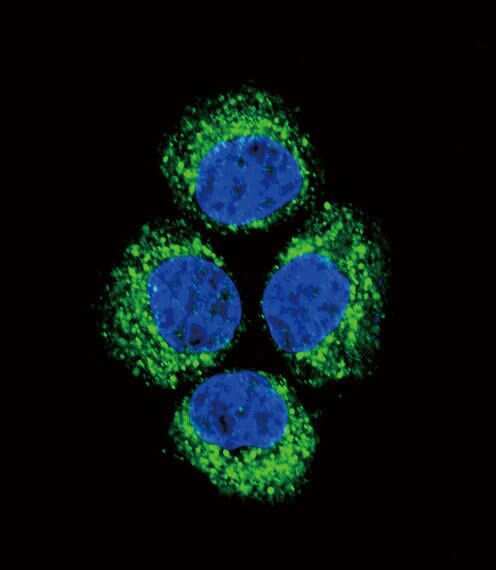
- Immunofluorescent analysis of GLS in Hela cells using a GLS polyclonal antibody (Product # PA5-35365) followed by detection using a fluorescent conjugated secondary antibody (green). Nuclei were stained with Dapi (blue).
- Submitted by
- Invitrogen Antibodies (provider)
- Main image
- Experimental details
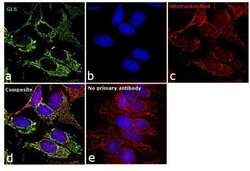
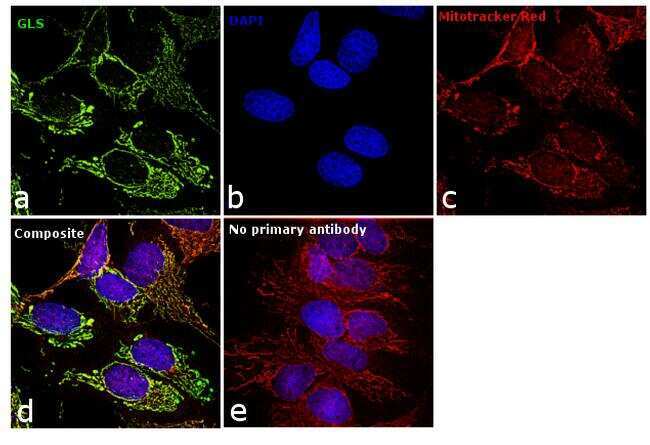
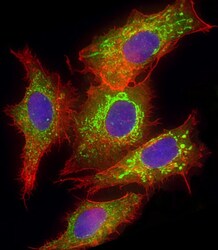
- Immunofluorescence analysis of GLS was performed using 70% confluent log phase Hep G2 cells. The cells were fixed with 4% paraformaldehyde for 10 minutes, permeabilized with 0.1% Triton™ X-100 for 15 minutes, and blocked with 1% BSA for 1 hour at room temperature. The cells were labeled with GLS Polyclonal Antibody (Product # PA5-35365) at 1:50 dilution in 0.1% BSA, incubated at 4 degree Celsius overnight and then labeled with Goat anti-Rabbit IgG (H+L) Superclonal™ Secondary Antibody, Alexa Fluor® 488 conjugate (Product # A27034) at a dilution of 1:2000 for 45 minutes at room temperature (Panel a: green). Nuclei (Panel b: blue) were stained with SlowFade® Gold Antifade Mountant with DAPI (Product # S36938). Mitochondria (Panel c: red) was stained with Mitotracker Red CMXRos (Product # M7512). Panel d represents the merged image showing mitochondrial localization. Panel e represents control cells with no primary antibody to assess background. The images were captured at 60X magnification.
- Submitted by
- Invitrogen Antibodies (provider)
- Main image
- Experimental details
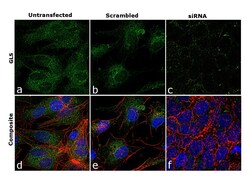
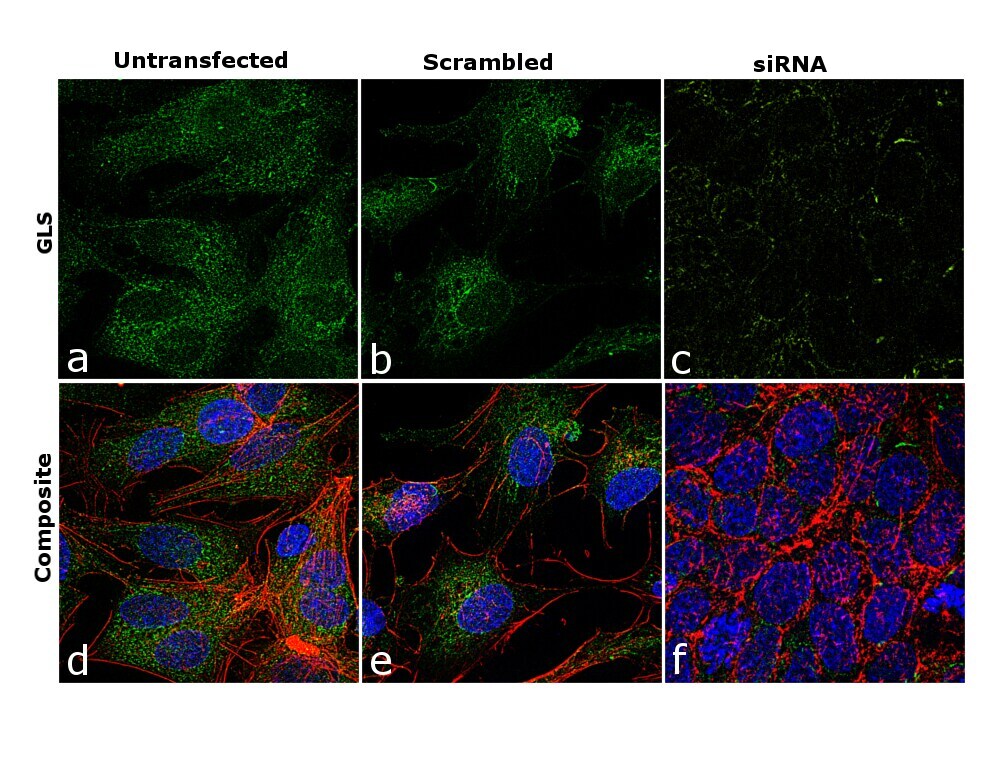
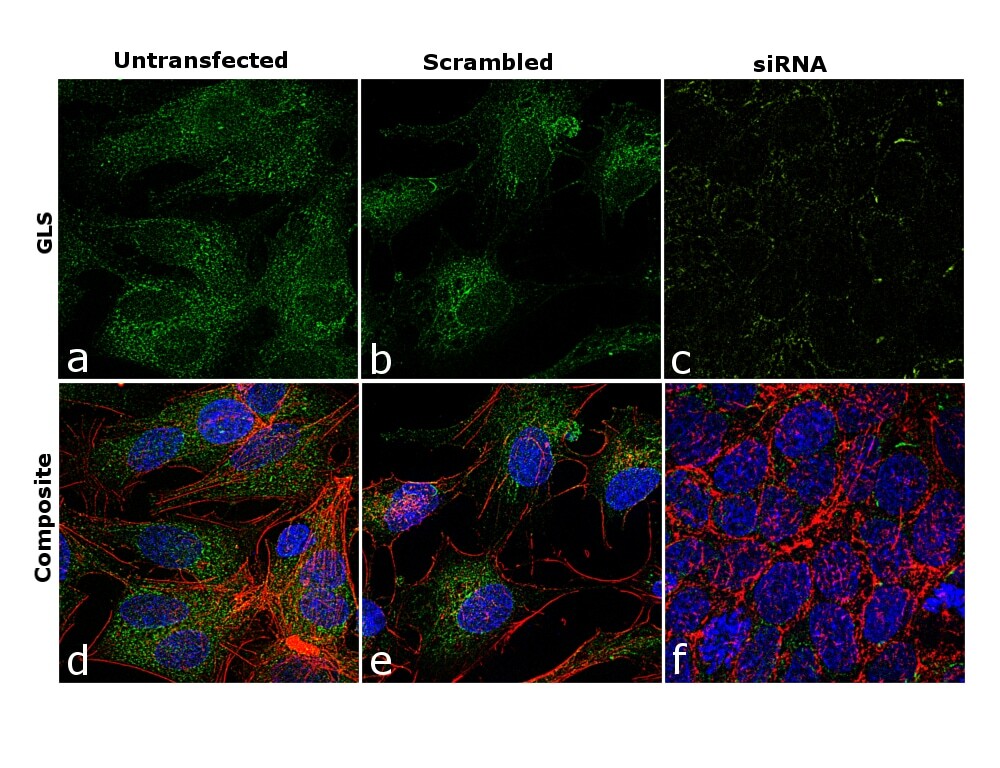
- Knockdown of GLS was achieved by transfecting Hep G2 cells with GLS specific siRNAs (Silencer® select Product # s5839, s5840). Immunofluorescence analysis was performed using untransfected Hep G2 cells (panels a, d), transfected with non-specific scrambled siRNA (panels b,e) and transfected with GLS specific siRNAs (panel c,f). Cells were fixed, permeabilized, and probed with GLS Polyclonal Antibody (Product # PA5-35365, 1:50 dilution), followed by labelling with Goat anti-Rabbit IgG (H+L) Superclonal™ Secondary Antibody, Alexa Fluor® 488 conjugate (Product # A27034; 1:2000 dilution) for 45 minutes at room temperature. Nuclei (blue) were stained using ProLong™ Diamond Antifade Mountant with DAPI (Product # P36962) and Rhodamine Phalloidin (Product # R415, 1:300) was used for cytoskeletal F-actin (red) staining. Reduction of mitochondrial GLS expression was observed upon siRNA mediated knockdown (panel c,f), confirming the specificity of the antibody to GLS. The images were captured at 60X magnification.
- Submitted by
- Invitrogen Antibodies (provider)
- Main image
- Experimental details
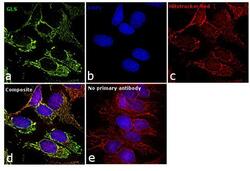
- Immunofluorescence analysis of GLS was performed using 70% confluent log phase Hep G2 cells. The cells were fixed with 4% paraformaldehyde for 10 minutes, permeabilized with 0.1% Triton™ X-100 for 15 minutes, and blocked with 1% BSA for 1 hour at room temperature. The cells were labeled with GLS Polyclonal Antibody (Product # PA5-35365) at 1:50 dilution in 0.1% BSA, incubated at 4 degree Celsius overnight and then labeled with Goat anti-Rabbit IgG (Heavy Chain) Superclonal™ Secondary Antibody, Alexa Fluor® 488 conjugate (Product # A27034) at a dilution of 1:2000 for 45 minutes at room temperature (Panel a: green). Nuclei (Panel b: blue) were stained with SlowFade® Gold Antifade Mountant with DAPI (Product # S36938). Mitochondria (Panel c: red) was stained with Mitotracker Red CMXRos (Product # M7512). Panel d represents the merged image showing mitochondrial localization. Panel e represents control cells with no primary antibody to assess background. The images were captured at 60X magnification.

- Submitted by
- Invitrogen Antibodies (provider)
- Main image

- Experimental details
- Knockdown of GLS was achieved by transfecting Hep G2 cells with GLS specific siRNAs (Silencer® select Product # s5839, s5840). Immunofluorescence analysis was performed using untransfected Hep G2 cells (panels a, d), transfected with non-specific scrambled siRNA (panels b,e) and transfected with GLS specific siRNAs (panel c,f). Cells were fixed, permeabilized, and probed with GLS Polyclonal Antibody (Product # PA5-35365, 1:50 dilution), followed by labelling with Goat anti-Rabbit IgG (Heavy Chain) Superclonal™ Secondary Antibody, Alexa Fluor® 488 conjugate (Product # A27034; 1:2000 dilution) for 45 minutes at room temperature. Nuclei (blue) were stained using ProLong™ Diamond Antifade Mountant with DAPI (Product # P36962) and Rhodamine Phalloidin (Product # R415, 1:300) was used for cytoskeletal F-actin (red) staining. Reduction of mitochondrial GLS expression was observed upon siRNA mediated knockdown (panel c,f), confirming the specificity of the antibody to GLS. The images were captured at 60X magnification.
- Submitted by
- Invitrogen Antibodies (provider)
- Main image
- Experimental details
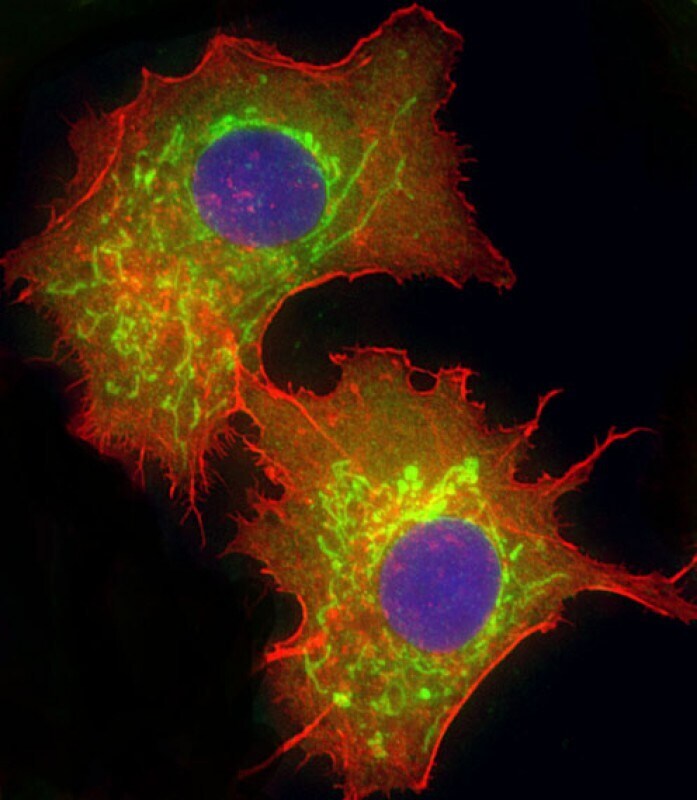
- Immunocytochemistry analysis of Glutaminase in HepG2 cells. Samples were incubated with Glutaminase polyclonal antibody (Product # PA5-35365) using a dilution of 1:25 followed by Dylight® 488-conjugated goat anti-rabbit IgG at a dilution of 1:200 (green). Cells were 4% paraformaldehyde-fixed and 0.1% Triton X-100 permeabilized. Immunofluorescence image showing mitochondrion staining on HepG2 cell line. Cytoplasmic actin is detected with Dylight® 554 Phalloidin at 1:100 dilution (red). The nuclear counter stain is DAPI (blue).

- Submitted by
- Invitrogen Antibodies (provider)
- Main image

- Experimental details
- Immunocytochemistry analysis of Glutaminase in HepG2 cells. Samples were incubated with Glutaminase polyclonal antibody (Product # PA5-35365) using a dilution of 1:25 followed by Dylight® 488-conjugated goat anti-rabbit IgG at a dilution of 1:200 (green). Cells were 4% paraformaldehyde-fixed and 0.1% Triton X-100 permeabilized. Immunofluorescence image showing mitochondrion staining on HepG2 cell line. Cytoplasmic actin is detected with Dylight® 554 Phalloidin at 1:100 dilution (red). The nuclear counter stain is DAPI (blue).
- Submitted by
- Invitrogen Antibodies (provider)
- Main image
- Experimental details
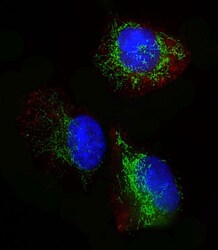
- Immunocytochemistry analysis of Glutaminase in U-251 MG cells. Samples were incubated with Glutaminase polyclonal antibody (Product # PA5-35365) using a dilution of 1:25 followed by Dylight® 488-conjugated goat anti-Rabbit IgG at a dilution of 1:200 (green). Cells were 4% paraformaldehyde-fixed, 0. 1% Triton X-100 permeabilized. Immunofluorescence image showing Cytoplasm staining on U-251 MG cell line. Cytoplasmic actin is detected with Dylight® 554 Phalloidin(red). The nuclear counter stain is DAPI (blue).

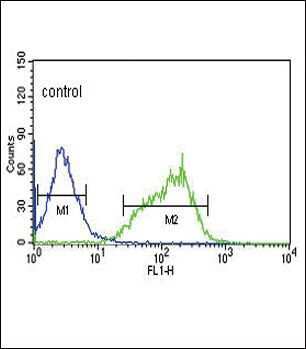
Supportive validation
- Submitted by
- Invitrogen Antibodies (provider)
- Main image
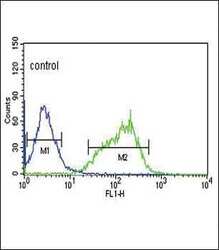
- Experimental details
- Flow cytometry analysis of GLS in HepG2 cells (right) compared to a negative control (left) using a GLS polyclonal antibody (Product # PA5-35365) followed by detection using a FITC-conjugated goat-anti-rabbit secondary antibody.
Supportive validation
- Submitted by
- Invitrogen Antibodies (provider)
- Main image

- Experimental details
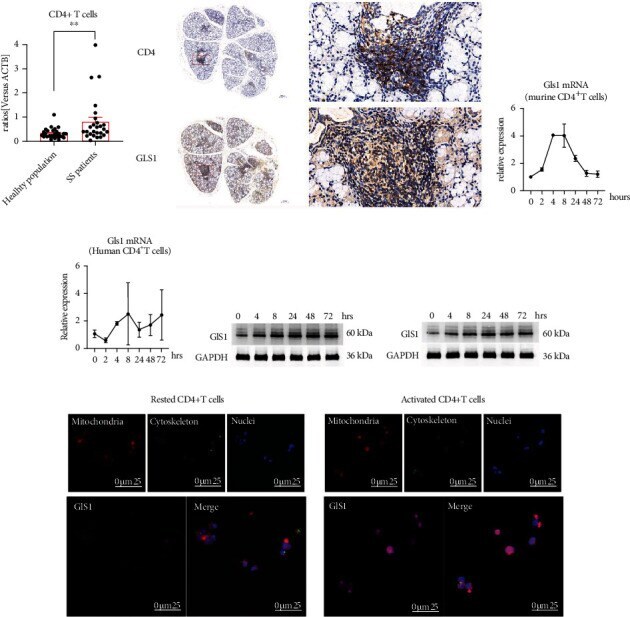
- Figure 1 Gls1 was upregulated in SS patients and could be induced upon activation. (a) Expression of Gls1 in circulating CD4+ T cells obtained from healthy individuals and SS patients. n > 25. (b) Immunohistochemical staining of CD4-positive cells and Gls1-positive cells in the labial glands of SS patients. (c) qRT-PCR analysis of Gls1 mRNA expression in murine CD4+ T cells simulated with anti-CD3 and anti-CD28 antibodies in a time-dependent manner. (d) qRT-PCR analysis of Gls1 mRNA expression in human purified circulating CD4+ T cells simulated with anti-CD3 and anti-CD28 antibodies in a time-dependent manner. (e) Representative Western blot pictures of Gls1 protein expression in human purified circulating CD4+ T cells simulated with anti-CD3 and anti-CD28 antibodies. (f) Representative Western blot pictures of Gls1 protein expression in murine splenic CD4+ T cells simulated with anti-CD3 and anti-CD28 antibodies. (g) Representative picture of Gls1 expression and location in murine CD4+ T cells under a confocal microscope. Blue light indicates the position of nuclei; green light indicates the position of the cytoskeleton; red light indicates the position of mitochondria; violet light indicates the position and strength of Gls1. Summary data are presented as ** p < 0.001 with unpaired two-tailed Student's t -tests.