Explore
 Validate
 Learn
Learn Flow cytometry
Antibody data
- Antibody Data
- Antigen structure
- References [6]
- Comments [0]
- Validations
- Flow cytometry [2]
- Other assay [5]
Submit
Validation data
Reference
Comment
Report error
- Product number
- 46-9883-42 - Provider product page

- Provider
- Invitrogen Antibodies
- Product name
- HELIOS Monoclonal Antibody (22F6), PerCP-eFluor™ 710, eBioscience™
- Antibody type
- Monoclonal
- Antigen
- Other
- Description
- Description: This 22F6 monoclonal antibody reacts with human, mouse and canine Helios. Helios is a zinc-finger transcription factor first identified for its similarity to Ikaros. It is expressed in hematopoietic stem cells in both the embryo and adult mice. While the highest expression is found in regulatory T cells, Helios is not expressed in mature B cells, dendritic cells or myeloid cells. Helios can form a homodimer as well as heterodimerize with other Ikaros family members to regulate transcription. Eight isoforms of Helios exist, some of which possess a dominant-negative function that has also been found to be upregulated in lymphoid malignancies, including T-acute lymphoblastic leukemia. 22F6 has been reported to cross react with rat Helios. Applications Reported: This 22F6 antibody has been reported for use in intracellular staining followed by flow cytometric analysis. Applications Tested: This 22F6 antibody has been pre-titrated and tested by intracellular staining and flow cytometric analysis of mouse lymph node cells using the using the Foxp3/Transcription Factor Buffer Set (Product # 00-5523-00) and protocol. Please see BestProtocols® Section (Staining intracellular Antigens for Flow Cytometry) for staining protocol (refer to Protocol B: One-step protocol for intracellular (nuclear) proteins). This can be used at 5 µL (0.00375 µg) per test. A test is defined as the amount (µg) of antibody that will stain a cell sample in a final volume of 100 µL. Cell number should be determined empirically but can range from 10^5 to 10^8 cells/test. PerCP-eFluor® 710 emits at 710 nm and is excited with the blue laser (488 nm); it can be used in place of PerCP-Cyanine5.5. We recommend using a 710/50 bandpass filter, however, the 695/40 bandpass filter is an acceptable alternative. Please make sure that your instrument is capable of detecting this fluorochrome. Fixation: Samples can be stored in IC Fixation Buffer (Product # 00-8222) (100 µL cell sample + 100 µL IC Fixation Buffer) or 1-step Fix/Lyse Solution (Product # 00-5333) for up to 3 days in the dark at 4°C with minimal impact on brightness and FRET efficiency/compensation. Some generalizations regarding fluorophore performance after fixation can be made, but clone specific performance should be determined empirically. Excitation: 488 nm; Emission: 710 nm; Laser: Blue Laser. Filtration: 0.2 µm post-manufacturing filtered.
- Reactivity
- Human, Mouse, Canine
- Isotype
- IgG
- Antibody clone number
- 22F6
- Vial size
- 100 Tests
- Concentration
- 5 µL/Test
- Storage
- 4°C, store in dark, DO NOT FREEZE!
Submitted references Adiponectin/AdipoR1 Axis Promotes IL-10 Release by Human Regulatory T Cells.
Notch4 signaling limits regulatory T-cell-mediated tissue repair and promotes severe lung inflammation in viral infections.
Potential therapeutic effects of interleukin-35 on the differentiation of naïve T cells into Helios(+)Foxp3(+) Tregs in clinical and experimental acute respiratory distress syndrome.
Distinct actions of the fermented beverage kefir on host behaviour, immunity and microbiome gut-brain modules in the mouse.
B7-CD28 co-stimulation modulates central tolerance via thymic clonal deletion and Treg generation through distinct mechanisms.
Hypercholesterolemia Enhances T Cell Receptor Signaling and Increases the Regulatory T Cell Population.
Ramos-Ramírez P, Malmhäll C, Tliba O, Rådinger M, Bossios A
Frontiers in immunology 2021;12:677550
Frontiers in immunology 2021;12:677550
Notch4 signaling limits regulatory T-cell-mediated tissue repair and promotes severe lung inflammation in viral infections.
Harb H, Benamar M, Lai PS, Contini P, Griffith JW, Crestani E, Schmitz-Abe K, Chen Q, Fong J, Marri L, Filaci G, Del Zotto G, Pishesha N, Kolifrath S, Broggi A, Ghosh S, Gelmez MY, Oktelik FB, Cetin EA, Kiykim A, Kose M, Wang Z, Cui Y, Yu XG, Li JZ, Berra L, Stephen-Victor E, Charbonnier LM, Zanoni I, Ploegh H, Deniz G, De Palma R, Chatila TA
Immunity 2021 Jun 8;54(6):1186-1199.e7
Immunity 2021 Jun 8;54(6):1186-1199.e7
Potential therapeutic effects of interleukin-35 on the differentiation of naïve T cells into Helios(+)Foxp3(+) Tregs in clinical and experimental acute respiratory distress syndrome.
Wang C, Xie K, Li K, Lin S, Xu F
Molecular immunology 2021 Apr;132:236-249
Molecular immunology 2021 Apr;132:236-249
Distinct actions of the fermented beverage kefir on host behaviour, immunity and microbiome gut-brain modules in the mouse.
van de Wouw M, Walsh AM, Crispie F, van Leuven L, Lyte JM, Boehme M, Clarke G, Dinan TG, Cotter PD, Cryan JF
Microbiome 2020 May 18;8(1):67
Microbiome 2020 May 18;8(1):67
B7-CD28 co-stimulation modulates central tolerance via thymic clonal deletion and Treg generation through distinct mechanisms.
Watanabe M, Lu Y, Breen M, Hodes RJ
Nature communications 2020 Dec 8;11(1):6264
Nature communications 2020 Dec 8;11(1):6264
Hypercholesterolemia Enhances T Cell Receptor Signaling and Increases the Regulatory T Cell Population.
Mailer RKW, Gisterå A, Polyzos KA, Ketelhuth DFJ, Hansson GK
Scientific reports 2017 Nov 15;7(1):15655
Scientific reports 2017 Nov 15;7(1):15655
No comments: Submit comment
Supportive validation
- Submitted by
- Invitrogen Antibodies (provider)
- Main image
- Experimental details
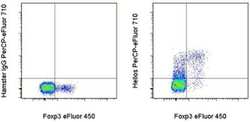
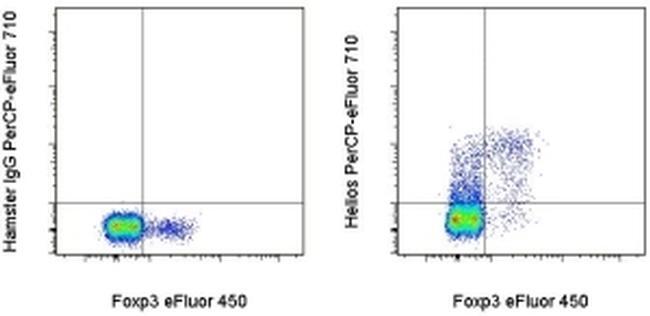
- Intracellular staining of BALB/c lymph node cells with Anti-Mouse/Rat Foxp3 eFluor® 450 (Product # 48-5773-82) and Armenian Hamster IgG Isotype Control PerCP-eFluor® 710 (Product # 46-4888-82) (left) or Anti-Helios PerCP-eFluor® 710 (right) using the Foxp3/Transcription Factor Buffer Set (Product # 00-5523-00) and protocol. Cells in the lymphocyte gate were used for analysis.
- Submitted by
- Invitrogen Antibodies (provider)
- Main image
- Experimental details
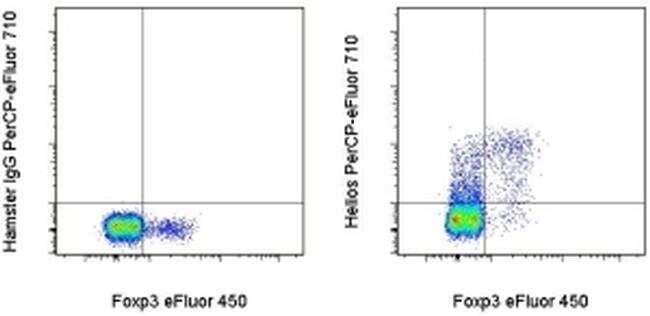
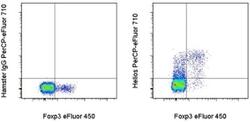
- Intracellular staining of BALB/c lymph node cells with Anti-Mouse/Rat Foxp3 eFluor® 450 (Product # 48-5773-82) and Armenian Hamster IgG Isotype Control PerCP-eFluor® 710 (Product # 46-4888-82) (left) or Anti-Helios PerCP-eFluor® 710 (right) using the Foxp3/Transcription Factor Buffer Set (Product # 00-5523-00) and protocol. Cells in the lymphocyte gate were used for analysis.
Supportive validation
- Submitted by
- Invitrogen Antibodies (provider)
- Main image
- Experimental details
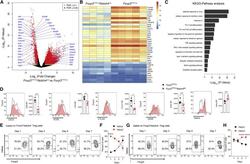
- Figure 5 Notch4 deficiency reprograms the lung Treg cell transcriptome of poly(I:C)-treated mice (A-C) Volcano plot (A), heatmap (B), and pathway analysis (C) of gene transcripts of lung Treg cells isolated from Foxp3 YFPCre and Foxp3 YFPCre Notch4 Delta/Delta mice treated with poly(I:C) (n = 4 and n = 5, respectively). (D) Flow cytometry histograms and graphical representation of lung tissue Treg cell expression of CD25, Helios, CTLA4, ICOS, and OX40 in Foxp3 YFPCre and Foxp3 YFPCre Notch4 Delta/Delta mice sampled on day 7 after poly(I:C) treatment (n = 5 for each time point). (E-H) Flow cytometry analysis (E and G) and graphical representation (F and H) of Helios expression in Foxp3 + Notch4 + and Foxp3 + Notch4 - lung tissue Treg cells in Foxp3 YFPCre mice sampled at the indicated dates after poly(I:C) treatment (n = 5 for each time point). Each symbol represents one mouse. Numbers in flow plots indicate percentages. Error bars indicate SEM. Statistical tests: pairwise comparisons of differential gene expression were computed using DESeq2 (A-C); Student''s unpaired two-tailed t test (D) and two-way ANOVA with Sidak''s post hoc analysis (F and H). * p < 0.05, ** p < 0.01, *** p < 0.001, **** p < 0.0001.

- Submitted by
- Invitrogen Antibodies (provider)
- Main image
- Experimental details
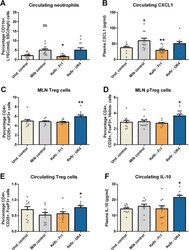
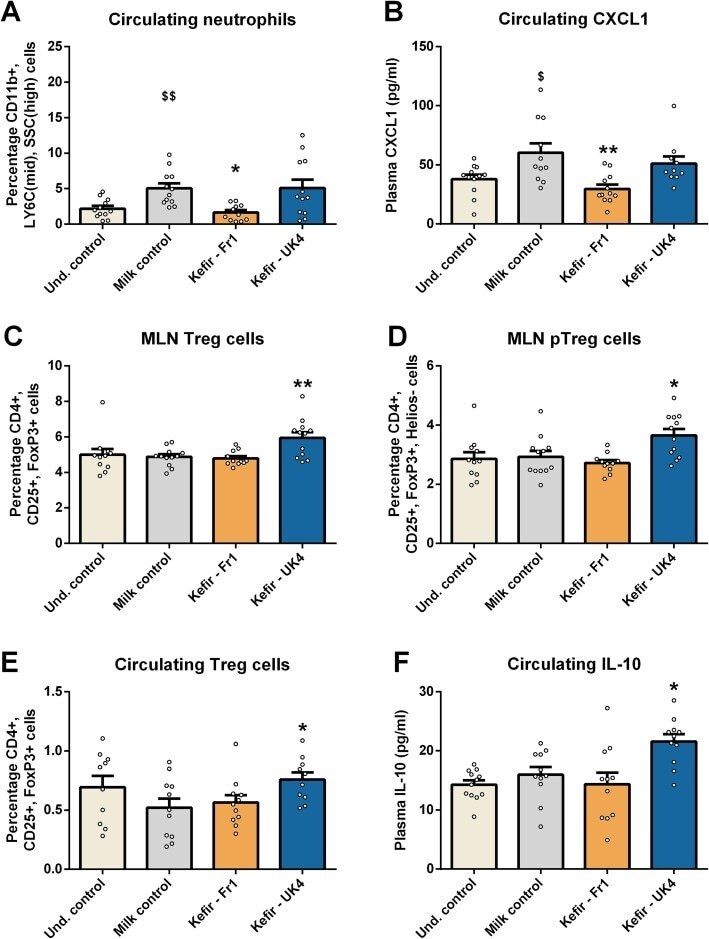
- Fig. 3 UK4 increases Treg cells levels, while Fr1 decreases neutrophil levels. T regulatory cells (CD4+, CD25+, FoxP3+) were assessed in mesenteric lymph nodes (MLNs) ( a ) and were subsequently analysed for Helios expression ( b ), to investigate their origin as Helios+ cells exclusively originate in the thymus. Blood was also assessed for Treg cell levels ( c ), and plasma interleukin 10 (IL-10) levels ( d ). Similarly, neutrophil (CD11b+, LY6C mid , SSC high and CXCL1 levels were also investigated in peripheral blood ( e , f ). All data were normally distributed and analysed using a one-way ANOVA, followed by a Dunnett's post hoc test. Significant differences are depicted as * p < 0.05, ** p < 0.01; milk control compared to Kefir supplementation, $ p < 0.05 and $$ p < 0.01; undisturbed control compared to milk control. All data are expressed as mean +- SEM ( n = 11-12). Dots on each graph represent individual animals
- Submitted by
- Invitrogen Antibodies (provider)
- Main image

- Experimental details
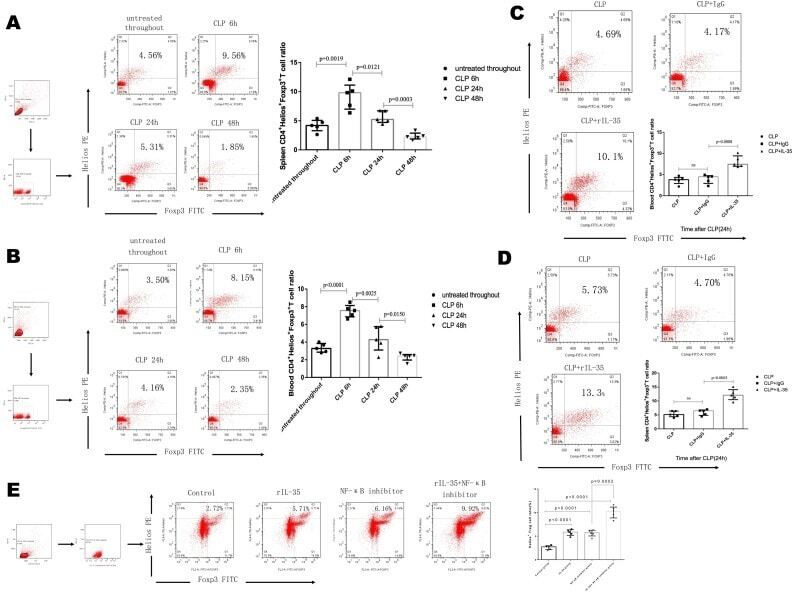
- Fig. 6 C57BL/5 mice were assigned to the untreated group, CLP (6 h) group, CLP (24 h) group, CLP (48 h) group, CLP + IgG group and CLP + IL-35 group. Each group had n = 5, the indicators of each mouse were repeatedly tested 3 times, and the best data were selected as the representative data. (A, B) T cells were isolated from mouse spleens or peripheral blood. The frequency of Foxp3+Helios + Treg cells was subsequently determined by flow cytometry, and the results reflect five mice per time point. Foxp3+Helios + Treg cells gradually decreased in the blood and spleen with time in CLP-induced ARDS. (C, D) Treatment with recombinant IL-35 after CLP challenge restored Foxp3+Helios + Treg cells in the blood and spleens. (E) Naive CD4 + T lymphocytes induce the differentiation of CD4 + Foxp3+ Helios + T cells (Tregs) via the IL-35/NF-kappaB signalling pathway. The comparison between the two groups was performed by one-way ANOVA followed by LSD multiple comparisons test. Fig. 6
- Submitted by
- Invitrogen Antibodies (provider)
- Main image
- Experimental details
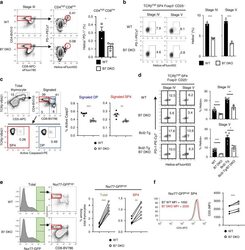
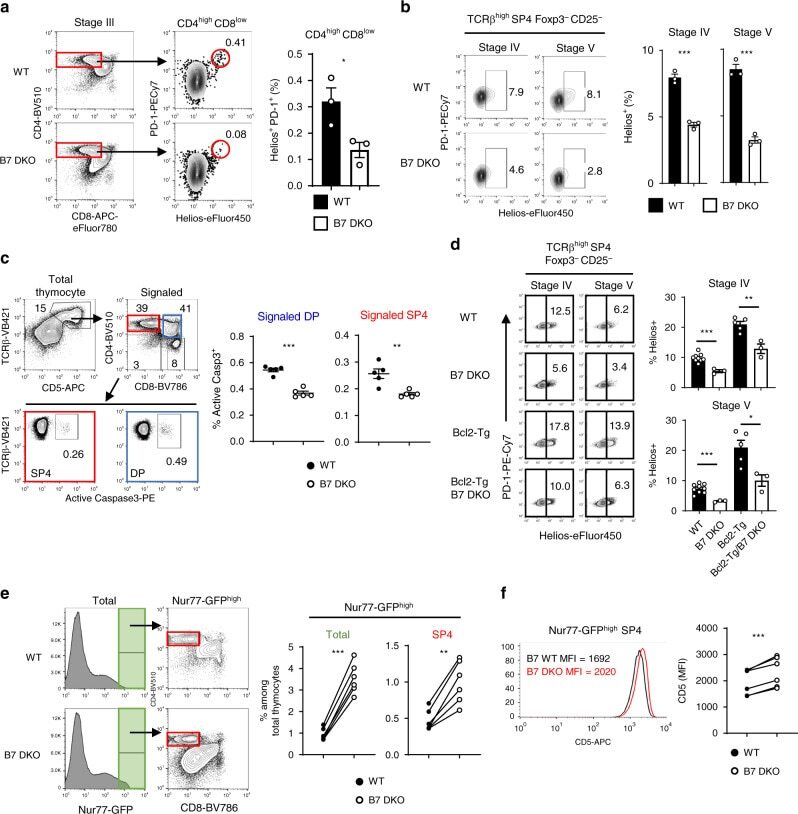
- Fig. 2 In the absence of B7-CD28 co-stimulation, the frequency of cells undergoing clonal deletion at DP and CD4SP stages is decreased. a - d WT and B7 DKO thymocytes were gated on developmental stages as defined by TCR and CD69 expression in Fig. 1 . a Frequency of clonally deleting cells (Helios + PD-1 high ) was decreased in Stage III (CD4 + CD8 low ) thymocytes in B7 DKO mice. Each group n = 3. Data are representative of three independent experiments. p = 0.0365. b Frequency of clonally deleting cells (Helios + ) was decreased in Stage IV and V SP4 Tconv (CD25/Foxp3 nega ) in B7 DKO mice. Each group n = 3. Data are representative of three independent experiments. Stage IV p = 0.0004, Stage V p = 0.0003. c Frequency of clonally deleting cells (Active Caspase3 + ) was decreased in TCR-signaled DP and SP cells in B7 DKO mice. Each group n = 5. Data are pooled results of two independent experiments. Signaled DP p < 0.0001, Signaled SP4 p = 0.0038. d Frequency of clonally deleting cells (Helios + ) was decreased in Stage IV and V SP4 Tconv (CD25/Foxp3 nega ) in Bcl2-Tg/B7 DKO mice. WT n = 9, B7 DKO n = 3, Bcl2-Tg n = 5, Bcl2-Tg/B7 DKO n = 3. Data are pooled results of three independent experiments. Stage IV (WT and B7DKO) p = 0.0003, Stage IV (Bcl2-Tg and Bcl2-Tg/B7DKO) p = 0.0037, Stage V (WT and B7DKO) p = 0.0008, Stage V (Bcl2-Tg and Bcl2-Tg/B7DKO) p = 0.020. e Nur77-GFP high SP4 cells were increased in B7 DKO mice. Left panel, representative FACS plot. Right panel, quantif
- Submitted by
- Invitrogen Antibodies (provider)
- Main image

- Experimental details
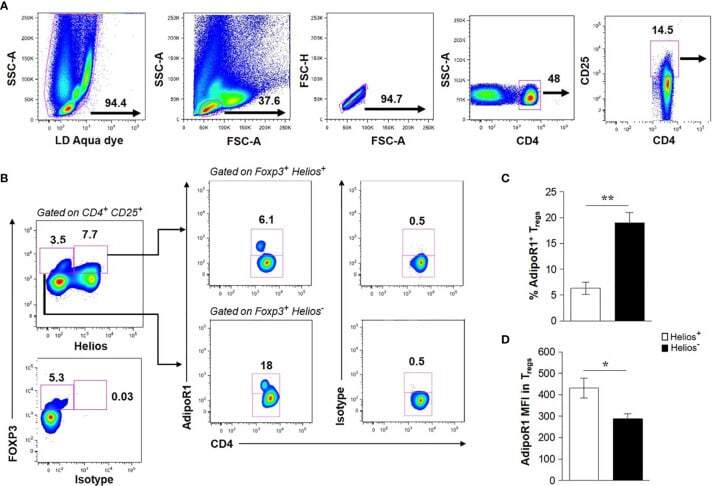
- Figure 1 Human Circulating FOXP3 + Tregs Express AdipoR1. Flow cytometry analysis of AdipoR1 expression in Treg subsets was performed in peripheral whole blood from healthy donors. (A) Gating strategy of human circulating CD4 + CD25 + T cells. Dead cells, positive for LD Aqua dye, were excluded and lymphocytes were gated. CD4 + T cells were gated from single cells (excluding of doublets, FSC-A vs FSC-H) and analyzed for CD25 expression. (B) Helios + and Helios - FOXP3 + Tregs were gated on CD4 + CD25 + cells and then analyzed for AdipoR1 expression. FACS plots are from a representative experiment. (C) Frequency of AdipoR1 + cells and (D) MFI (mean fluorescence intensity) AdipoR1 in Helios + and Helios - FOXP3 + Tregs. Data were obtained from four independent experiments and are shown as the mean +- SEM of n=5. Student's t-test, *P< 0.05 and **P< 0.01 .