Explore
 Validate
 Learn
Learn Western blot
 Immunohistochemistry
Antibody data
- Antibody Data
- Antigen structure
- References [1]
- Comments [0]
- Validations
- Immunohistochemistry [2]
- Other assay [1]
Submit
Validation data
Reference
Comment
Report error
- Product number
- PA5-79966 - Provider product page

- Provider
- Invitrogen Antibodies
- Product name
- SDHC Polyclonal Antibody
- Antibody type
- Polyclonal
- Antigen
- Synthetic peptide
- Description
- Reconstitute with 0.2 mL of distilled water to yield a concentration of 500 µg/mL. Positive Control - WB: Rat Liver Tissue, Mouse Liver Tissue, HELA whole cell. IHC: Rat Gaster Tissue, Human Gastric Cancer Tissue.
- Reactivity
- Human, Mouse, Rat
- Host
- Rabbit
- Isotype
- IgG
- Vial size
- 100 μg
- Concentration
- 500 μg/mL
- Storage
- -20°C
Submitted references Genome-wide CRISPR/Cas9 deletion screen defines mitochondrial gene essentiality and identifies routes for tumour cell viability in hypoxia.
Thomas LW, Esposito C, Morgan RE, Price S, Young J, Williams SP, Maddalena LA, McDermott U, Ashcroft M
Communications biology 2021 May 21;4(1):615
Communications biology 2021 May 21;4(1):615
No comments: Submit comment
Supportive validation
- Submitted by
- Invitrogen Antibodies (provider)
- Main image
- Experimental details
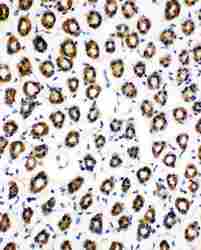
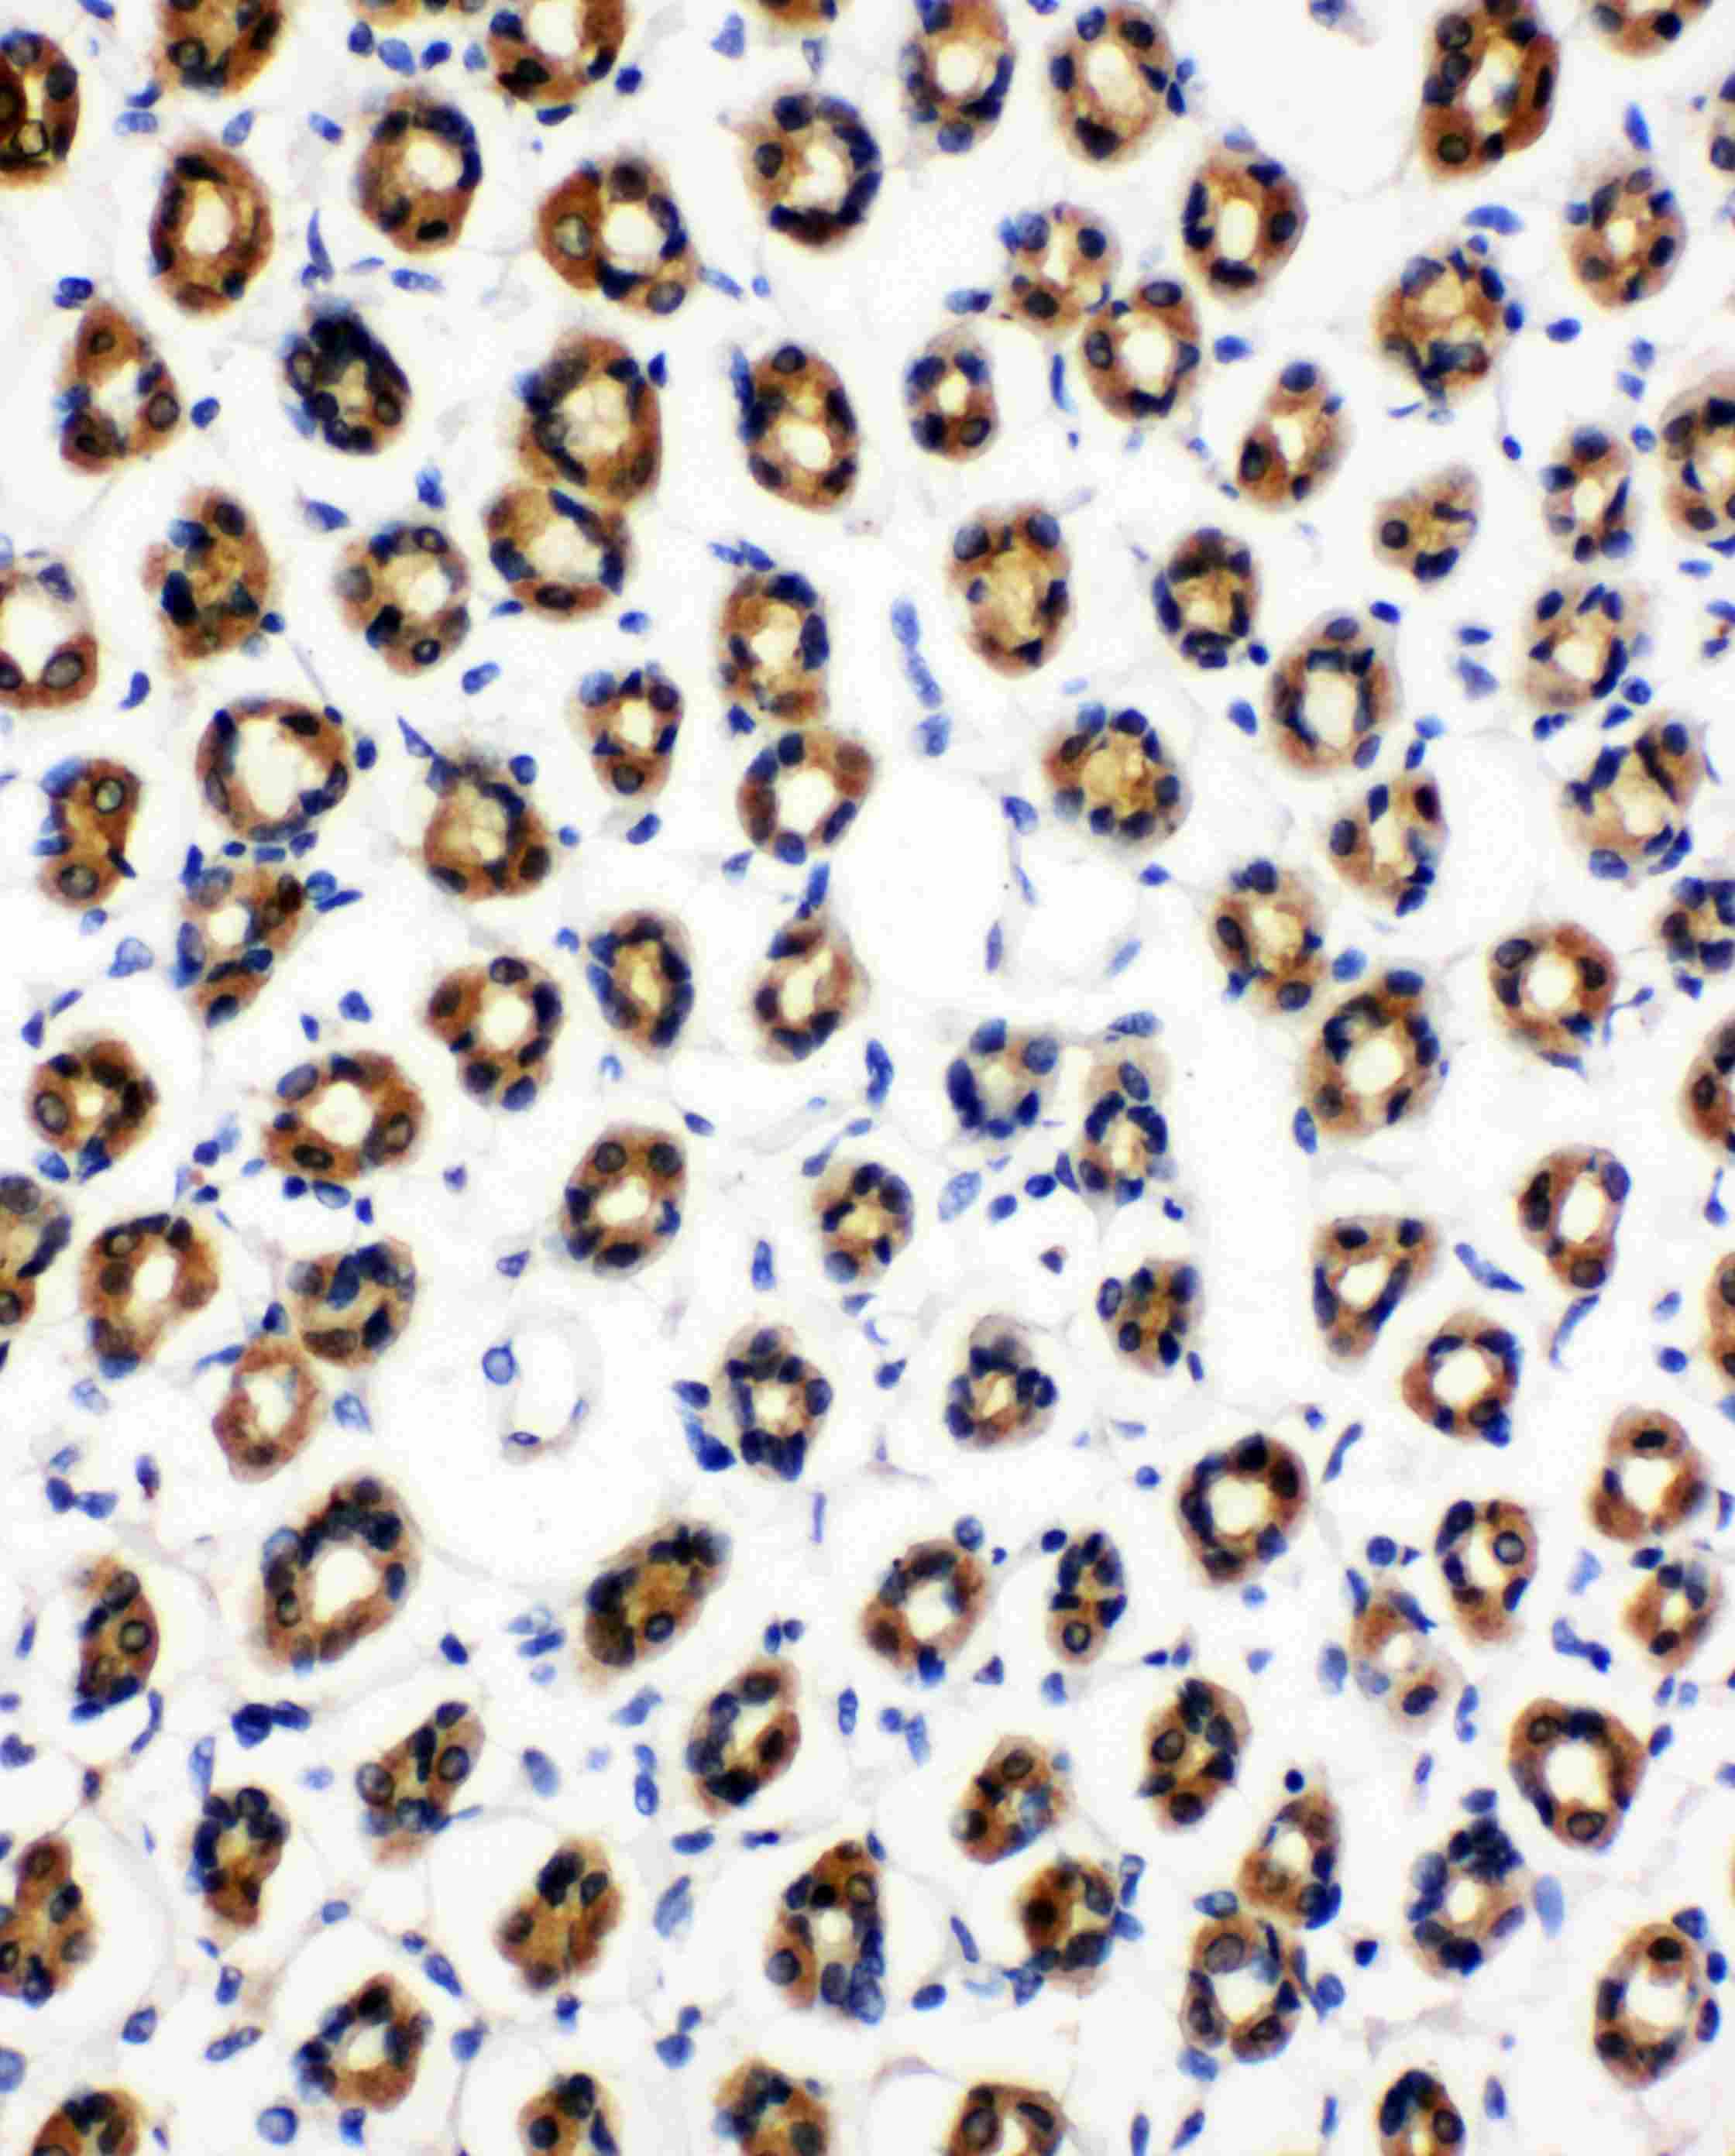
- Immunohistochemistry analysis of SDHC on paraffin-embedded rat gastric tissue. Sample was incubated with SDHC polyclonal antibody (Product# PA5-79966).
- Submitted by
- Invitrogen Antibodies (provider)
- Main image
- Experimental details
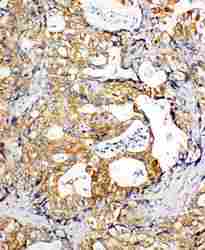
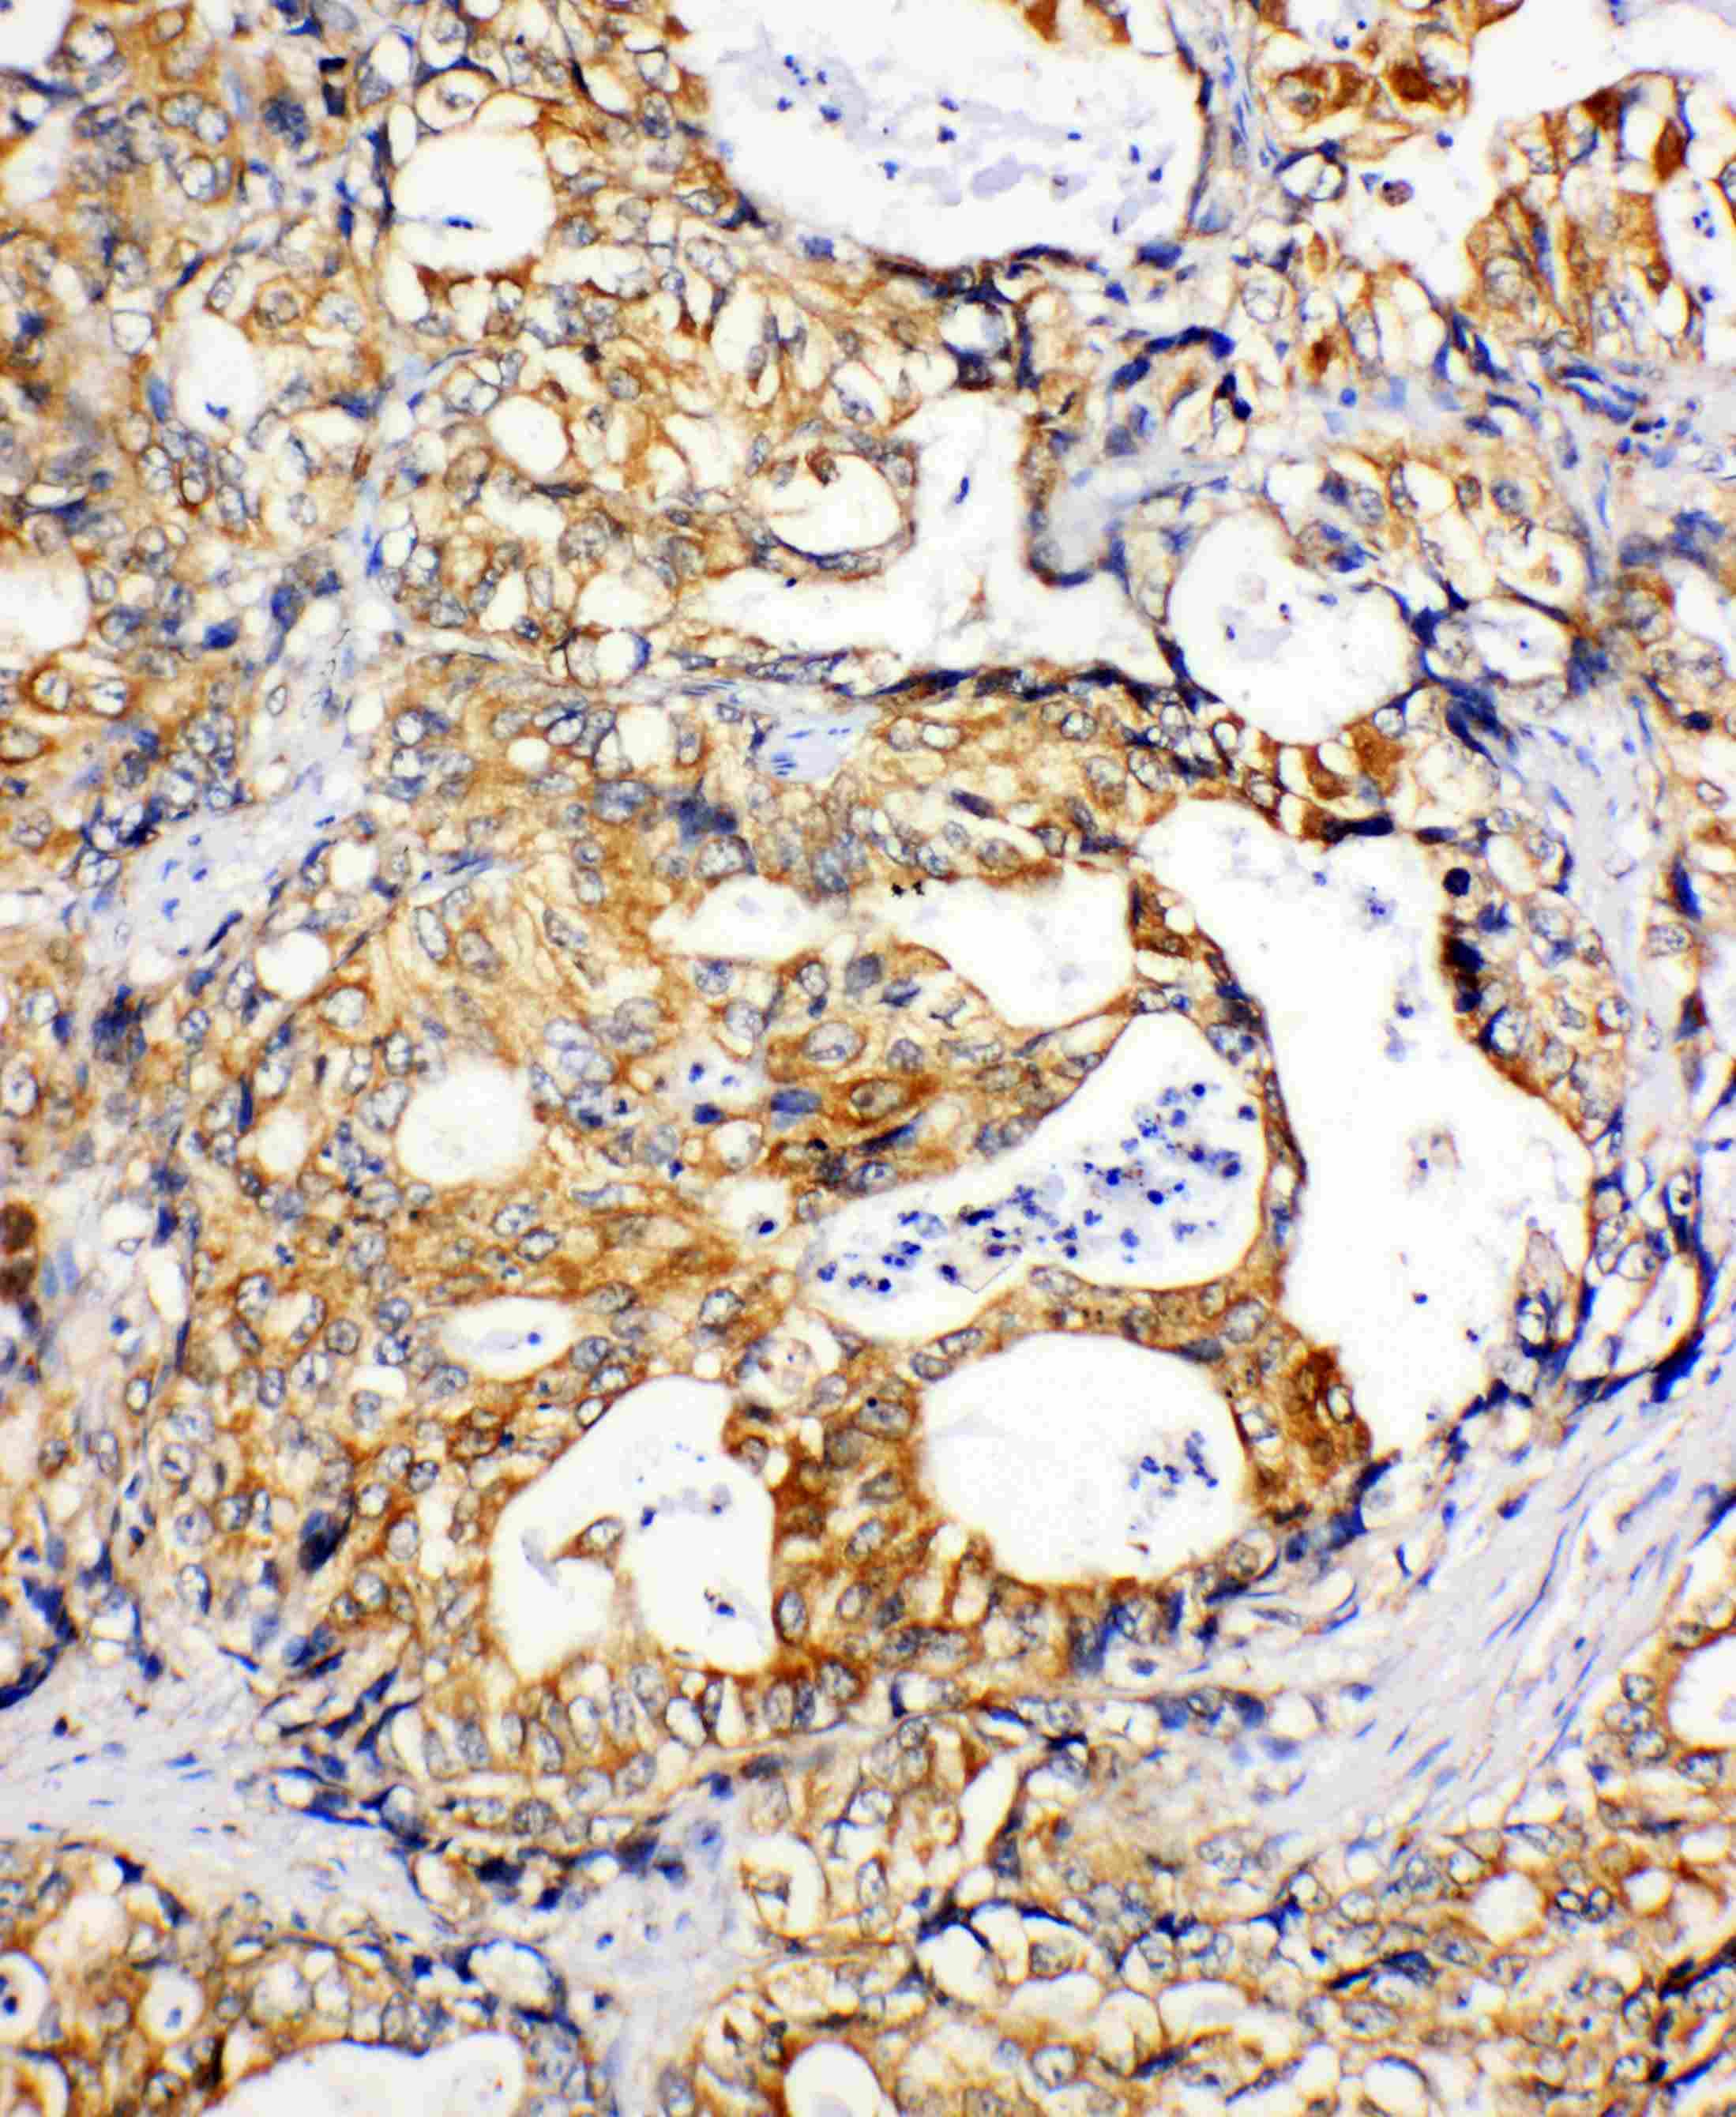
- Immunohistochemistry analysis of SDHC on paraffin-embedded human Gastric cancer tissue. Sample was incubated with SDHC polyclonal antibody (Product# PA5-79966).
Supportive validation
- Submitted by
- Invitrogen Antibodies (provider)
- Main image

- Experimental details
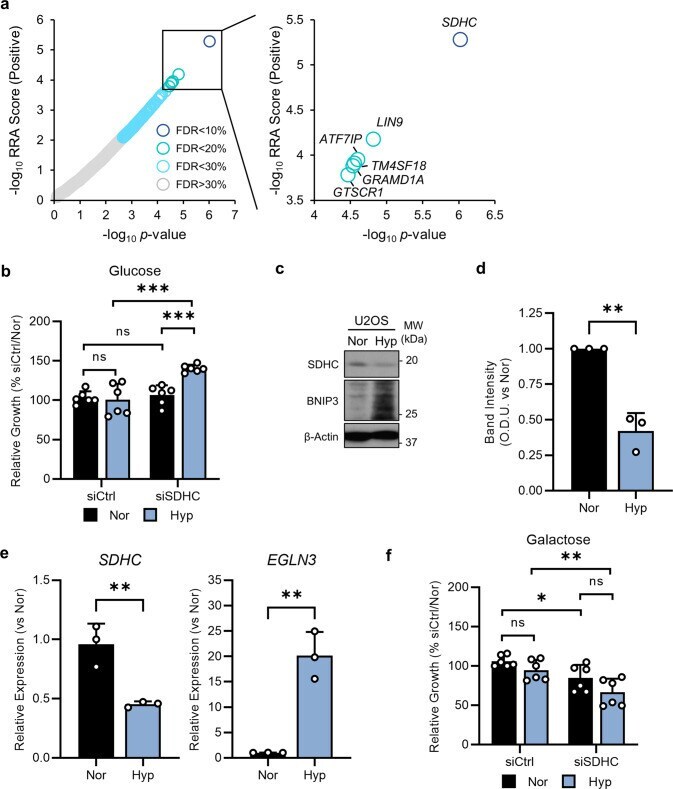
- Fig. 3 Loss of SDHC improves tumour cell growth in hypoxia. a Chart shows all genes with significantly enriched sgRNAs (robust rank aggregation (RRA) score, positive) in hypoxia-glucose at different FDR thresholds. b Chart shows relative growth of U2OS cells cultured for 5 days in normoxia or hypoxia (1% O 2 ) treated with non-targeting control siRNA (siCtrl) or siRNA targeting SDHC (siSDHC). n = 3. Mean +- S.D. ; n.s. not significant; *** p < 0.001. c Western blots show expression of SDHC, and BNIP3 in U2OS cells incubated for 5d in normoxia (Nor) or hypoxia (Hyp, 1% O 2 ). beta-Actin used as a loading control. d Chart shows the relative density of SDHC bands from samples in ( c ). n = 3; mean +- S.D. ; ** p < 0.01. e Charts show expression of SDHC and EGLN3 from U2OS cells incubated for 5d in normoxia or hypoxia (1% O 2 ). n = 3; mean +- S.D. ; ** p < 0.01. f Charts show relative growth of U2OS cells incubated for 5d in normoxia or hypoxia (1% O 2 ), in the presence of 25 mM galactose, treated with non-targeting control siRNA (siCtrl) or siRNA targeting SDHC (siSDHC). n = 3; mean +- S.D. ; n.s. not significant; * p < 0.05; ** p < 0.01.