Explore
 Validate
 Learn
Learn Western blot
 ELISA
ELISA Immunoprecipitation
Antibody data
- Antibody Data
- Antigen structure
- References [19]
- Comments [0]
- Validations
- Western blot [3]
- Flow cytometry [1]
- Other assay [10]
Submit
Validation data
Reference
Comment
Report error
- Product number
- 71-1200 - Provider product page

- Provider
- Invitrogen Antibodies
- Product name
- alpha Catenin Polyclonal Antibody
- Antibody type
- Polyclonal
- Antigen
- Other
- Reactivity
- Human, Mouse, Rat, Chicken/Avian, Xenopus
- Host
- Rabbit
- Isotype
- IgG
- Vial size
- 100 µg
- Concentration
- 0.25 mg/mL
- Storage
- -20°C
Submitted references Mechanochemical control of epidermal stem cell divisions by B-plexins.
Oxygen regulates epithelial stem cell proliferation via RhoA-actomyosin-YAP/TAZ signal in mouse incisor.
Knockout of SORBS2 Protein Disrupts the Structural Integrity of Intercalated Disc and Manifests Features of Arrhythmogenic Cardiomyopathy.
Shigella flexneri Disruption of Cellular Tension Promotes Intercellular Spread.
Src kinases relax adherens junctions between the neighbors of apoptotic cells to permit apical extrusion.
Snail induces epithelial cell extrusion by regulating RhoA contractile signalling and cell-matrix adhesion.
Telophase correction refines division orientation in stratified epithelia.
α-Catenin-dependent cytoskeletal tension controls Yap activity in the heart.
Tyrosine dephosphorylated cortactin downregulates contractility at the epithelial zonula adherens through SRGAP1.
Cell surface localization of α3β4 nicotinic acetylcholine receptors is regulated by N-cadherin homotypic binding and actomyosin contractility.
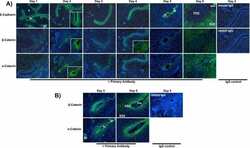
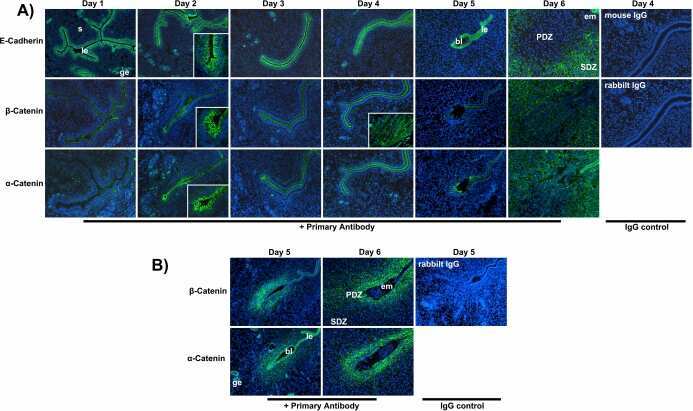
Adherens junction proteins in the hamster uterus: their contributions to the success of implantation.
Cadherin adhesion receptors orient the mitotic spindle during symmetric cell division in mammalian epithelia.
N-cadherin haploinsufficiency affects cardiac gap junctions and arrhythmic susceptibility.
Proliferation, cell cycle exit, and onset of terminal differentiation in cultured keratinocytes: pre-programmed pathways in control of C-Myc and Notch1 prevail over extracellular calcium signals.
E-cadherin suppression accelerates squamous cell carcinoma progression in three-dimensional, human tissue constructs.
Myofibroblast development is characterized by specific cell-cell adherens junctions.
Vinculin, VASP, and profilin are coordinately regulated during actin remodeling in epithelial cells, which requires de novo protein synthesis and protein kinase signal transduction pathways.
EpCAM is overexpressed in breast cancer and is a potential target for breast cancer gene therapy.
ROCK mediates thrombin's endothelial barrier dysfunction.
Jiang C, Javed A, Kaiser L, Nava MM, Xu R, Brandt DT, Zhao D, Mayer B, Fernández-Baldovinos J, Zhou L, Höß C, Sawmynaden K, Oleksy A, Matthews D, Weinstein LS, Hahn H, Gröne HJ, Graumann PL, Niessen CM, Offermanns S, Wickström SA, Worzfeld T
Nature communications 2021 Feb 26;12(1):1308
Nature communications 2021 Feb 26;12(1):1308
Oxygen regulates epithelial stem cell proliferation via RhoA-actomyosin-YAP/TAZ signal in mouse incisor.
Otsu K, Ida-Yonemochi H, Ikezaki S, Ema M, Hitomi J, Ohshima H, Harada H
Development (Cambridge, England) 2021 Feb 15;148(4)
Development (Cambridge, England) 2021 Feb 15;148(4)
Knockout of SORBS2 Protein Disrupts the Structural Integrity of Intercalated Disc and Manifests Features of Arrhythmogenic Cardiomyopathy.
Ding Y, Yang J, Chen P, Lu T, Jiao K, Tester DJ, Giudicessi JR, Jiang K, Ackerman MJ, Li Y, Wang DW, Lee HC, Wang DW, Xu X
Journal of the American Heart Association 2020 Sep;9(17):e017055
Journal of the American Heart Association 2020 Sep;9(17):e017055
Shigella flexneri Disruption of Cellular Tension Promotes Intercellular Spread.
Duncan-Lowey JK, Wiscovitch AL, Wood TE, Goldberg MB, Russo BC
Cell reports 2020 Nov 24;33(8):108409
Cell reports 2020 Nov 24;33(8):108409
Src kinases relax adherens junctions between the neighbors of apoptotic cells to permit apical extrusion.
Teo JL, Tomatis VM, Coburn L, Lagendijk AK, Schouwenaar IM, Budnar S, Hall TE, Verma S, McLachlan RW, Hogan BM, Parton RG, Yap AS, Gomez GA
Molecular biology of the cell 2020 Nov 1;31(23):2557-2569
Molecular biology of the cell 2020 Nov 1;31(23):2557-2569
Snail induces epithelial cell extrusion by regulating RhoA contractile signalling and cell-matrix adhesion.
Wee K, Hediyeh-Zadeh S, Duszyc K, Verma S, N Nanavati B, Khare S, Varma A, Daly RJ, Yap AS, Davis MJ, Budnar S
Journal of cell science 2020 Jul 6;133(13)
Journal of cell science 2020 Jul 6;133(13)
Telophase correction refines division orientation in stratified epithelia.
Lough KJ, Byrd KM, Descovich CP, Spitzer DC, Bergman AJ, Beaudoin GM 3rd, Reichardt LF, Williams SE
eLife 2019 Dec 13;8
eLife 2019 Dec 13;8
α-Catenin-dependent cytoskeletal tension controls Yap activity in the heart.
Vite A, Zhang C, Yi R, Emms S, Radice GL
Development (Cambridge, England) 2018 Mar 8;145(5)
Development (Cambridge, England) 2018 Mar 8;145(5)
Tyrosine dephosphorylated cortactin downregulates contractility at the epithelial zonula adherens through SRGAP1.
Liang X, Budnar S, Gupta S, Verma S, Han SP, Hill MM, Daly RJ, Parton RG, Hamilton NA, Gomez GA, Yap AS
Nature communications 2017 Oct 5;8(1):790
Nature communications 2017 Oct 5;8(1):790
Cell surface localization of α3β4 nicotinic acetylcholine receptors is regulated by N-cadherin homotypic binding and actomyosin contractility.
Brusés JL
PloS one 2013;8(4):e62435
PloS one 2013;8(4):e62435
Adherens junction proteins in the hamster uterus: their contributions to the success of implantation.
Luan L, Ding T, Stinnett A, Reese J, Paria BC
Biology of reproduction 2011 Nov;85(5):996-1004
Biology of reproduction 2011 Nov;85(5):996-1004
Cadherin adhesion receptors orient the mitotic spindle during symmetric cell division in mammalian epithelia.
den Elzen N, Buttery CV, Maddugoda MP, Ren G, Yap AS
Molecular biology of the cell 2009 Aug;20(16):3740-50
Molecular biology of the cell 2009 Aug;20(16):3740-50
N-cadherin haploinsufficiency affects cardiac gap junctions and arrhythmic susceptibility.
Li J, Levin MD, Xiong Y, Petrenko N, Patel VV, Radice GL
Journal of molecular and cellular cardiology 2008 Mar;44(3):597-606
Journal of molecular and cellular cardiology 2008 Mar;44(3):597-606
Proliferation, cell cycle exit, and onset of terminal differentiation in cultured keratinocytes: pre-programmed pathways in control of C-Myc and Notch1 prevail over extracellular calcium signals.
Kolly C, Suter MM, Müller EJ
The Journal of investigative dermatology 2005 May;124(5):1014-25
The Journal of investigative dermatology 2005 May;124(5):1014-25
E-cadherin suppression accelerates squamous cell carcinoma progression in three-dimensional, human tissue constructs.
Margulis A, Zhang W, Alt-Holland A, Crawford HC, Fusenig NE, Garlick JA
Cancer research 2005 Mar 1;65(5):1783-91
Cancer research 2005 Mar 1;65(5):1783-91
Myofibroblast development is characterized by specific cell-cell adherens junctions.
Hinz B, Pittet P, Smith-Clerc J, Chaponnier C, Meister JJ
Molecular biology of the cell 2004 Sep;15(9):4310-20
Molecular biology of the cell 2004 Sep;15(9):4310-20
Vinculin, VASP, and profilin are coordinately regulated during actin remodeling in epithelial cells, which requires de novo protein synthesis and protein kinase signal transduction pathways.
Quinlan MP
Journal of cellular physiology 2004 Aug;200(2):277-90
Journal of cellular physiology 2004 Aug;200(2):277-90
EpCAM is overexpressed in breast cancer and is a potential target for breast cancer gene therapy.
Osta WA, Chen Y, Mikhitarian K, Mitas M, Salem M, Hannun YA, Cole DJ, Gillanders WE
Cancer research 2004 Aug 15;64(16):5818-24
Cancer research 2004 Aug 15;64(16):5818-24
ROCK mediates thrombin's endothelial barrier dysfunction.
Carbajal JM, Gratrix ML, Yu CH, Schaeffer RC Jr
American journal of physiology. Cell physiology 2000 Jul;279(1):C195-204
American journal of physiology. Cell physiology 2000 Jul;279(1):C195-204
No comments: Submit comment
Supportive validation
- Submitted by
- Invitrogen Antibodies (provider)
- Main image
- Experimental details
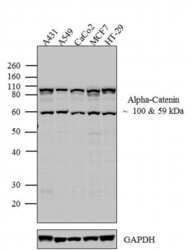
- Western blot analysis was performed on whole cell extracts (30 µg lysate) of A431 (Lane 1), A549 (Lane 2), CaCo2 (Lane 3), MCF7 (lane 4) and HT-29 (lane 5). The blots were probed with Anti-alpha Catenin Rabbit Polyclonal Antibody (Product # 71-1200, 1-2 µg/mL) and detected by chemiluminescence using Goat anti-Rabbit IgG (H+L) Superclonal™ Secondary Antibody, HRP conjugate (Product # A27036, 0.4 µg/mL, 1:2500 dilution). Two bands ~ 100 and 59 kDa corresponding to alpha Catenin was observed across cell lines tested. Known quantity of protein samples were electrophoresed using Novex® NuPAGE® 4-12 % Bis-Tris gel (Product # NP0322BOX), XCell SureLock™ Electrophoresis System (Product # EI0002) and Novex® Sharp Pre-Stained Protein Standard (Product # LC5800). Resolved proteins were then transferred onto a nitrocellulose membrane with iBlot® 2 Dry Blotting System (Product # IB21001). The membrane was probed with the relevant primary and secondary Antibody following blocking with 5 % skimmed milk. Chemiluminescent detection was performed using SuperSignal™ West Dura Extended Duration Substrate (Product # 34076).

- Submitted by
- Invitrogen Antibodies (provider)
- Main image

- Experimental details
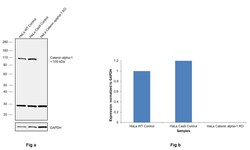
- Knockdown of alpha Catenin was achieved by transfecting A-431 with alpha Catenin specific siRNAs (Silencer® select Product # s3717, s3716). Western blot analysis (Fig. a) was performed using membrane extracts from the alpha Catenin knockdown cells (lane 3), non-specific scrambled siRNA transfected cells (lane 2) and untransfected cells (lane 1). The blots were probed with alpha Catenin Polyclonal Antibody (Product # 71-1200, 2 µg/mL) and Goat anti-Rabbit IgG (H+L) Superclonal™ Secondary Antibody, HRP conjugate (Product # A27036, 0.25 µg/mL, 1:4000 dilution). Densitometric analysis of this western blot is shown in histogram (Fig. b). Absence of signal upon siRNA mediated knock down confirms that antibody is specific to alpha Catenin.

- Submitted by
- Invitrogen Antibodies (provider)
- Main image
- Experimental details
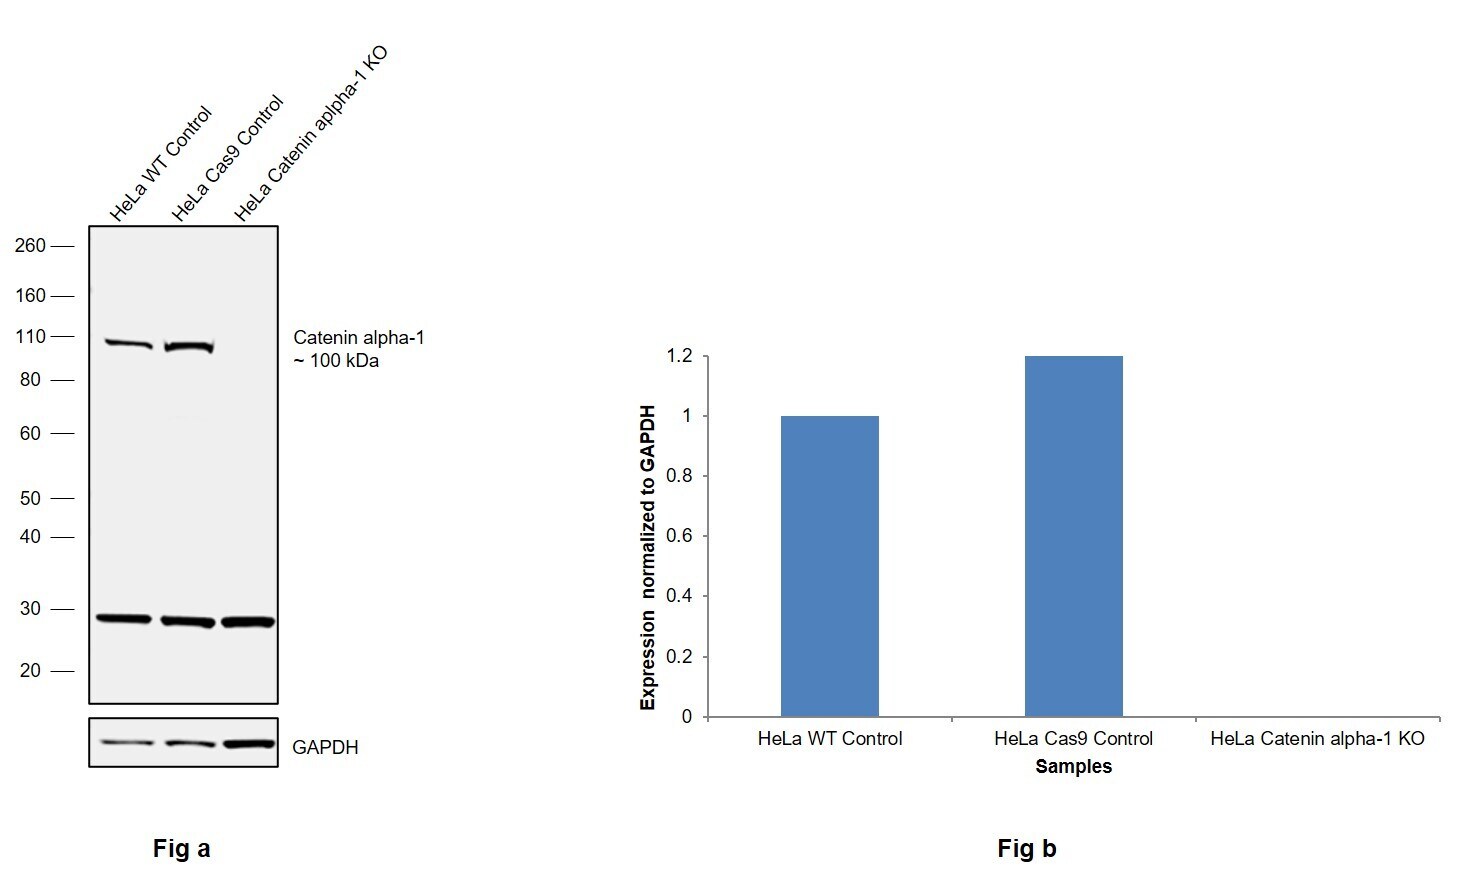
- Knockout of Catenin alpha-1 was achieved by CRISPR-Cas9 genome editing using LentiArray™ Lentiviral sgRNA (Product # A32042, Assay ID CRISPR787281_LV) and LentiArray Cas9 Lentivirus (Product # A32064). Western blot analysis of Catenin alpha-1 was performed by loading 30 µg of HeLa Wild Type (Lane 1), HeLa Cas9 (Lane 2) andHeLa Catenin alpha-1 KO (Lane 3) whole cell extracts. The samples were electrophoresed using NuPAGE™ Novex™ 4-12% Bis-Tris Protein Gel (Product # NP0322BOX). Resolved proteins were then transferred onto a nitrocellulose membrane (Product # IB23001) by iBlot® 2 Dry Blotting System (Product # IB21001). The blot was probed with Anti-alpha Catenin Polyclonal Antibody (Product # 71-1200, 1 µg/mL dilution) and Goat anti-Rabbit IgG (H+L) Superclonal™ Recombinant Secondary Antibody, HRP (Product # A27036, 1:5,000 dilution) using the iBright FL 1000 (Product # A32752). Chemiluminescent detection was performed using Novex® ECL Chemiluminescent Substrate Reagent Kit (Product # WP20005). Loss of signal upon CRISPR mediated knockout (KO) using the LentiArray™ CRISPR product line confirms that antibody is specific to Catenin alpha-1. An uncharacterized band was observed in all the samples at ~30 kDa.
Supportive validation
- Submitted by
- Invitrogen Antibodies (provider)
- Main image
- Experimental details
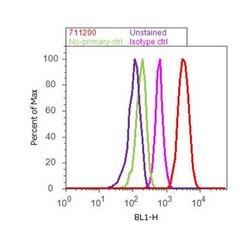
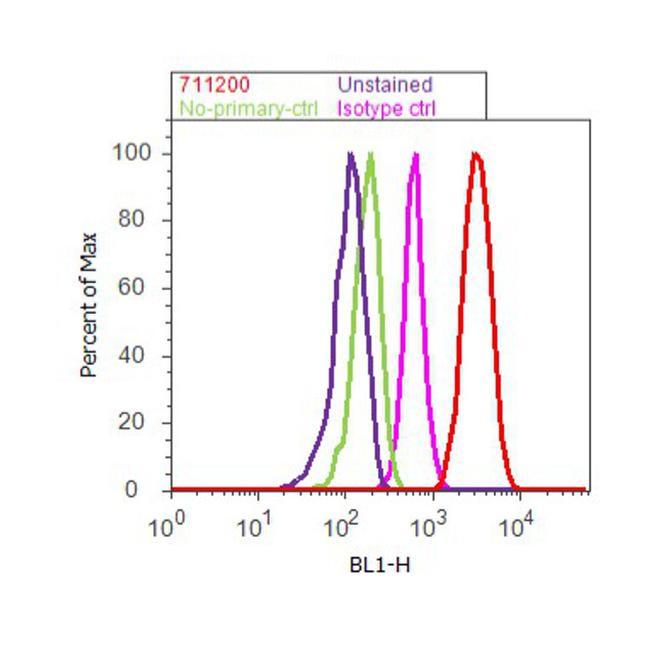
- Flow cytometry analysis of alpha Catenin was done on SH-SY5Y cells. Cells were fixed with 70% ethanol for 10 minutes, permeabilized with 0.25% Triton™ X-100 for 20 minutes, and blocked with 5% BSA for 30 minutes at room temperature. Cells were labeled with alpha Catenin Rabbit Polyclonal Antibody (711200, red histogram) or with rabbit isotype control (pink histogram) at 3-5 ug/million cells in 2.5% BSA. After incubation at room temperature for 2 hours, the cells were labeled with Alexa Fluor® 488 Goat Anti-Rabbit Secondary Antibody (A11008) at a dilution of 1:400 for 30 minutes at room temperature. The representative 10,000 cells were acquired and analyzed for each sample using an Attune® Acoustic Focusing Cytometer. The purple histogram represents unstained control cells and the green histogram represents no-primary-antibody control.
Supportive validation
- Submitted by
- Invitrogen Antibodies (provider)
- Main image
- Experimental details
- NULL
- Submitted by
- Invitrogen Antibodies (provider)
- Main image

- Experimental details
- NULL
- Submitted by
- Invitrogen Antibodies (provider)
- Main image

- Experimental details
- NULL
- Submitted by
- Invitrogen Antibodies (provider)
- Main image
- Experimental details
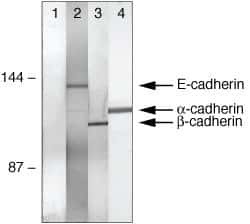
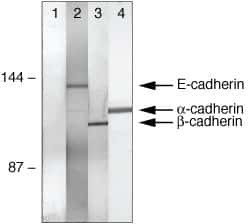
- Co-immunoprecipitation of E-cadherin, b-catenin, and a-catenin from A431 cell lysates using: IP: Rb anti-a-Catenin (lanes 1-4, Product # 71-1200) Western: Lane 1=control, Lane 2= Ms anti-E-cadherin, Lane 3= Ms anti-b-catenin, Lane 4= Ms anti-a-catenin
- Submitted by
- Invitrogen Antibodies (provider)
- Main image
- Experimental details
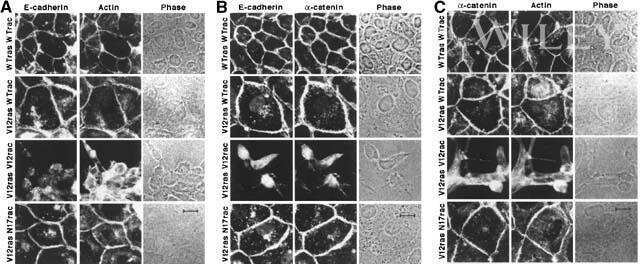
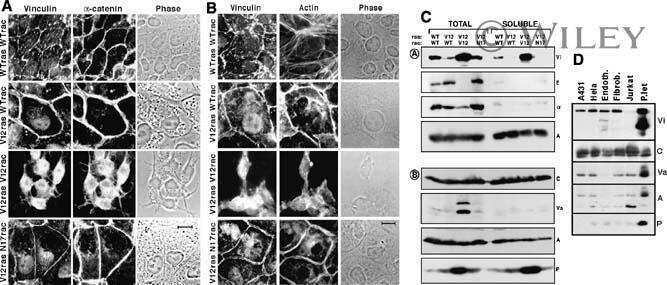
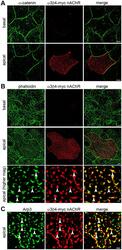
- Figure 6 alpha3beta4-myc nAChRs localize to the apical cell surface and colocalize with F-actin and Arp3. Monolayers of Caco-2 cells expressing alpha3beta4-myc nAChRs were fixed, surface labeled with anti-myc antibodies, permeabilized, and colabeled with anti-alpha-catenin (A), Alexa-488 phalloidin (B), and anti-Arp3 (C) antibodies. A) Deconvoluted confocal images of the basal and apical regions of polarized Caco-2 cells show localization of alpha-catenin on the basolateral cell membrane while alpha3beta4-myc is exclusively localized to the apical cell surface. B) Deconvoluted confocal images of the basal and apical regions of polarized Caco-2 cells colabeled with Alexa-488 phalloidin show localization of F-actin in both the basolateral and apical cell surface. Higher magnification images of the apical cell surface show colocalization of alpha3beta4-myc nAChRs with F-actin (arrowheads). C) Deconvoluted confocal images of the apical region of Caco-2 cells show colocalization of alpha3beta4-myc nAChRs with Arp3 (arrowheads). Scale bar in A and B, 5 um; scale bar in B higher magnification and in C, 1 um.
- Submitted by
- Invitrogen Antibodies (provider)
- Main image
- Experimental details
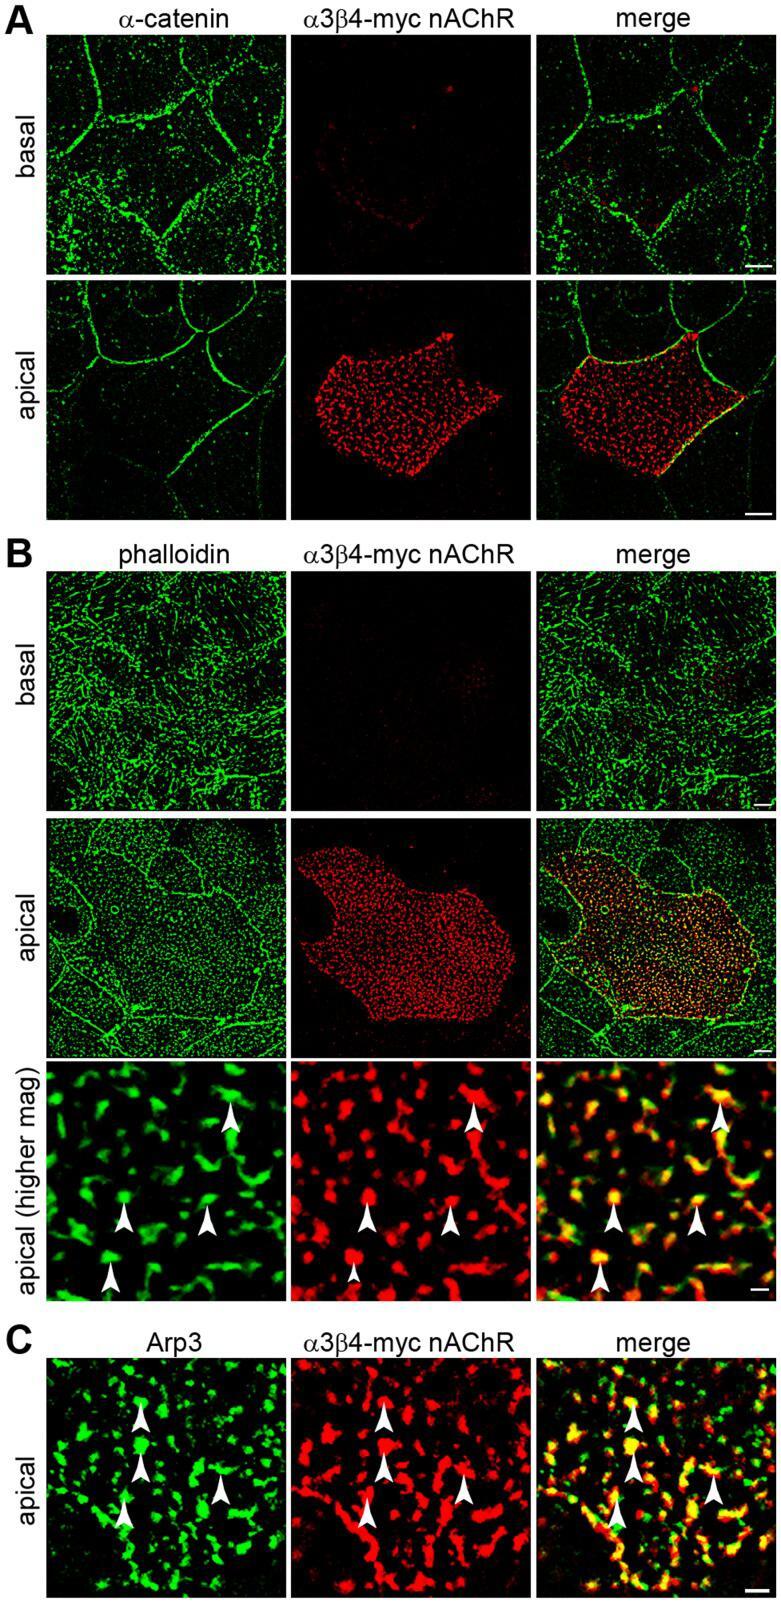
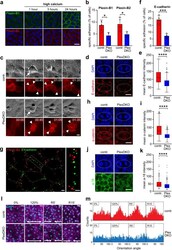
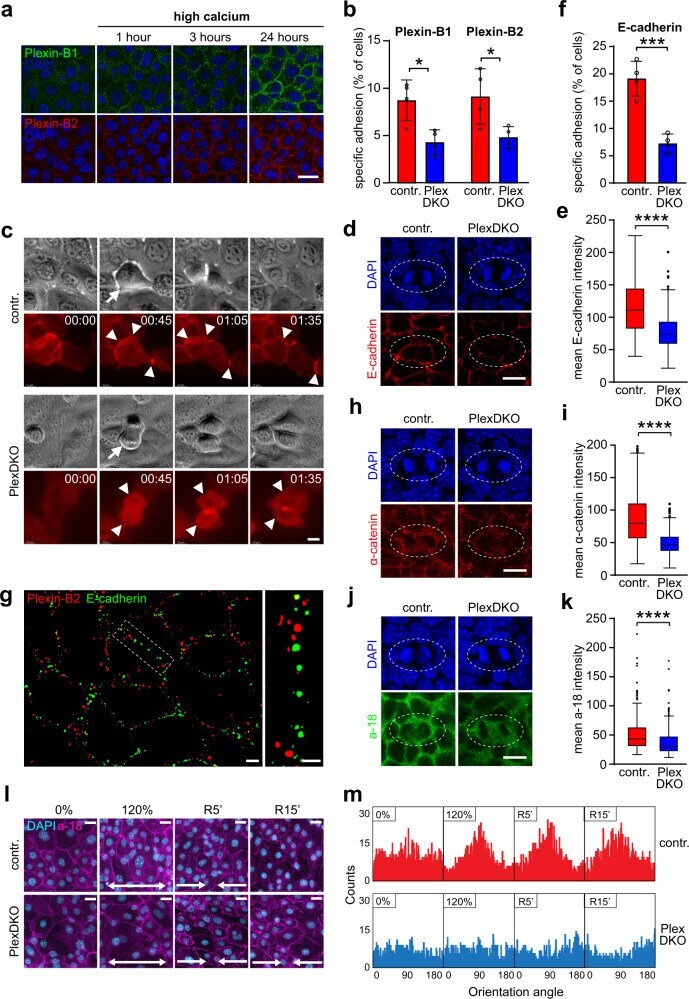
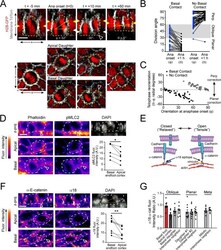
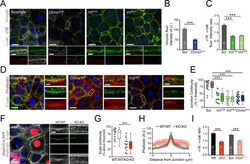
- Fig. 4 Plexin-B1/Plexin-B2 mediate mechanosensation through stabilization of adhesive cell-cell junctions. a Primary mouse keratinocytes were cultured with 70 uM Ca 2+ . 1.8 mM Ca 2+ was added (""high calcium""). Shown are confocal images of immunostainings for Plexin-B1 (green) and Plexin-B2 (red). Scale bar, 25 um. b , f Specific adhesion of primary mouse keratinocytes to the recombinant extracellular portions of b Plexin-B1 or Plexin-B2, and f E-cadherin (mean +- s.d. ; n = 4 mice per genotype; p = 0.0124 for Plexin-B1, p = 0.0332 for Plexin-B2; p = 0.0006 for E-cadherin; two-sided unpaired t -test). c Live cell imaging of primary mouse keratinocytes expressing E-cadherin-mRuby. Shown are representative epifluorescence still images of cell divisions. Arrows: dividing cells; arrowheads: cell-cell contacts. Time: hours:minutes format. Scale bar, 10 um. d , h , j Confocal images of the epidermal basal layer at E15.5 immunostained for d E-cadherin (red), h alpha-catenin (red), and j a-18 (=alpha-catenin tension-sensitive epitope antibody; green). Cell divisions are contoured by dashed lines. Scale bar, 10 um. e , i , k Quantification of e E-cadherin, i alpha-catenin, and k a-18 immunofluorescence intensities at cell-cell contacts between a dividing cell and its immediate neighbors (box plot with minimum, first quartile, median, third quartile and maximum). e control: n = 207 cell-cell contacts of 34 dividing cells from three mice, PlexDKO: n = 209 cell-cell contacts of 34 divi
- Submitted by
- Invitrogen Antibodies (provider)
- Main image
- Experimental details
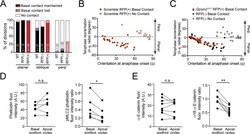
- Figure 3--figure supplement 1. A basal endfoot mediates planar telophase correction. ( A ) On the x-axis, divisions are grouped by orientation at anaphase onset (phi, planar = 0-30deg; oblique = 30-60deg; perpendicular = 60-90deg) and Gpsm2 1617 status. The y-axis depicts the proportion of divisions that lack (white), maintain (black/red), or lose (gray/pink) basal contact in the following hour. ~95% of planar divisions initiate and maintain basal contact; oblique divisions make and initiate contact less frequently (~75% of the time); while perpendicular divisions almost never make contact. LGN knockdown (red bars) does not alter this behavior. ( B-C ) Radial anaphase correction (theta-phi) plotted versus initial anaphase orientation. Cells where apical daughter basal contacts were detected are shown as black/red circles, while those lacking basal contacts are shown in gray/pink. In wild-type controls (left) basal contact correlates with planar reorientation, while lack of contact results in perpendicular reorientation. ( B ) Telophase correction (theta-phi) in Scramble RFP+ cells (middle panel), grouped by basal contact status. Like wild-type cells, Scramble RFP+ cells undergo telophase reorientation in a basal contact-dependent manner. ( C ) Both Gpsm2 1617 RFP+ (right panel; red) and wild-type RFP- cells (black) with basal contacts correct to planar, demonstrating that LGN is not required for this behavior. LGN knockdown cells only rarely (n = 3) lack basement membrane con
- Submitted by
- Invitrogen Antibodies (provider)
- Main image
- Experimental details
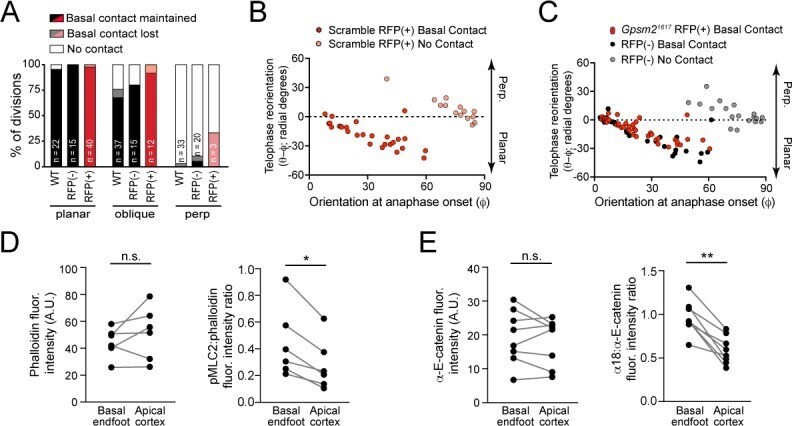
- Figure 3. Maintenance of basal contact correlates with planar-directed telophase correction. ( A ) (top) z-projection stills from a movie of a mitotic cell as it enters anaphase (t = 0) through 60 min post-anaphase onset, depicting planar telophase correction. Epidermal-dermal boundary shown by red line. Dividing daughter pairs are outlined with yellow dashed lines. Division orientation angles are shown below (phi, telophase onset; theta, +1h). (bottom), xz en face views at same timepoints. Yellow and white arrowheads indicate plane of optical section for apical and basal daughters, respectively. In most cases, planar correction is preceded by maintenance of basement membrane contact (open arrowheads), which are most apparent in the en face basal focal plane, where they appear as small membrane circles. ( B ) Data from Figure 1G,H sorted based on presence or absence of basal contact. Connecting lines demonstrate that oblique-dividing daughters retaining basal contact correct towards a planar orientation, while those losing contact correct towards perpendicular. ( C ) Data from ( B ) demonstrating that the degree of correction correlates with initial anaphase orientation. ( D ) Whole mount imaging of wild-type E16.5 epidermis stained with phalloidin and phosphorylated myosin-light chain 2 (pMLC2). Orthogonal views (top) of DAPI highlight oblique division orientation. The basal endfoot observed in live imaging of telophase correction (see panel A) can be observed in the basal e

- Submitted by
- Invitrogen Antibodies (provider)
- Main image
- Experimental details
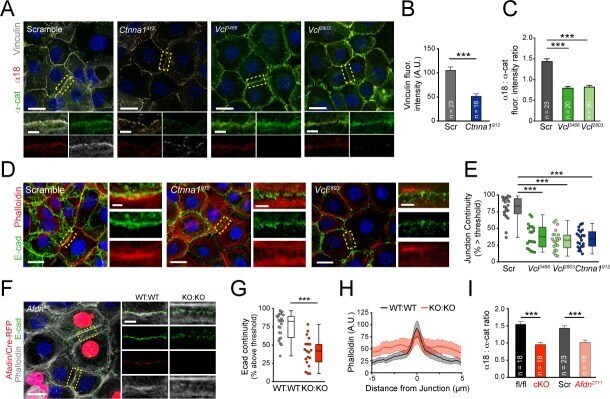
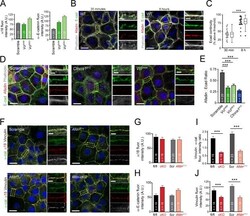
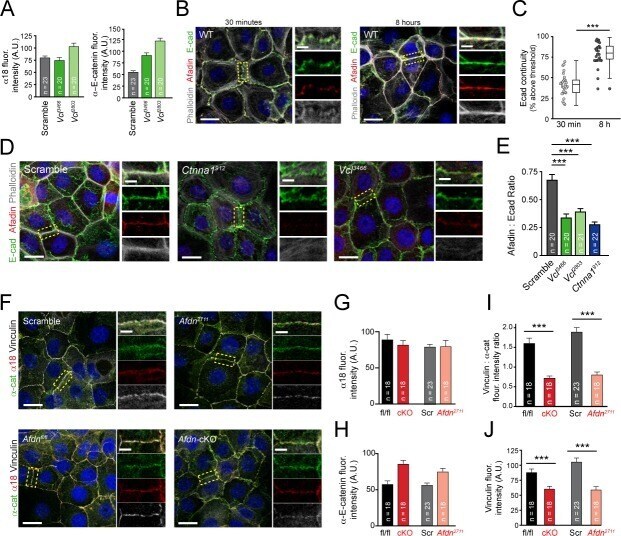
- Figure 4--figure supplement 1. The alpha-E-catenin/vinculin/afadin complex demonstrates reciprocal regulation to form mature adherens junctions in vitro. ( A ) Quantification of alpha18 (left) and alpha-E-catenin (right) fluorescence intensity in 8h Ca 2+ -shift assays in Scramble and Vcl shRNA expressing primary keratinocytes. ( B ) Time-course of junction formation in wild-type primary keratinocytes 30 min (left) and 8h (right) after the addition of 1.5 mM Ca 2+ , stained for E-cadherin (green), afadin (red), and phalloidin (gray). Between early and late timepoints, junctions transform from punctate to linear and actin becomes tightly associated with the junction. ( C ) Quantification of E-cad continuity along junction length in wild-type primary keratinocytes at 30 min and 8h timepoints. ( D ) Primary mouse keratinocytes after 8h Ca 2+ shift--labeled with afadin (red), E-cadherin (green) and actin (phalloidin, gray)--which accumulate in linear bands at cell-cell junctions in Scramble control cells. Yellow boxed region shown at high magnification to the right; n indicates junctions evaluated. Vcl and Ctnna1 knockdown cells show defects in linear actin accumulation as well as afadin recruitment to AJs, quantified in ( E ). ( F ) Scramble, Afdn 2711 , Afdn fl/fl , and Afdn cKO keratinocytes after 8h Ca 2+ shift and stained for alpha18 (red), alpha-E-catenin (green), and vinculin (gray). ( G-H ) fluorescence intensity quantification of alpha18 ( G ) and alpha-E-catenin ( H ) i
- Submitted by
- Invitrogen Antibodies (provider)
- Main image
- Experimental details
- Figure 4. Vinculin and afadin regulate alpha-E-catenin conformation and AJ linkage to the actin cytoskeleton. ( A ) Stable primary murine keratinocytes cell lines grown in the presence of high (1.5 mM) Ca 2+ for 8h form nascent cell-cell adhesions, stained for total alpha-E-catenin (green); open, ""tensile"" alpha-E-catenin (alpha18, red); and vinculin (gray). Single junction magnifications (yellow dashed region) shown below, demonstrate that Vcl knockdown results in a reduced alpha18: alpha-E-catenin ratio, quantified in ( B,C ). ( B ) Fluorescence intensity quantification of junctional vinculin in Scramble and Ctnna1 knockdown keratinocytes. Loss of Ctnna1 reduces vinculin accumulation in nascent AJs. ( C ) Quantification of alpha18:alpha-E-catenin fluorescence intensity ratio in Scramble and two independent Vcl shRNA cell lines. Vcl knockdown reduces the proportion of alpha-E-catenin in the open conformation. ( D ) Primary mouse keratinocytes after 8h Ca 2+ shift--labeled with phalloidin (red) and E-cad (green)--which accumulate in linear bands at cell-cell junctions in Scramble control cells. Yellow boxed region shown at high magnification below; n indicates junctions evaluated. Vcl and Ctnna1 knockdown cells show defects in linear actin accumulation and immature ""zipper"" junctional morphology. ( E ) Junction continuity quantification based on % of junction length above threshold for E-cad (see Materials and methods). Loss of Vcl or Ctnna1 reduces junction continuity. (