Explore
 Validate
 Learn
Learn Western blot
Antibody data
- Antibody Data
- Antigen structure
- References [12]
- Comments [0]
- Validations
- Western blot [3]
- Immunohistochemistry [1]
- Other assay [7]
Submit
Validation data
Reference
Comment
Report error
- Product number
- 14-2567-82 - Provider product page

- Provider
- Invitrogen Antibodies
- Product name
- beta Catenin Monoclonal Antibody (15B8), eBioscience™
- Antibody type
- Monoclonal
- Antigen
- Other
- Description
- Description: The 15B8 monoclonal antibody reacts with human and mouse beta-catenin, one member of a family of catenins, which are intracellular proteins that interact with cadherins to mediate cellular adhesion. More specifically, beta-catenin binds to the cytoplasmic tail of E-cadherin. In addition, this molecule is a component of the canonical Wnt signaling pathway. In the absence of Wnt binding its receptor, beta-catenin is phosphorylated and resides in the cytoplasm where it is eventually targeted for degradation by ubiquitination. Upon Wnt binding, beta-catenin becomes dephosphorylated, translocates to the nucleus, and modulates gene expression in partnership with the transcription factors T cell factor (TCF) and lymphocyte enhancer binding factor (LEF). Expression of beta-catenin is found in a wide variety of non-immune and immune tissues, including thymocytes and T and B lymphocytes. The Wnt and beta-catenin signaling pathway has been demonstrated to play a crucial role in the development of T, B, and hematopoietic stem cells.
- Antibody clone number
- 15B8
- Concentration
- 0.5 mg/mL
Submitted references Wnt activation promotes memory T cell polyfunctionality via epigenetic regulator PRMT1.
ALDH(HIGH) Population Is Regulated by the AKT/β-Catenin Pathway in a Cervical Cancer Model.
Trypanosoma cruzi Exploits Wnt Signaling Pathway to Promote Its Intracellular Replication in Macrophages.
Characterization of cytoskeleton features and maturation status of cultured human iPSC-derived cardiomyocytes.
Engineered Microvasculature in PDMS Networks Using Endothelial Cells Derived from Human Induced Pluripotent Stem Cells.
Blocking the epithelial-to-mesenchymal transition pathway abrogates resistance to anti-folate chemotherapy in lung cancer.
Modulation of N-glycosylation by mesalamine facilitates membranous E-cadherin expression in colon epithelial cells.
Expression of intercellular adhesion molecule 1 by hepatocellular carcinoma stem cells and circulating tumor cells.
Sustained expression of pre-TCR induced beta-catenin in post-beta-selection thymocytes blocks T cell development.
The canonical Wnt signaling pathway plays an important role in lymphopoiesis and hematopoiesis.
Deletion of beta-catenin impairs T cell development.
Beta-catenin mediates the interaction of the cadherin-catenin complex with epidermal growth factor receptor.
Sung BY, Lin YH, Kong Q, Shah PD, Glick Bieler J, Palmer S, Weinhold KJ, Chang HR, Huang H, Avery RK, Schneck J, Chiu YL
The Journal of clinical investigation 2022 Jan 18;132(2)
The Journal of clinical investigation 2022 Jan 18;132(2)
ALDH(HIGH) Population Is Regulated by the AKT/β-Catenin Pathway in a Cervical Cancer Model.
Sarabia-Sánchez MÁ, Alvarado-Ortiz E, Toledo-Guzman ME, García-Carrancá A, Ortiz-Sánchez E
Frontiers in oncology 2020;10:1039
Frontiers in oncology 2020;10:1039
Trypanosoma cruzi Exploits Wnt Signaling Pathway to Promote Its Intracellular Replication in Macrophages.
Volpini X, Ambrosio LF, Fozzatti L, Insfran C, Stempin CC, Cervi L, Motran CC
Frontiers in immunology 2018;9:859
Frontiers in immunology 2018;9:859
Characterization of cytoskeleton features and maturation status of cultured human iPSC-derived cardiomyocytes.
Zuppinger C, Gibbons G, Dutta-Passecker P, Segiser A, Most H, Suter TM
European journal of histochemistry : EJH 2017 Jun 21;61(2):2763
European journal of histochemistry : EJH 2017 Jun 21;61(2):2763
Engineered Microvasculature in PDMS Networks Using Endothelial Cells Derived from Human Induced Pluripotent Stem Cells.
Sivarapatna A, Ghaedi M, Xiao Y, Han E, Aryal B, Zhou J, Fernandez-Hernando C, Qyang Y, Hirschi KK, Niklason LE
Cell transplantation 2017 Aug;26(8):1365-1379
Cell transplantation 2017 Aug;26(8):1365-1379
Blocking the epithelial-to-mesenchymal transition pathway abrogates resistance to anti-folate chemotherapy in lung cancer.
Liang SQ, Marti TM, Dorn P, Froment L, Hall SR, Berezowska S, Kocher G, Schmid RA, Peng RW
Cell death & disease 2015 Jul 16;6(7):e1824
Cell death & disease 2015 Jul 16;6(7):e1824
Modulation of N-glycosylation by mesalamine facilitates membranous E-cadherin expression in colon epithelial cells.
Khare V, Lang M, Dammann K, Campregher C, Lyakhovich A, Gasche C
Biochemical pharmacology 2014 Jan 15;87(2):312-20
Biochemical pharmacology 2014 Jan 15;87(2):312-20
Expression of intercellular adhesion molecule 1 by hepatocellular carcinoma stem cells and circulating tumor cells.
Liu S, Li N, Yu X, Xiao X, Cheng K, Hu J, Wang J, Zhang D, Cheng S, Liu S
Gastroenterology 2013 May;144(5):1031-1041.e10
Gastroenterology 2013 May;144(5):1031-1041.e10
Sustained expression of pre-TCR induced beta-catenin in post-beta-selection thymocytes blocks T cell development.
Xu M, Sharma A, Hossain MZ, Wiest DL, Sen JM
Journal of immunology (Baltimore, Md. : 1950) 2009 Jan 15;182(2):759-65
Journal of immunology (Baltimore, Md. : 1950) 2009 Jan 15;182(2):759-65
The canonical Wnt signaling pathway plays an important role in lymphopoiesis and hematopoiesis.
Staal FJ, Sen JM
European journal of immunology 2008 Jul;38(7):1788-94
European journal of immunology 2008 Jul;38(7):1788-94
Deletion of beta-catenin impairs T cell development.
Xu Y, Banerjee D, Huelsken J, Birchmeier W, Sen JM
Nature immunology 2003 Dec;4(12):1177-82
Nature immunology 2003 Dec;4(12):1177-82
Beta-catenin mediates the interaction of the cadherin-catenin complex with epidermal growth factor receptor.
Hoschuetzky H, Aberle H, Kemler R
The Journal of cell biology 1994 Dec;127(5):1375-80
The Journal of cell biology 1994 Dec;127(5):1375-80
No comments: Submit comment
Supportive validation
- Submitted by
- Invitrogen Antibodies (provider)
- Main image
- Experimental details
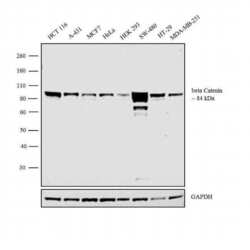
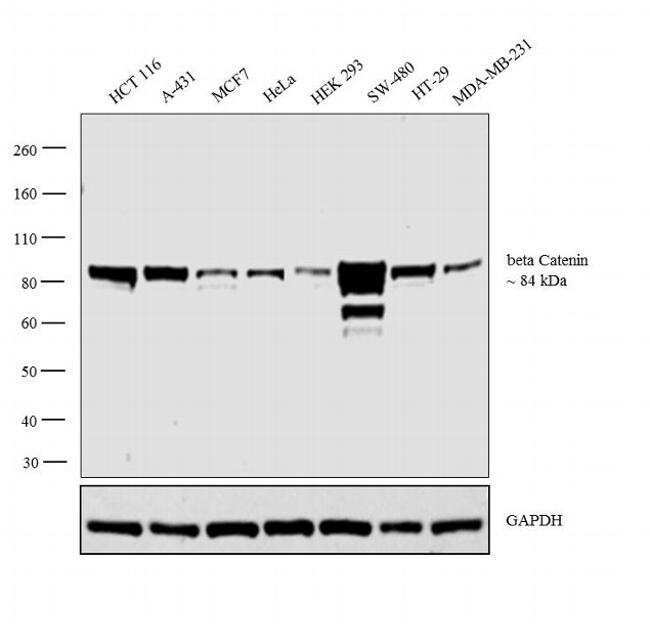
- Western blot analysis was performed on whole cell extracts (30 µg lysate) of HCT 116 (Lane 1), A-431 (Lane 2), MCF7 (Lane 3), HeLa (Lane 4), HEK 293 (Lane 5), SW-480 (Lane 6), HT-29 (Lane 7) and MDA-MB-231 (Lane 8). The blot was probed with beta Catenin Monoclonal Antibody (Product # 14-2567-80, 1:250 dilution) and detected by chemiluminescence using Goat anti-Mouse IgG (H+L) Superclonal™ Secondary Antibody, HRP conjugate (Product # A28177, 0.25 µg/mL, 1:4000 dilution). A 85 kDa band corresponding to beta Catenin was observed across the cell lines tested.

- Submitted by
- Invitrogen Antibodies (provider)
- Main image

- Experimental details
- Western blot analysis was performed on whole cell extracts (30 µg lysate) of HCT 116 (Lane 1), A-431 (Lane 2), MCF7 (Lane 3), HeLa (Lane 4), HEK 293 (Lane 5), SW-480 (Lane 6), HT-29 (Lane 7) and MDA-MB-231 (Lane 8). The blot was probed with beta Catenin Monoclonal Antibody (Product # 14-2567-82, 2µg/mL) and detected by chemiluminescence using Goat anti-Mouse IgG (H+L) Superclonal™ Secondary Antibody, HRP conjugate (Product # A28177, 0.25 µg/mL, 1:4000 dilution). A 85 kDa band corresponding to beta Catenin was observed across the cell lines tested.
- Submitted by
- Invitrogen Antibodies (provider)
- Main image
- Experimental details
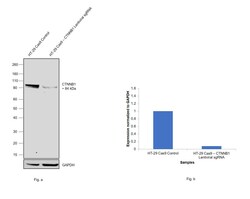
- CRISPR-Cas9 mediated genome editing of CTNNB1 was achieved by using LentiArray™ Lentiviral sgRNA (Product # A32042) (Assay ID CRISPR705241_LV) and LentiArray Cas9 Lentivirus (Product # A32064). Fig (a) Western blot analysis of CTNNB1 was performed by loading 30 µg of HT-29 CAS9 (Lane 1) and HT-29 CAS9 cells transduced with CTNNB1 Lentiviral sgRNA (Lane 2) whole cell extracts. The blot was probed with Anti-beta Catenin Monoclonal Antibody (15B8), eBioscience™(Product # 14-2567-82) using 1:500 dilution and Goat anti-Mouse IgG (H+L), Superclonal™ Recombinant Secondary Antibody, HRP (Product # A28177). A reduced signal in sgRNA transduced cells using the LentiArray™ CRISPR product line confirms that antibody is specific to CTNNB1 (Fig (b)).

Supportive validation
- Submitted by
- Invitrogen Antibodies (provider)
- Main image
- Experimental details
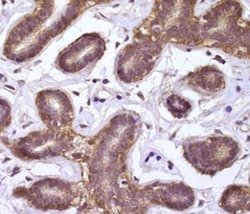
- Immunohistochemistry of formalin-fixed paraffin embedded human breast tissue using 5 µg/mL Anti-Human/Mouse beta-Catenin Purified, followed by Anti-Mouse IgG Biotin, Streptavidin HRP, and DAB visualization. Nuclei are counterstained with hematoxylin.

Supportive validation
- Submitted by
- Invitrogen Antibodies (provider)
- Main image

- Experimental details
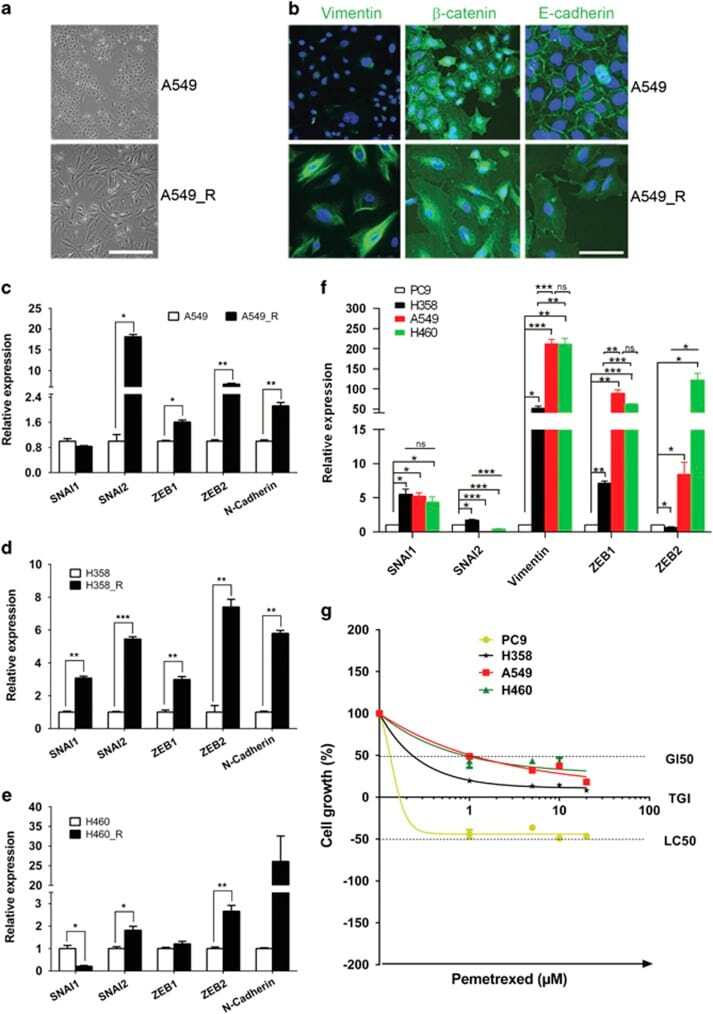
- Figure 2 Chemoresistant NSCLC cells exhibit an activated EMT pathway. ( a ) Morphological images of chemoresistant A549_R and parental A549 cells. Scale bar, 100 mu m. ( b ) A549_R and A549 cells were immunostained for Vimentin, beta -catenin and E-cadherin (green). Nuclei were counterstained with DAPI (blue). Scale bar, 25 mu m ( c-e ) mRNA levels of EMT-TFs and CDH2/N-cadherin in A549_R, H358_R and H460_R cells and the corresponding parental cells (A549, H358 and H460) were analyzed by qPCR. Data are shown as mean+-S.D. of three independent experiments ( n =3). ( f ) Different NSCLC cells are at distinct stages along the EMT. mRNA levels of EMT-TFs and Vimentin in PC9, H358, A549 and H460 cells were analyzed by qPCR and results are shown in mean+-S.D. of three independent experiments ( n =3). ( g ) NSCLC cells at distinct EMT stages exhibit differential sensitivity to MTA. PC9, H358, A549 and H460 cells treated with the indicated MTA doses for 5 days were analyzed by XTT assay. The results are shown as mean+-S.D. of triplicate experiments. * P
- Submitted by
- Invitrogen Antibodies (provider)
- Main image
- Experimental details
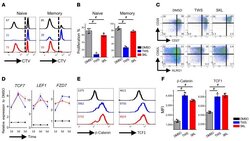
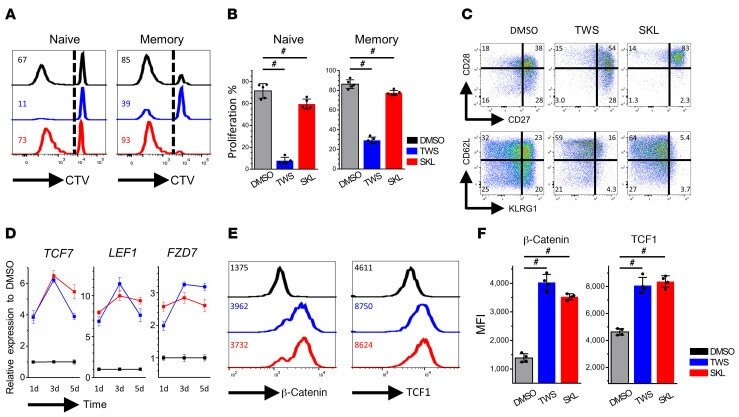
- Figure 1 Wnt signaling alters human memory CD8 + T cell proliferation and differentiation. ( A ) FACS-sorted human naive and memory CD8 + T cells were stained with CTV and stimulated with CD3/CD28 in DMSO (black), TWS119 (blue), and SKL2001 (red) for 7 days. Numbers represent the percentages of divided cells in each treatment. ( B ) Average proliferative response for each treatment ( n = 5). Dunn's test for multiple comparisons. ( C ) Memory CD8 + T cells in different treatments for 7 days were stained with phenotypic markers. Numbers represent the percentages of cells in each quadrant. ( D ) Quantitative RT-PCR analysis of Tcf7, Lef1, and Fzd7 in memory CD8 + T cells with or without Wnt agonist treatment on days 1, 3, and 5. Numbers are normalized to marker expression of the DMSO group at each corresponding time point. ( E ) Memory CD8 + T cells were stimulated with CD3/CD28 and treated with or without Wnt agonists for 7 days. beta-Catenin and TCF1 levels were analyzed by flow cytometry. Numbers represent the MFI of each protein. ( F ) Average MFI of beta-catenin and TCF1 in different treatment conditions ( n = 4). Dunn's test for multiple comparisons. # P < 0.05.
- Submitted by
- Invitrogen Antibodies (provider)
- Main image
- Experimental details
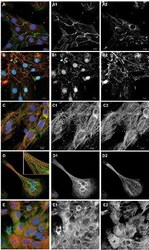
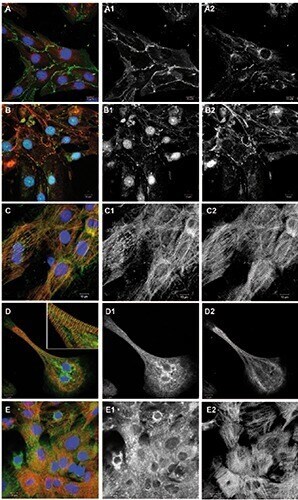
- Figure 2. Junctional proteins and proteins involved in calcium handling. Overlay images including DAPI are shown on the left, followed by corresponding green and red channel images in greyscale. A) Cells were immunostained for beta-catenin (green), connexin-43 (red) and DNA (blue). B) Cells were immunostained for N-cadherin (green), desmoglein- 2 (red) and DNA (blue). C) Cells were immunostained for BIN-1/amphiphysin-2 (green) and EH-myomesin (red). D) Cells were immunostained for SERCA-2a (green), EHmyomesin (red) and DNA (blue). E) Cells were immunostained for ryanodine receptors (green), EH-myomesin (red) and DNA (blue).
- Submitted by
- Invitrogen Antibodies (provider)
- Main image

- Experimental details
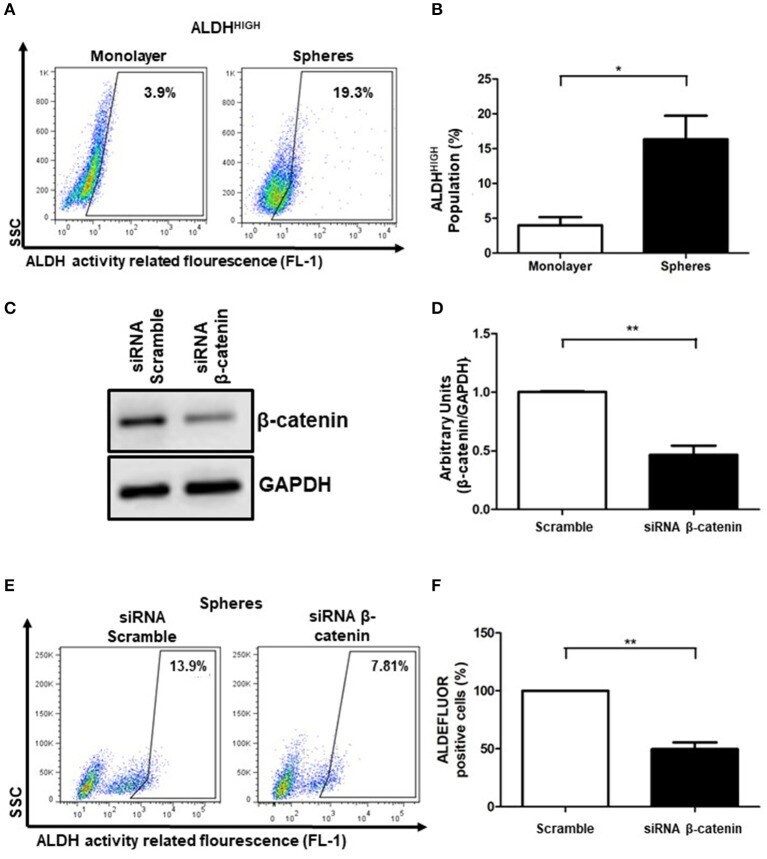
- Figure 2 beta-catenin is related to ALDH HIGH activity cell population . (A,B) Density plots showing the percentage of ALDH HIGH cells in SiHa cell line grown in monolayer or spheres cultures. The bar graph showed the percentages of ALDH HIGH cells in monolayer (white bar) or spheres cultures (black bar). The enzymatic activity of ALDH was measured by flow cytometry using the ALDEFLUOR kit. The inhibitor DEAB was employed as a background fluorescence control (data not shown). Data was normalized with DEAB (internal control) from 3 independent experiments are showed in bar graph (Means +- S.E.M. ), * p < 0.05. (C) Western Blot of beta-catenin in SiHa cells transfected with siRNA scramble (negative control) or siRNA beta-catenin at 100 nM during 24 h. GAPDH was used as loading control. (D) The units were normalized with siRNA scramble and the densitometry quantification from 3 independent experiments are showed in bar graph (Means +- S.E.M), ** p < 0.01. (E,F) Density plots showing the percentage of ALDH HIGH cells obtained of spheres cultures from SiHa cells transfected with siRNA scramble (left panel) or siRNA beta-catenin (right panel). Transient transfection of SiHa cells using siRNA scramble (control) or siRNA beta-catenin was employed to knockdown beta-catenin. At 24 h post-transfection, SiHa cells were growth in spheres cultures for an additional 72 h. Each percentage of ALDH HIGH cells was normalized with DEAB as internal control. The percentages of ALDH HIGH cells with
- Submitted by
- Invitrogen Antibodies (provider)
- Main image

- Experimental details
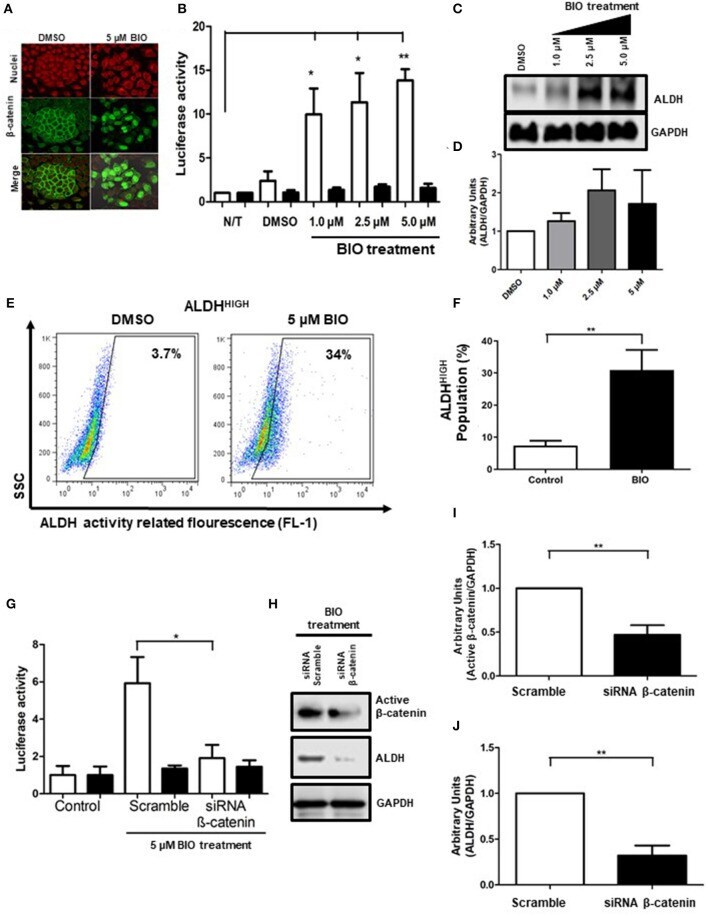
- Figure 4 GSK3-beta inhibition upregulates ALDH through beta-catenin-dependent transcriptional activity. (A) Images showing beta-catenin (green) localization in SiHa cells treated with DMSO (vehicle) or 5 muM of BIO obtained by immunofluorescence microscopy. The nuclei were stained with IP (red). Representative images from at least 3 independent experiments are showed. Magnification 40X. (B) Reporter activity of beta-catenin-dependent transcription in SiHa cells exposed to BIO treatment. Transient transfection of SiHa cells using the plasmid control pFOP (black bars) and the reporter plasmid pTOP (white bars) was employed to measure transcriptional activity of beta-catenin. At 24 h post-transfection, the SiHa cells were treated with BIO at the concentrations indicated for an additional 48 h. The values of luciferase were normalized to beta-galactosidase and the data are showed in bar graph from 5 independent experiments, (Means +- S.E.M). * p < 0.05, ** p < 0.01. (C,D) Western Blot of ALDH in SiHa cells growth as monolayer culture and exposed to BIO at the concentrations indicated during 48 h. GAPDH was used as loading control. Densitometry quantification is showed in bar graph (Means +- S.E.M). (E,F) Density plots showing the percentage of ALDH HIGH cells in SiHa cells treated with DMSO (vehicle) or BIO. The enzymatic activity of ALDH was measured by flow cytometry using the ALDEFLUOR kit. DEAB inhibitor was employed to determine the percentage of ALDH HIGH cells for each con
- Submitted by
- Invitrogen Antibodies (provider)
- Main image
- Experimental details
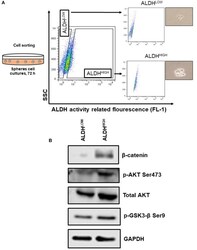
- Figure 5 The ALDH HIGH subpopulation from spheres model shown elements associated to the activation of beta-catenin. (A) Schematic model of cell sorting to ALDH HIGH and ALDH LOW subpopulations from spheres grown 72 h. (B) Western Blot analysis of beta-catenin, p-GSK3-beta Ser9, and p-AKT Ser473 and total AKT from sorted ALDH subpopulations.

- Submitted by
- Invitrogen Antibodies (provider)
- Main image

- Experimental details
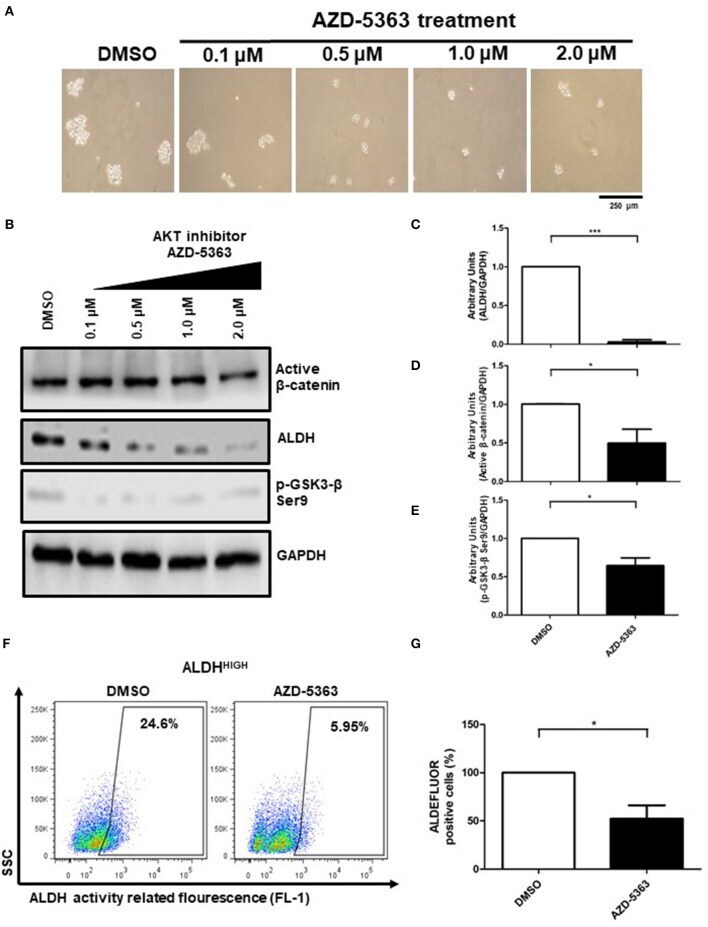
- Figure 6 The AKT activity is present in upstream beta-catenin/ALDH axis. (A) Representative image of spheres size upon 0.1-2.0 muM AZD-5363 treatment. (B-E) Western Blot analysis of active beta-catenin, p-GSK3-beta Ser9, and ALDH protein from spheres treated with 0.1-2.0 muM AZD-5363, the bar graphs shown the comparation of control (DMSO) vs. 2.0 muM AZD-5363 treatment from 3 independent experiments (Means +- S.E.M. ), * p < 0.05,*** p < 0.001. (F) Density plots showing the percentage of ALDH HIGH cells in spheres treated with control (DMSO) or 2.0 muM AZD-5363 treatment for 72 h. (G) The bar graph shown the percentage of ALDEFLUOR positive cells in both conditions, DMSO and AZD-5363 treatment, considering 3 independent experiments (Means +- S.E.M. ), * p < 0.05.