 Explore
 Validate
 Learn
Learn Western blot
 Immunoprecipitation
Antibody data
- Antibody Data
- Antigen structure
- References [7]
- Comments [0]
- Validations
- Western blot [2]
- Immunocytochemistry [6]
- Immunohistochemistry [2]
- Other assay [6]
Submit
Validation data
Reference
Comment
Report error
- Product number
- MA1-300 - Provider product page

- Provider
- Invitrogen Antibodies
- Product name
- beta Catenin Monoclonal Antibody (6F9)
- Antibody type
- Monoclonal
- Antigen
- Recombinant full-length protein
- Description
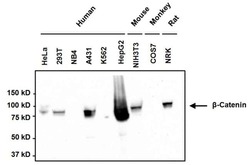
- MA1-300 detects beta Catenin from A431, WI-38, and MCF-7 human cell lines, mouse and rat samples. MA1-300 has been successfully used in Western blot applications. By Western blot this antibody detects a ~94 kDa protein representing beta Catenin. The MA1-300 immunogen is recombinant beta Catenin protein.
- Reactivity
- Human, Mouse, Rat
- Host
- Mouse
- Antibody clone number
- 6F9
- Vial size
- 100 µg
- Concentration
- 1 mg/mL
- Storage
- -20° C, Avoid Freeze/Thaw Cycles
Submitted references RhoC Modulates Cell Junctions and Type I Interferon Response in Aggressive Breast Cancers.
Antioxidant and Antiproliferative Activity of Finasteride against Glioblastoma Cells.
Tick extracellular vesicles enable arthropod feeding and promote distinct outcomes of bacterial infection.
Overexpression of G3BP1 facilitates the progression of colon cancer by activating β‑catenin signaling.
ROCK2 inhibition triggers the collective invasion of colorectal adenocarcinomas.
A truncating mutation in the autophagy gene UVRAG drives inflammation and tumorigenesis in mice.
Underexpression of LKB1 tumor suppressor is associated with enhanced Wnt signaling and malignant characteristics of human intrahepatic cholangiocarcinoma.
Abraham HG, Ulintz PJ, Goo L, Yates JA, Little AC, Bao L, Wu Z, Merajver SD
Frontiers in oncology 2021;11:712041
Frontiers in oncology 2021;11:712041
Antioxidant and Antiproliferative Activity of Finasteride against Glioblastoma Cells.
Kim HJ, Kim TJ, Kim YG, Seong C, Cho JH, Kim W, Lee KH, Kim DY
Pharmaceutics 2021 Sep 6;13(9)
Pharmaceutics 2021 Sep 6;13(9)
Tick extracellular vesicles enable arthropod feeding and promote distinct outcomes of bacterial infection.
Oliva Chávez AS, Wang X, Marnin L, Archer NK, Hammond HL, Carroll EEM, Shaw DK, Tully BG, Buskirk AD, Ford SL, Butler LR, Shahi P, Morozova K, Clement CC, Lawres L, Neal AJO, Mamoun CB, Mason KL, Hobbs BE, Scoles GA, Barry EM, Sonenshine DE, Pal U, Valenzuela JG, Sztein MB, Pasetti MF, Levin ML, Kotsyfakis M, Jay SM, Huntley JF, Miller LS, Santambrogio L, Pedra JHF
Nature communications 2021 Jun 17;12(1):3696
Nature communications 2021 Jun 17;12(1):3696
Overexpression of G3BP1 facilitates the progression of colon cancer by activating β‑catenin signaling.
Li Y, Wang J, Zhong S, Li J, Du W
Molecular medicine reports 2020 Nov;22(5):4403-4411
Molecular medicine reports 2020 Nov;22(5):4403-4411
ROCK2 inhibition triggers the collective invasion of colorectal adenocarcinomas.
Libanje F, Raingeaud J, Luan R, Thomas Z, Zajac O, Veiga J, Marisa L, Adam J, Boige V, Malka D, Goéré D, Hall A, Soazec JY, Prall F, Gelli M, Dartigues P, Jaulin F
The EMBO journal 2019 Jul 15;38(14):e99299
The EMBO journal 2019 Jul 15;38(14):e99299
A truncating mutation in the autophagy gene UVRAG drives inflammation and tumorigenesis in mice.
Quach C, Song Y, Guo H, Li S, Maazi H, Fung M, Sands N, O'Connell D, Restrepo-Vassalli S, Chai B, Nemecio D, Punj V, Akbari O, Idos GE, Mumenthaler SM, Wu N, Martin SE, Hagiya A, Hicks J, Cui H, Liang C
Nature communications 2019 Dec 12;10(1):5681
Nature communications 2019 Dec 12;10(1):5681
Underexpression of LKB1 tumor suppressor is associated with enhanced Wnt signaling and malignant characteristics of human intrahepatic cholangiocarcinoma.
Wang J, Zhang K, Wang J, Wu X, Liu X, Li B, Zhu Y, Yu Y, Cheng Q, Hu Z, Guo C, Hu S, Mu B, Tsai CH, Li J, Smith L, Yang L, Liu Q, Chu P, Chang V, Zhang B, Wu M, Jiang X, Yen Y
Oncotarget 2015 Aug 7;6(22):18905-20
Oncotarget 2015 Aug 7;6(22):18905-20
No comments: Submit comment
Supportive validation
- Submitted by
- Invitrogen Antibodies (provider)
- Main image
- Experimental details
- Western blot analysis of beta-Catenin was performed by loading 50 µg of the indicated whole cell lysates per well onto a 4-20% Tris-HCl polyacrylamide gel. Proteins were transferred to a PVDF membrane and blocked with 5% BSA/TBST for at least 1 hour. The membrane was probed with a beta-Catenin monoclonal antibody (Product # MA1-300) at a dilution of 1:1000 overnight at 4°C on a rocking platform, washed in TBS-0.1%Tween 20, and probed with a goat anti-mouse IgG-HRP secondary antibody (Product # 31430) at a dilution of 1:20,000 for at least one hour. Chemiluminescent detection was performed using SuperSignal West Pico (Product # 34080).

- Submitted by
- Invitrogen Antibodies (provider)
- Main image
- Experimental details
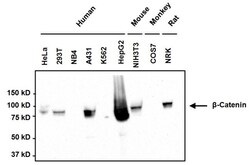
- Western blot analysis of beta-Catenin was performed by loading 50 µg of the indicated whole cell lysates per well onto a 4-20% Tris-HCl polyacrylamide gel. Proteins were transferred to a PVDF membrane and blocked with 5% BSA/TBST for at least 1 hour. The membrane was probed with a beta-Catenin monoclonal antibody (Product # MA1-300) at a dilution of 1:1000 overnight at 4°C on a rocking platform, washed in TBS-0.1%Tween 20, and probed with a goat anti-mouse IgG-HRP secondary antibody (Product # 31430) at a dilution of 1:20,000 for at least one hour. Chemiluminescent detection was performed using SuperSignal West Pico (Product # 34080).

Supportive validation
- Submitted by
- Invitrogen Antibodies (provider)
- Main image

- Experimental details
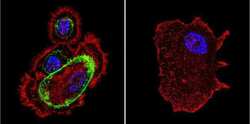
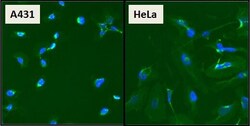
- Immunofluorescent analysis (green) in A431 and HeLa cells. Formalin fixed cells were permeabilized with 0.1% Triton X-100 in TBS for 10 minutes at room temperature and blocked with 1% Blocker BSA (Product # 37525) for 15 minutes at room temperature. Cells were probed with a monoclonal antibody (Product # MA1-300), at a dilution of 1:50 for at least 1 hour at room temperature, washed with PBS, and incubated with DyLight 488 goat anti-mouse IgG secondary antibody (Product # 35502) at a dilution of 1:400 for 30 minutes at room temperature. Nuclei (blue) were stained with Hoechst 33342 dye (Product # 62249). Images were taken on a Thermo Scientific ArrayScan at 20X magnification.

- Submitted by
- Invitrogen Antibodies (provider)
- Main image

- Experimental details
- Immunofluorescent analysis (green) in A431 and HeLa cells. Formalin fixed cells were permeabilized with 0.1% Triton X-100 in TBS for 10 minutes at room temperature and blocked with 1% Blocker BSA (Product # 37525) for 15 minutes at room temperature. Cells were probed with a monoclonal antibody (Product # MA1-300), at a dilution of 1:50 for at least 1 hour at room temperature, washed with PBS, and incubated with DyLight 488 goat anti-mouse IgG secondary antibody (Product # 35502) at a dilution of 1:400 for 30 minutes at room temperature. Nuclei (blue) were stained with Hoechst 33342 dye (Product # 62249). Images were taken on a Thermo Scientific ArrayScan at 20X magnification.

- Submitted by
- Invitrogen Antibodies (provider)
- Main image
- Experimental details
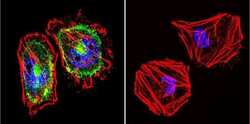
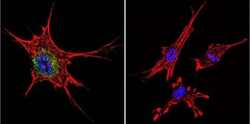
- Immunofluorescent analysis of Catenin beta in A431 cells. Cells were grown on chamber slides and fixed with formaldehyde prior to staining. Cells were probed without (control) or with a Catenin beta monoclonal antibody (Product # MA1-300) at a dilution of 1:200 overnight at 4 C, washed with PBS and incubated with a DyLight-488 conjugated secondary antibody (Product # 35503). Catenin beta staining (green), F-Actin staining with Phalloidin (red) and nuclei with DAPI (blue) is shown. Images were taken at 60X magnification.

- Submitted by
- Invitrogen Antibodies (provider)
- Main image
- Experimental details
- Immunofluorescent analysis of Catenin beta inHeLa cells. Cells were grown on chamber slides and fixed with formaldehyde prior to staining. Cells were probed without (control) or with a Catenin beta monoclonal antibody (Product # MA1-300) at a dilution of 1:200 overnight at 4 C, washed with PBS and incubated with a DyLight-488 conjugated secondary antibody (Product # 35503). Catenin beta staining (green), F-Actin staining with Phalloidin (red) and nuclei with DAPI (blue) is shown. Images were taken at 60X magnification.

- Submitted by
- Invitrogen Antibodies (provider)
- Main image
- Experimental details
- Immunofluorescent analysis (green) in A431 and HeLa cells. Formalin fixed cells were permeabilized with 0.1% Triton X-100 in TBS for 10 minutes at room temperature and blocked with 1% Blocker BSA (Product # 37525) for 15 minutes at room temperature. Cells were probed with a monoclonal antibody (Product # MA1-300), at a dilution of 1:50 for at least 1 hour at room temperature, washed with PBS, and incubated with DyLight 488 goat anti-mouse IgG secondary antibody (Product # 35502) at a dilution of 1:400 for 30 minutes at room temperature. Nuclei (blue) were stained with Hoechst 33342 dye (Product # 62249). Images were taken on a Thermo Scientific ArrayScan at 20X magnification.

- Submitted by
- Invitrogen Antibodies (provider)
- Main image
- Experimental details
- Immunofluorescent analysis of Catenin beta in NIH-3T3 cells. Cells were grown on chamber slides and fixed with formaldehyde prior to staining. Cells were probed without (control) or with a Catenin beta monoclonal antibody (Product # MA1-300) at a dilution of 1:100 overnight at 4 C, washed with PBS and incubated with a DyLight-488 conjugated secondary antibody (Product # 35503). Catenin beta staining (green), F-Actin staining with Phalloidin (red) and nuclei with DAPI (blue) is shown. Images were taken at 60X magnification.

Supportive validation
- Submitted by
- Invitrogen Antibodies (provider)
- Main image

- Experimental details
- Immunohistochemistry was performed on cancer biopsies of deparaffinized Human colon carcinoma tissue. To expose target proteins, heat induced antigen retrieval was performed using 10mM sodium citrate (pH6.0) buffer, microwaved for 8-15 minutes. Following antigen retrieval tissues were blocked in 3% BSA-PBS for 30 minutes at room temperature and probed with a Catenin beta monoclonal antibody (Product # MA1-300) at a dilution of 1:100 or without primary antibody (negative control) overnight at 4°C in a humidified chamber. Tissues were washed with PBST and endogenous peroxidase activity was quenched with a peroxidase suppressor. Detection was performed using a biotin-conjugated secondary antibody and SA-HRP, followed by colorimetric detection using DAB. Tissues were counterstained with hematoxylin and prepped for mounting.

- Submitted by
- Invitrogen Antibodies (provider)
- Main image

- Experimental details
- Immunohistochemistry was performed on normal biopsies of deparaffinized Human stomach tissue. To expose target proteins, heat induced antigen retrieval was performed using 10mM sodium citrate (pH6.0) buffer, microwaved for 8-15 minutes. Following antigen retrieval tissues were blocked in 3% BSA-PBS for 30 minutes at room temperature and probed with a Catenin beta monoclonal antibody (Product # MA1-300) at a dilution of 1:200 or without primary antibody (negative control) overnight at 4°C in a humidified chamber. Tissues were washed with PBST and endogenous peroxidase activity was quenched with a peroxidase suppressor. Detection was performed using a biotin-conjugated secondary antibody and SA-HRP, followed by colorimetric detection using DAB. Tissues were counterstained with hematoxylin and prepped for mounting.

Supportive validation
- Submitted by
- Invitrogen Antibodies (provider)
- Main image

- Experimental details
- Figure 5 GSEA identified the enrichment of Wnt/beta-catenin upon knockdown of LKB1 in ICC cells A. Heat map of relative enrichment scores for Wnt signaling pathway genes in siRNA transfected ICC cells as indicated. Gene signatures are represented in rows (red = significant enrichment of overexpressed genes; green, significant enrichment of under-expressed genes; black, not significant; P < 0.05). ICC cells and conditions are represented in columns (HuC: HuH-28 transfected with control siRNA, HuL: HuH-28 with LKB1 siRNA, RC: RBE with control siRNA, RL: RBE with LKB1 siRNA, SC: SSP-25 transfected with control siRNA, SL: SSP-25 with LKB1 siRNA, 1 for the 1 st test, 2 for the 2 nd test. B. Enrichment plots of the Wnt/beta-catenin gene set in all three LKB1-attenuated ICC lines. C. Western-blot analysis to validate selected proteins involved in Wnt/beta-catenin signaling and EMT markers. D. Quantitation of TOPFlash luciferase activity of TCF promoter reporter in ICC cells transfected with control or LKB1 siRNA as indicated (** P < 0.01, compared to control siRNA). E. Double-label fluorescent immunohistochemistry of cells as indicated at 72h posttransfection with LKB1 or control siRNA in the three ICC cells. Blue is DAPI nuclear stain and green is beta-catenin. Inserts show magnified areas.

- Submitted by
- Invitrogen Antibodies (provider)
- Main image

- Experimental details
- Figure 6 Inverse correlation between LKB1 and nuclear beta-catenin in ICC tissues A. Representative IHC staining of LKB1 and beta-catenin (x200) in serial sections, scale bar: 20 muM. Shown are low LKB1 (left), moderate LKB1 (middle) and high LKB1 (right). Inserts indicate magnified areas. B. Regression plot of LKB1 and nuclear beta-catenin in 326 patient tissues, analyzed by Spearman's nonparametric correlation test (R = -0.147; P < 0.05).

- Submitted by
- Invitrogen Antibodies (provider)
- Main image

- Experimental details
- Figure 3. G3BP1 activates beta-catenin in colon cancer cells. SW620 and RKO cells were transfected with Vector-NC or Vector-G3BP1 and the following assays were performed. Protein expression levels of Frz, Dsh, TCF, APC, Axin, c-myc and beta-catenin were detected via western blotting after 48 h of transfection in (A) SW620 and (B) RKO cells. Cell nuclear and cytoplasm proteins were extracted for western blot analysis to detect beta-catenin levels in nuclear (Lamin B1 was used as an internal reference for nuclear protein) and cytoplasmic fractions (GAPDH was used as an internal reference for cytoplasm protein) in (C) SW620 and (D) RKO cells. Interaction between G3BP1 and beta-catenin was determined using a co-IP assay in (E) SW620 and (F) RKO cells. Data from three independent assays are presented as the mean +- SD. *P

- Submitted by
- Invitrogen Antibodies (provider)
- Main image

- Experimental details
- Figure 4. Knockdown of beta-catenin abolishes the effect of G3BP1 on cell proliferation and apoptosis. SW620 and RKO cells were transfected with Vector-NC, Vector-G3BP1 and Vector-G3BP1 + sh-beta-catenin, then the following assays were performed. Protein expression of beta-catenin was detected using western blotting after 48 h of transfection in (A) SW620 and (B) RKO cells. Cells were harvested for western blotting to measure beta-catenin protein expression after 48 h of transfection in (C) SW620 and (D) RKO cells. Cell Counting Kit-8 assays were performed for five consecutive days to detect proliferation in (E) SW620 and (F) RKO cells. (G) SW620 and (H) RKO cells were collected for FACS to detect cell apoptosis after 48 h cell transfection. Data from three independent assays are presented as the mean +- SD. *P

- Submitted by
- Invitrogen Antibodies (provider)
- Main image

- Experimental details
- Figure 1 Glioblastoma stem-like cells are sensitive to high-dose finasteride. ( A ) Cell morphology of U373 (upper) and T98G (lower) glioblastoma cells under sphere-forming culture condition upon treatment of DMSO or temozolomide (TMZ) or 100 muM finasteride (FIN) for 24 h. ( B ) The mRNA expression of Sox2 in U373 (left) and T98G (right) cells upon vehicle or drug treatment, as measured by quantitative RT-PCR analysis. The mRNA level of vehicle-treated cells was set to 1. ( C ) Immunoblot analysis of beta-catenin in U373 (left) or T98G (right) cells after treatment with vehicle or FIN at the indicated concentration for 24 h. GAPDH was used as a loading control. The relative band intensities of beta-catenin are shown below. The intensities of vehicle-treated samples were arbitrarily set to 1. ( D ) beta-catenin activity was measured in U373 (left) or T98G (right) cells by TOPFlash reporter assay upon treatment of DMSO or 100 muM FIN for 24 h. ( E ) Immunoblot analysis of P62 and LC3 in U373 (left) or T98G (right) cells after vehicle or drug treatment for 24 h. The relative band intensities of P62 and LC3-II are represented. The intensities of vehicle-treated samples were arbitrarily set to 1. * p < 0.05, ** p < 0.01.

- Submitted by
- Invitrogen Antibodies (provider)
- Main image

- Experimental details
- Fig. 7 UVRAG FS activates beta-catenin by promoting age-related autophagy suppression. a H&E and IHC of colon from Dox-treated control and iUVRAG FS mice (12-month-old). Data are from one animal that is representative of 5-12 animals in each group. b Crypt length of the colon in a . c , d Representative images ( c ) of Ki67, cleaved caspase 3, and gamma-H2AX of colons in 12-month-old control and iUVRAG FS mice on Dox and quantitation ( d ) of Ki67- and gamma-H2AX-positive cells per crypt of indicated genotype. Arrow indicates apoptosis. e , f IHC of beta-catenin and c-Myc ( e ) and quantitation of nuclear beta-catenin per crypt ( f ) from control and iUVRAG FS mice (12-month-old). g WB of indicated protein expression in colons of the indicated genotype. h Quantitative RT-PCR of beta-catenin and its target gene expression in colons from 18-month-old mice. n = 3. i , j WB of beta-catenin and autophagy marker proteins in iFHC cells treated with 3-MA (1 mM) ( i ) or with chloroquine (CQ, 20 muM). k UVRAG FS inhibits beta-catenin interaction with autophagy proteins. SW480 cells were transfected with increasing amounts of Flag-UVRAG FS . WCL were used for IP with anti-beta-catenin, followed by IB with the indicated antibodies. The densitometric quantification of the p62/actin ratio is shown (bottom). l Quantitative RT-PCR of indicated gene expression in cells in k . n = 3. m Cell cycle analyses of SW480 cells stably expressing vector or UVRAG FS . n = 3. n Co-IP of beta-catenin wit
