 Explore
 Validate
 Learn
Learn Western blot
Antibody data
- Antibody Data
- Antigen structure
- References [13]
- Comments [0]
- Validations
- Western blot [3]
- Immunocytochemistry [4]
- Immunohistochemistry [2]
- Other assay [12]
Submit
Validation data
Reference
Comment
Report error
- Product number
- MA1-301 - Provider product page

- Provider
- Invitrogen Antibodies
- Product name
- beta Catenin Monoclonal Antibody (15B8)
- Antibody type
- Monoclonal
- Antigen
- Recombinant full-length protein
- Description
- MA1-301 detects beta Catenin from human, mouse, monkey, and rat samples.
- Antibody clone number
- 15B8
- Concentration
- 1 mg/mL
Submitted references Proteomic characterization of GSK3β knockout shows altered cell adhesion and metabolic pathway utilisation in colorectal cancer cells.
Ginsenoside Rb1 Lessens Gastric Precancerous Lesions by Interfering With β-Catenin/TCF4 Interaction.
MYBL2 in synergy with CDC20 promotes the proliferation and inhibits apoptosis of gastric cancer cells.
miR‑125a‑5p reverses epithelial‑mesenchymal transition and restores drug sensitivity by negatively regulating TAFAZZIN signaling in breast cancer.
Morphine exposure exacerbates HIV-1 Tat driven changes to neuroinflammatory factors in cultured astrocytes.
Retinoic acid induces differentiation in neuroblastoma via ROR1 by modulating retinoic acid response elements.
Deep proteomic analysis of Dnmt1 mutant/hypomorphic colorectal cancer cells reveals dysregulation of epithelial-mesenchymal transition and subcellular re-localization of Beta-Catenin.
The β-catenin/YAP signaling axis is a key regulator of melanoma-associated fibroblasts.
Strictinin, a novel ROR1-inhibitor, represses triple negative breast cancer survival and migration via modulation of PI3K/AKT/GSK3ß activity.
Leptospira interrogans causes quantitative and morphological disturbances in adherens junctions and other biological groups of proteins in human endothelial cells.
E-cadherin dynamics is regulated by galectin-7 at epithelial cell surface.
A hypothesis-driven approach identifies CDK4 and CDK6 inhibitors as candidate drugs for treatments of adrenocortical carcinomas.
Activating β-catenin signaling in CD133-positive dermal papilla cells increases hair inductivity.
Bowler-Barnett E, Martinez-Garcia FD, Sherwood M, Aleidan A, John S, Weston S, Wang Y, Divecha N, Skipp P, Ewing RM
PloS one 2021;16(11):e0246707
PloS one 2021;16(11):e0246707
Ginsenoside Rb1 Lessens Gastric Precancerous Lesions by Interfering With β-Catenin/TCF4 Interaction.
Zeng J, Ma X, Zhao Z, Chen Y, Wang J, Hao Y, Yu J, Zeng Z, Chen N, Zhao M, Tang J, Gong D
Frontiers in pharmacology 2021;12:682713
Frontiers in pharmacology 2021;12:682713
MYBL2 in synergy with CDC20 promotes the proliferation and inhibits apoptosis of gastric cancer cells.
Deng Q, Wu L, Li Y, Zou L
Advances in clinical and experimental medicine : official organ Wroclaw Medical University 2021 Sep;30(9):957-966
Advances in clinical and experimental medicine : official organ Wroclaw Medical University 2021 Sep;30(9):957-966
miR‑125a‑5p reverses epithelial‑mesenchymal transition and restores drug sensitivity by negatively regulating TAFAZZIN signaling in breast cancer.
Li D, Chen L, Zhang X, Wang Y, Huang C, Li J, He F, He W
Molecular medicine reports 2021 Nov;24(5)
Molecular medicine reports 2021 Nov;24(5)
Morphine exposure exacerbates HIV-1 Tat driven changes to neuroinflammatory factors in cultured astrocytes.
Chen K, Phan T, Lin A, Sardo L, Mele AR, Nonnemacher MR, Klase Z
PloS one 2020;15(3):e0230563
PloS one 2020;15(3):e0230563
Retinoic acid induces differentiation in neuroblastoma via ROR1 by modulating retinoic acid response elements.
Illendula A, Fultang N, Peethambaran B
Oncology reports 2020 Sep;44(3):1013-1024
Oncology reports 2020 Sep;44(3):1013-1024
Deep proteomic analysis of Dnmt1 mutant/hypomorphic colorectal cancer cells reveals dysregulation of epithelial-mesenchymal transition and subcellular re-localization of Beta-Catenin.
Bowler EH, Smith-Vidal A, Lester A, Bell J, Wang Z, Bell CG, Wang Y, Divecha N, Skipp PJ, Ewing RM
Epigenetics 2020 Jan-Feb;15(1-2):107-121
Epigenetics 2020 Jan-Feb;15(1-2):107-121
The β-catenin/YAP signaling axis is a key regulator of melanoma-associated fibroblasts.
Liu T, Zhou L, Yang K, Iwasawa K, Kadekaro AL, Takebe T, Andl T, Zhang Y
Signal transduction and targeted therapy 2019;4:63
Signal transduction and targeted therapy 2019;4:63
Strictinin, a novel ROR1-inhibitor, represses triple negative breast cancer survival and migration via modulation of PI3K/AKT/GSK3ß activity.
Fultang N, Illendula A, Chen B, Wu C, Jonnalagadda S, Baird N, Klase Z, Peethambaran B
PloS one 2019;14(5):e0217789
PloS one 2019;14(5):e0217789
Leptospira interrogans causes quantitative and morphological disturbances in adherens junctions and other biological groups of proteins in human endothelial cells.
Sato H, Coburn J
PLoS neglected tropical diseases 2017 Jul;11(7):e0005830
PLoS neglected tropical diseases 2017 Jul;11(7):e0005830
E-cadherin dynamics is regulated by galectin-7 at epithelial cell surface.
Advedissian T, Proux-Gillardeaux V, Nkosi R, Peyret G, Nguyen T, Poirier F, Viguier M, Deshayes F
Scientific reports 2017 Dec 6;7(1):17086
Scientific reports 2017 Dec 6;7(1):17086
A hypothesis-driven approach identifies CDK4 and CDK6 inhibitors as candidate drugs for treatments of adrenocortical carcinomas.
Hadjadj D, Kim SJ, Denecker T, Ben Driss L, Cadoret JC, Maric C, Baldacci G, Fauchereau F
Aging 2017 Dec 26;9(12):2695-2716
Aging 2017 Dec 26;9(12):2695-2716
Activating β-catenin signaling in CD133-positive dermal papilla cells increases hair inductivity.
Zhou L, Yang K, Xu M, Andl T, Millar SE, Boyce S, Zhang Y
The FEBS journal 2016 Aug;283(15):2823-35
The FEBS journal 2016 Aug;283(15):2823-35
No comments: Submit comment
Supportive validation
- Submitted by
- Invitrogen Antibodies (provider)
- Main image

- Experimental details
- Western blot analysis of beta-Catenin was performed by loading 50 µg of the indicated whole cell lysates onto a 4-20% Tris-HCl polyacrylamide gel. Proteins were transferred to a PVDF membrane and blocked with 5% BSA/TBST for at least 1 hour. The membrane was probed with a beta-Catenin monoclonal antibody (Product # MA1-301) at a dilution of 1:1000 overnight at 4°C on a rocking platform, washed in TBS-0.1%Tween 20, and probed with a goat anti-mouse IgG-HRP secondary antibody (Product # 31430) at a dilution of 1:20,000 for at least 1 hour. Chemiluminescent detection was performed using SuperSignal West Pico (Product # 34080).

- Submitted by
- Invitrogen Antibodies (provider)
- Main image
- Experimental details
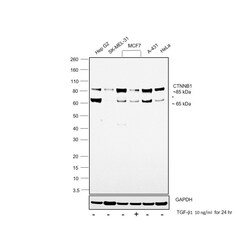
- Western blot was performed using Anti-beta Catenin Monoclonal Antibody (15B8) (Product # MA1-301) and a 85 kDa band corresponding to Catenin beta-1 was observed across the cell lines tested and decreased upon TGF-ß1 treatment in MCF7 cells. Also, there was a non specific band observed around 65 kDa. Whole cell extracts (30 µg lysate) of Hep G2 (Lane 1), SK-MEL-31 (Lane 2), MCF7 (Lane 3), MCF7 treated with 10 ng/mL of TGF-ß1 for 24 hours (Lane 4), A-431 (Lane 5) and HeLa (Lane 6) were electrophoresed using NuPAGE™ 4-12% Bis-Tris Protein Gel (Product # NP0322BOX). Resolved proteins were then transferred onto a Nitrocellulose membrane (Product # LC2002) by iBlot® 2 Dry Blotting System (Product # IB21001). The blot was probed with the primary antibody (1:1000 dilution) and detected by chemiluminescence with Goat anti-Mouse IgG (H+L) Superclonal™ Recombinant Secondary Antibody, HRP (Product # A28177, 1:4000 dilution) using the iBright FL 1000 (Product # A32752). Chemiluminescent detection was performed using Novex® ECL Chemiluminescent Substrate Reagent Kit (Product # WP20005).

Supportive validation
- Submitted by
- Invitrogen Antibodies (provider)
- Main image

- Experimental details
- Immunofluorescent analysis of Catenin beta in A431 cells. Cells were grown on chamber slides and fixed with formaldehyde prior to staining. Cells were probed without (control) or with a Catenin beta monoclonal antibody (Product # MA1-301) at a dilution of 1:200 overnight at 4 C, washed with PBS and incubated with a DyLight-488 conjugated secondary antibody (Product # 35503). Catenin beta staining (green), F-Actin staining with Phalloidin (red) and nuclei with DAPI (blue) is shown. Images were taken at 60X magnification.

- Submitted by
- Invitrogen Antibodies (provider)
- Main image

- Experimental details
- Immunofluorescent analysis of Catenin beta in HeLa cells. Cells were grown on chamber slides and fixed with formaldehyde prior to staining. Cells were probed without (control) or with a Catenin beta monoclonal antibody (Product # MA1-301) at a dilution of 1:200 overnight at 4 C, washed with PBS and incubated with a DyLight-488 conjugated secondary antibody (Product # 35503). Catenin beta staining (green), F-Actin staining with Phalloidin (red) and nuclei with DAPI (blue) is shown. Images were taken at 60X magnification.

- Submitted by
- Invitrogen Antibodies (provider)
- Main image

- Experimental details
- Immunofluorescent analysis of Catenin beta in NIH-3T3 cells. Cells were grown on chamber slides and fixed with formaldehyde prior to staining. Cells were probed without (control) or with a Catenin beta monoclonal antibody (Product # MA1-301) at a dilution of 1:200 overnight at 4 C, washed with PBS and incubated with a DyLight-488 conjugated secondary antibody (Product # 35503). Catenin beta staining (green), F-Actin staining with Phalloidin (red) and nuclei with DAPI (blue) is shown. Images were taken at 60X magnification.

- Submitted by
- Invitrogen Antibodies (provider)
- Main image

- Experimental details
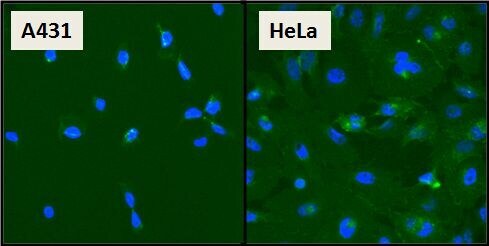
- Immunofluorescent analysis of beta-Catenin (green) in A431 and HeLa cells. Formalin fixed cells were permeabilized with 0.1% Triton X-100 in TBS for 10 minutes at room temperature and blocked with 1% Blocker BSA (Product # 37525) for 15 minutes at room temperature. Cells were probed with a monoclonal antibody (Product # MA1-301), at a dilution of 1:50 for at least 1 hour at room temperature, washed with PBS, and incubated with DyLight 488 goat anti-mouse IgG secondary antibody (Product # 35502) at a dilution of 1:400 for 30 minutes at room temperature. Nuclei (blue) were stained with Hoechst 33342 dye (Product # 62249). Images were taken on a Thermo Scientific ArrayScan at 20X magnification.
Supportive validation
- Submitted by
- Invitrogen Antibodies (provider)
- Main image

- Experimental details
- Immunohistochemistry was performed on cancer biopsies of deparaffinized Human colon carcinoma tissue. To expose target proteins, heat induced antigen retrieval was performed using 10mM sodium citrate (pH6.0) buffer, microwaved for 8-15 minutes. Following antigen retrieval tissues were blocked in 3% BSA-PBS for 30 minutes at room temperature and probed with a Catenin beta monoclonal antibody (Product # MA1-301) at a dilution of 1:200 or without primary antibody (negative control) overnight at 4°C in a humidified chamber. Tissues were washed with PBST and endogenous peroxidase activity was quenched with a peroxidase suppressor. Detection was performed using a biotin-conjugated secondary antibody and SA-HRP, followed by colorimetric detection using DAB. Tissues were counterstained with hematoxylin and prepped for mounting.

- Submitted by
- Invitrogen Antibodies (provider)
- Main image

- Experimental details
- Immunohistochemistry was performed on normal biopsies of deparaffinized Human stomach tissue. To expose target proteins, heat induced antigen retrieval was performed using 10mM sodium citrate (pH6.0) buffer, microwaved for 8-15 minutes. Following antigen retrieval tissues were blocked in 3% BSA-PBS for 30 minutes at room temperature and probed with a Catenin beta monoclonal antibody (Product # MA1-301) at a dilution of 1:200 or without primary antibody (negative control) overnight at 4°C in a humidified chamber. Tissues were washed with PBST and endogenous peroxidase activity was quenched with a peroxidase suppressor. Detection was performed using a biotin-conjugated secondary antibody and SA-HRP, followed by colorimetric detection using DAB. Tissues were counterstained with hematoxylin and prepped for mounting.

Supportive validation
- Submitted by
- Invitrogen Antibodies (provider)
- Main image

- Experimental details
- NULL

- Submitted by
- Invitrogen Antibodies (provider)
- Main image
- Experimental details
- NULL

- Submitted by
- Invitrogen Antibodies (provider)
- Main image

- Experimental details
- NULL

- Submitted by
- Invitrogen Antibodies (provider)
- Main image

- Experimental details
- NULL

- Submitted by
- Invitrogen Antibodies (provider)
- Main image

- Experimental details
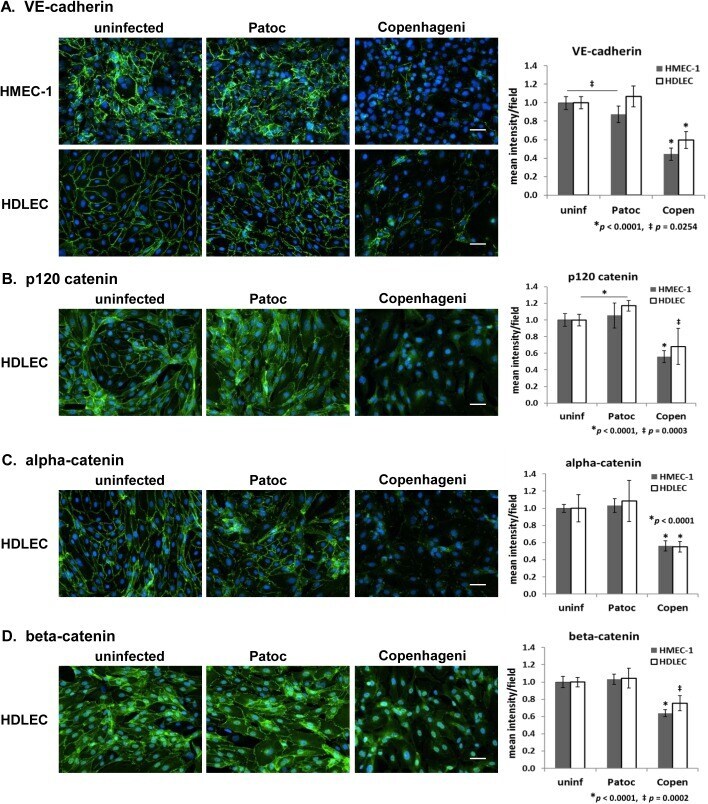
- Fig 4 Effect of Leptospira infection on adherens junction proteins in endothelial cells detected by immunofluorescence microscopy. (A) VE-cadherin, (B) p120 catenin, (C) alpha-catenin, and (D) beta-catenin in HMEC-1 and HDLEC are shown in green. The nuclei are stained in blue for all panels. Scale bars represent 50 mum. Quantified signal intensity of the host protein is indicated in the right-hand graphs (mean +/- SD, p -value is indicated below or inside the graph, the independent p -values shown as an asterisk or a double-dagger for Copenhageni are compared to uninfected and Patoc-infected cells).
- Submitted by
- Invitrogen Antibodies (provider)
- Main image

- Experimental details
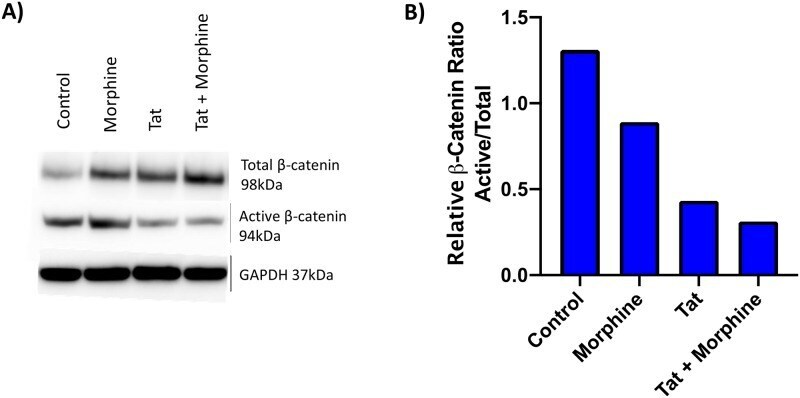
- Fig 3 Expression of HIV-1 Tat in PFAs results in loss of active beta-catenin protein levels. PFAs (Donor #1) were transfected with empty vector (pUC19) or the Flag-Tat 101 WT (0.35 ng) expression vector. 24 hours post-transfection, cells were treated with or without Morphine (500 nm). Cells were collected and lysed for SDS-PAGE and western blotting 24 hours post-treatment (A) Proteins extracts were immunoblotted for total beta-catenin, active beta-catenin, and GAPDH. (B) Densitometry was performed on the resulting immunoblot and used to determine the ratio of active to total beta-catenin for each condition. Data shown is from one experiment.
- Submitted by
- Invitrogen Antibodies (provider)
- Main image

- Experimental details
- Figure 1. miR-125a-5p reverses epithelial-mesenchymal transition in MCF7/Adr cells. (A) Transfection efficiency of mimics was determined via reverse transcription-quantitative PCR. miR-125a-5p was overexpressed after transfection of mimics in MCF-7/Adr cells. (B) Cell morphological alterations after miR-125a-5p transfection, as indicated by arrows. Images of cells in medium. The cells of NC groups remained elongated and dispersed with a mesenchymal morphology, and the cells of miR-125a-5p groups were closely packed and rounded with a cobblestone epithelial morphology; magnification, x200 (scale bar, 20 um). (C) Western blot analysis of TAFAZZIN, TG2, AKT, E-cadherin, N-cadherin, vimentin and beta-catenin in MCF7/Adr cells. (D and E) Semi-quantification of protein expression results from panel (C). GAPDH served as an internal control. Data are presented as the mean +- SD. Similar results were obtained from three independent experiments. *P

- Submitted by
- Invitrogen Antibodies (provider)
- Main image

- Experimental details
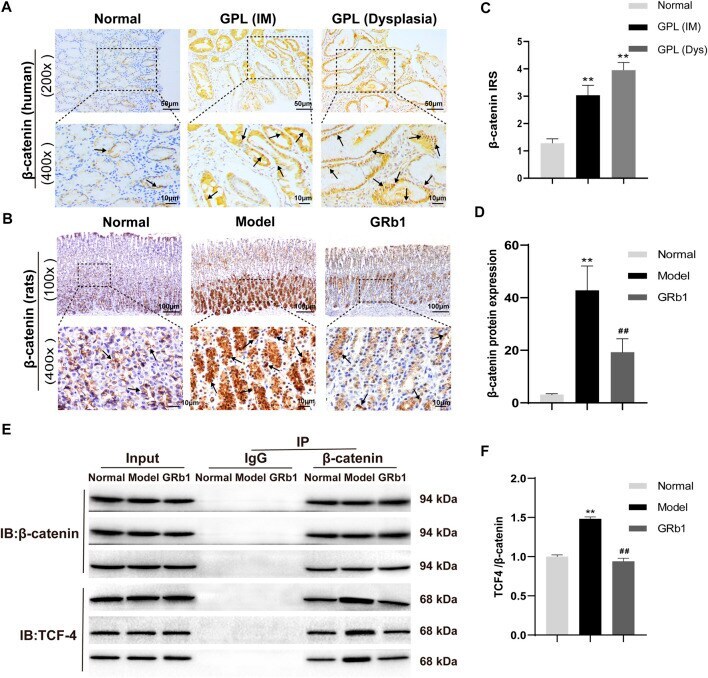
- FIGURE 4 Expression patterns of beta-catenin in both human and animal GPL specimens, and the effects of GRb1 on beta-Catenin/TCF4 interaction in GPL model rats. Representative IHC images demonstrating the expression localization of beta-catenin in epithelial epithelium from (A) human specimens (magnification x200, x400) and (B) animal samples (magnification x100, x400). (C) Semi-quantitative analysis of beta-catenin protein expression in human specimens ( n = 179). (D) Semi-quantitative analysis of beta-catenin protein expression levels in animal samples ( n = 10). (E) Representative bands illustrate the beta-Catenin/TCF4 interaction. Immune precipitation for beta-catenin was performed with an IgG antibody as a control, and then TCF4 was detected using western blotting. (F) Quantification of the intensities of western blotting bands ( n = 6). * p < 0.05 and ** p < 0.01 vs. Normal group. # p < 0.05 and ## p < 0.01 vs. Model group. Data are presented as mean +- SEM. Abbreviations: GRb1, ginsenoside Rb1; GPL, gastric precancerous lesions; TCF4, transcription factor 7-like two; IHC, immunohistochemistry; SEM, standard error of mean.
- Submitted by
- Invitrogen Antibodies (provider)
- Main image

- Experimental details
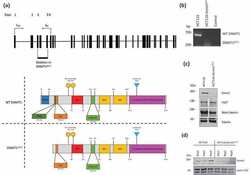
- 10.1371/journal.pone.0246707.g002 Fig 2 ( A ) Schematic of the canonical Wnt signalling pathway and summary of key proteins analysed in this study. Proteins identified in the mass-spectrometry study are shown, those not analysed by Western blot are shown in grey. Western blot analysis of canonical Wnt components and GSK3beta protein expression characterization in cell models. 15 mug of total protein lysates from each cell-line were analyzed on a single phase 8% SDS gel and alpha-actin used as loading control. All were replicated in at least n = 3 unless indicated otherwise. Quantifications (arbitrary intensity units) are mean values +- SEM (Mann-Whitney U test p-value indicated). ( B ) Protein expression of GSK3beta and beta-catenin in HCT116 cells (independently sourced isolate), HCT116-GSK3beta-KO cells and HCT116-GSK3beta-WT cells. ( C ) beta-catenin, ( D ) TCF3 and TCF4, ( E ) Axin 2, ( F ) DVL2 and DVL3 (n = 2). All Westerns are representative examples, and quantifications are expressed as arbitrary intensity units. ( G ) TopFLASH reporter assay of canonical Wnt signalling activity in HCT116-GSK3beta-WT and HCT116-GSK3beta-KO cells. Cells were transfected with TopFLASH plasmids, TopFLASH luciferase activity was assessed 48 hours post-transfection following passive lysis of cells. Luciferase signaling was normalized to Renilla transfection control. p-value 0.064, n = 3.

- Submitted by
- Invitrogen Antibodies (provider)
- Main image

- Experimental details
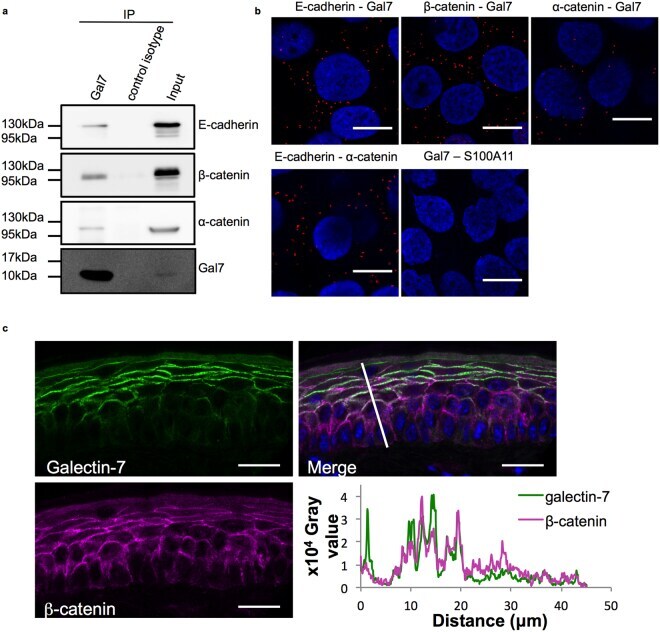
- Figure 2 Galectin-7 interacts and colocalizes with adherens junction components. ( a ) Co-immunoprecipitation experiments indicate that galectin-7 is a partner of E-cadherin, alpha-catenin and beta-catenin. Images shown are representative images taken from distinct western blots. ( b ) Confocal images of Proximity Ligation Assays confirming that galectin-7 is in close proximity with distinct AJ components in the cell context. E-cadherin - alpha-catenin and galectin-7 - S100A11 pairs were used as respectively positive and negative controls. Gal7 = Galectin-7. Scale bars = 15 mum. ( c ) Representative immunostaining of galectin-7 (green) and beta-catenin (magenta) in WT mice tail epidermis showing co-localisation of these two proteins. Scale bar = 20 mum. Intensity values measured along the white line were plotted in function of the distance from the base of the epidermis. Pearson's r coefficient for galectin-7 / beta-catenin staining = 0.63 +- 0.03, n = 6.
- Submitted by
- Invitrogen Antibodies (provider)
- Main image
- Experimental details
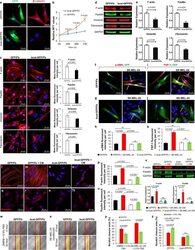
- Fig. 1 beta-catenin is essential for the functional properties of stromal fibroblasts. a GFP/Fb and bcat-GFP/Fb were induced by addition of 500 ng/mL doxycycline to the culture medium for 72 h. Left: GFP expression in GFP/Fb and bcat-GFP/Fb; right: representative images of beta-catenin immunofluorescence staining of GFP/Fb and bcat-GFP/Fb. Scale bar: 50 mum. b The viability of GFP/Fb and bcat-GFP/Fb was compared using the MTT assay. The cells were collected at 0, 24, 48, and 72 h. The data are representative of three independent experiments. c Expression of F-actin, paxillin, vimentin and fibronectin (red) in GFP/Fb and bcat-GFP/Fb was determined by immunostaining after a three-day doxycycline induction with DAPI counterstaining (blue). Scale bar: 50 mum. The mean fluorescence intensities of each immunostained protein in individual GFP/Fb and bcat-GFP/Fb cells were determined using ImageJ. d Expression of F-actin, paxillin, vimentin and fibronectin was measured in total protein extracted from 1 x 10 5 GFP/Fb and bcat-GFP/Fb cells by Western blotting. GAPDH was used as an internal control. e The intensities of the bands of the indicated proteins expressed in GFP/Fb and bcat-GFP/Fb were normalized to the GAPDH signal. The data are representative of three independent experiments. f - g alpha-SMA immunofluorescence staining of GFP/Fb, GFP/Fb + SK-MEL-24 coculture, bcat-GFP/Fb, and bcat-GFP/Fb + SK-MEL-24 coculture with DAPI nuclear costaining. GFP/Fb and bcat-GFP/Fb were tagged w

- Submitted by
- Invitrogen Antibodies (provider)
- Main image

- Experimental details
- Fig. 5 beta-catenin interacts with YAP in human stromal fibroblasts. a - c Coimmunoprecipitation analysis. Total GFP/Fb and bcat-GFP/FB protein lysates were subjected to immunoprecipitation (IP) using the indicated antibodies: anti-beta-catenin antibody and mouse IgG. a Immuno-complexes were analyzed by Western blotting with an anti-YAP antibody. b The middle panel shows the presence of YAP protein in cell lysates. c . Actin expression in the column wash through from IP. d - l PLA was performed to confirm the YAP and beta-catenin interaction. GFP/Fb and bcat-GFP/Fb were seeded in chamber slides for PLA. A clear YAP-beta-catenin interaction can be seen in GFP/Fb e but not bcat-GFP/Fb h . f Nuclear YAP-beta-catenin interaction can be seen in the nuclei of GFP/Fb. N-cadherin was used as a positive control d , g , and keratin 14 was used as a negative control i . No signal could be detected in the beta-catenin antibody-only treatment j , YAP antibody only treatment k and mouse IgG + rabbit IgG treatment l . m - v Wnt signaling regulates YAP nuclear translocation. GFP/Fb and bcat-GFP/Fb were seeded in chamber slides and treated with DMEM with 0.5% FBS m , n , SK-MEL-24 CM o , p , 100 muM ICG-00 q , r , 100 muM isoquercitrin s , t and 100 ng/mL WNT3A u , v . Yellow arrows indicate the cells expressing nuclear YAP. The pictures shown are representative of three independent experiments. w The mean fluorescence intensities of cytoplasmic YAP in individual GFP/Fb and bcat-GFP/Fb when c
