Explore
 Validate
 Learn
Learn Western blot
 ELISA
ELISAAntibody data
- Antibody Data
- Antigen structure
- References [1]
- Comments [0]
- Validations
- Western blot [2]
- Immunocytochemistry [1]
- Other assay [3]
Submit
Validation data
Reference
Comment
Report error
- Product number
- MA1-24682 - Provider product page

- Provider
- Invitrogen Antibodies
- Product name
- FGF2 Monoclonal Antibody (FB-8)
- Antibody type
- Monoclonal
- Antigen
- Recombinant full-length protein
- Description
- Recommended positive controls: recombinant human FGF2. This antibody does not cross react with human acidic FGF. Store product as a concentrated solution. Centrifuge briefly prior to opening the vial.
- Reactivity
- Human, Bovine
- Host
- Mouse
- Isotype
- IgG
- Antibody clone number
- FB-8
- Vial size
- 100 μL
- Concentration
- 2.3 mg/mL
- Storage
- Store at 4°C short term. For long term storage, store at -20°C, avoiding freeze/thaw cycles.
Submitted references Activation of β2-Adrenergic Receptor Promotes Growth and Angiogenesis in Breast Cancer by Down-regulating PPARγ.
Zhou J, Liu Z, Zhang L, Hu X, Wang Z, Ni H, Wang Y, Qin J
Cancer research and treatment 2020 Jul;52(3):830-847
Cancer research and treatment 2020 Jul;52(3):830-847
No comments: Submit comment
Supportive validation
- Submitted by
- Invitrogen Antibodies (provider)
- Main image
- Experimental details
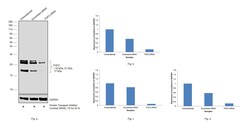
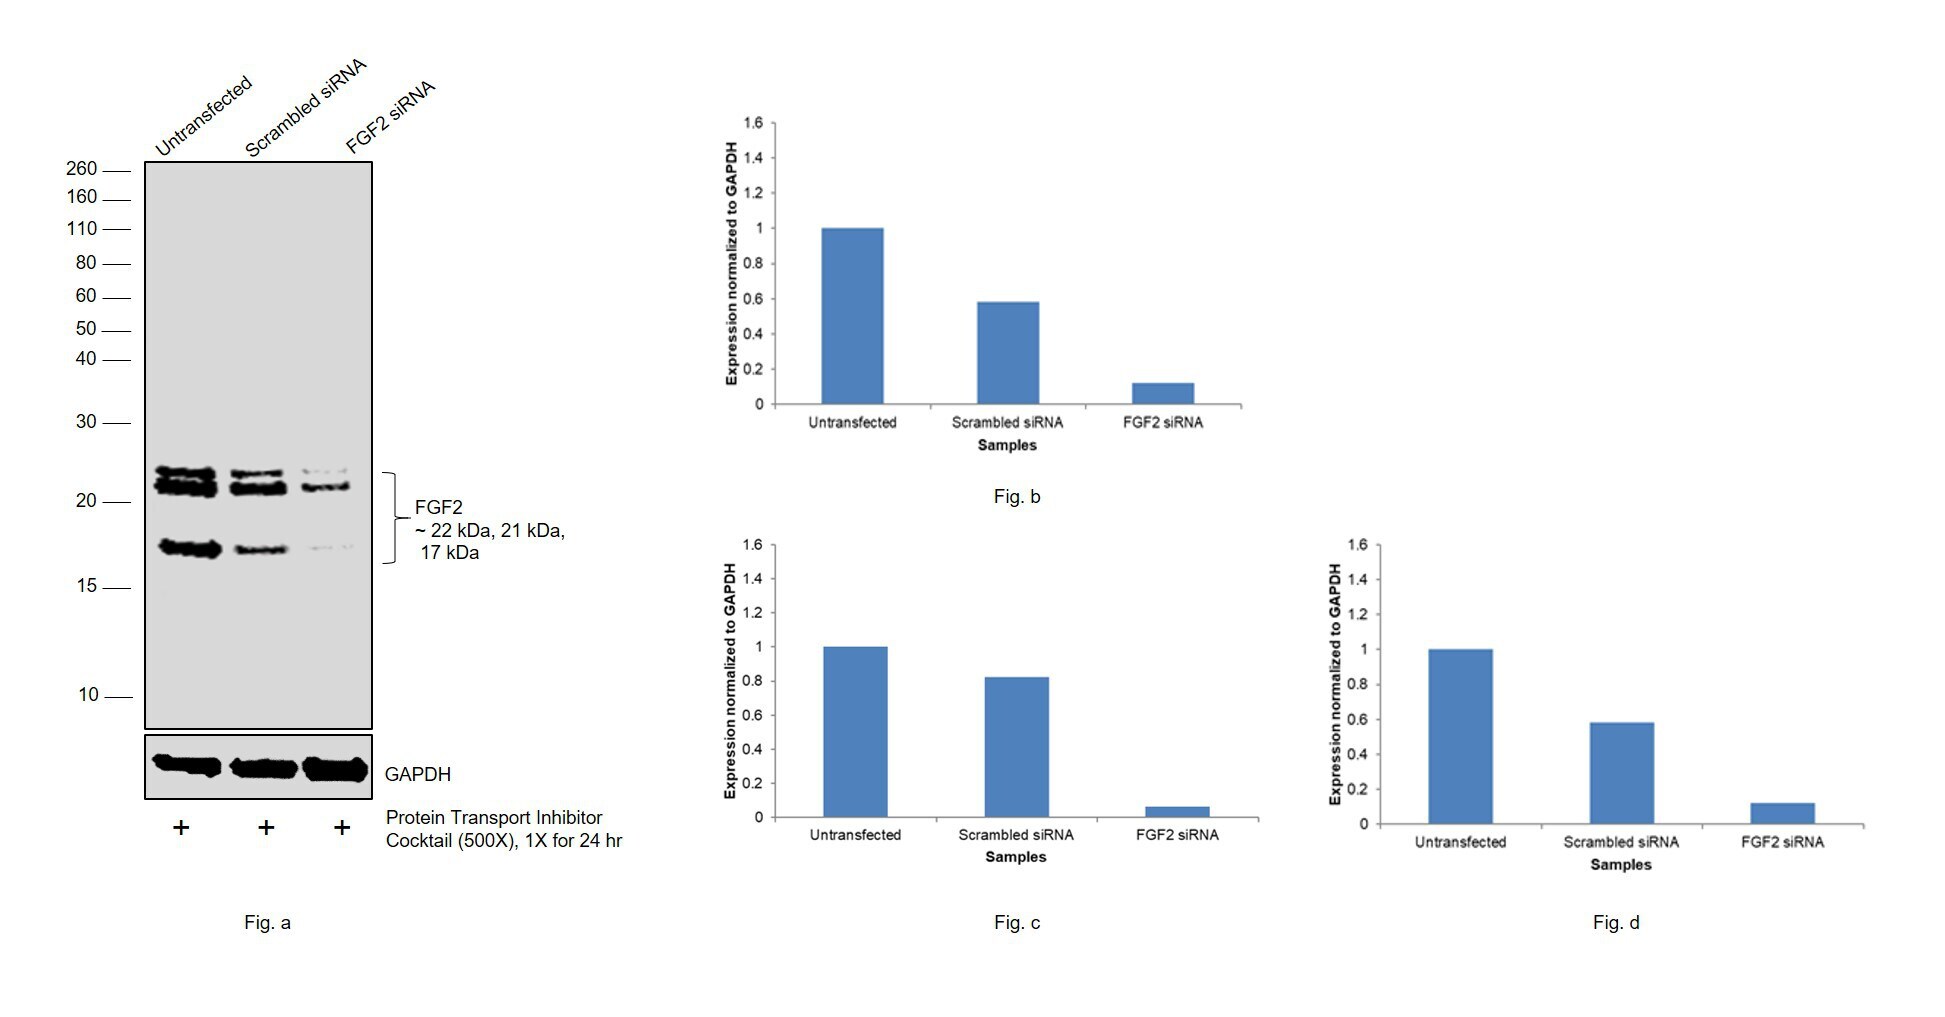
- Knockdown of FGF2 was achieved by transfecting BJ with FGF2 specific siRNAs (Silencer® select Product # s223530, s5128). Western blot analysis (Fig. a) was performed using whole cell extracts from the FGF2 knockdown cells Lane 3), non-targeting scrambled siRNA transfected cells (Lane 2) and untransfected cells (Lane 1). Considering that FGF2 is a secretory protein and detection with total lysates is low in western blot application, untransfected, scrambled, FGF2 siRNA transfected cells were treated with PTI post-transfection to allow for their accumulation within the cells. The blot was probed with FGF2 Monoclonal Antibody (FB-8) (Product # MA1-24682, 1:2000) and Goat anti-Mouse IgG (H+L) Superclonal™ Recombinant Secondary Antibody, HRP (Product # A28177, 1:8000 dilution). Fig. b represents densitometric analysis of the ~ 22 kDa band, Fig. c the ~ 21 kDa band and Fig.d the ~ 17 kDa band. Decrease in signal upon siRNA mediated knock down confirms that antibody is specific to FGF2.
- Submitted by
- Invitrogen Antibodies (provider)
- Main image
- Experimental details
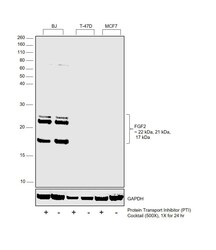
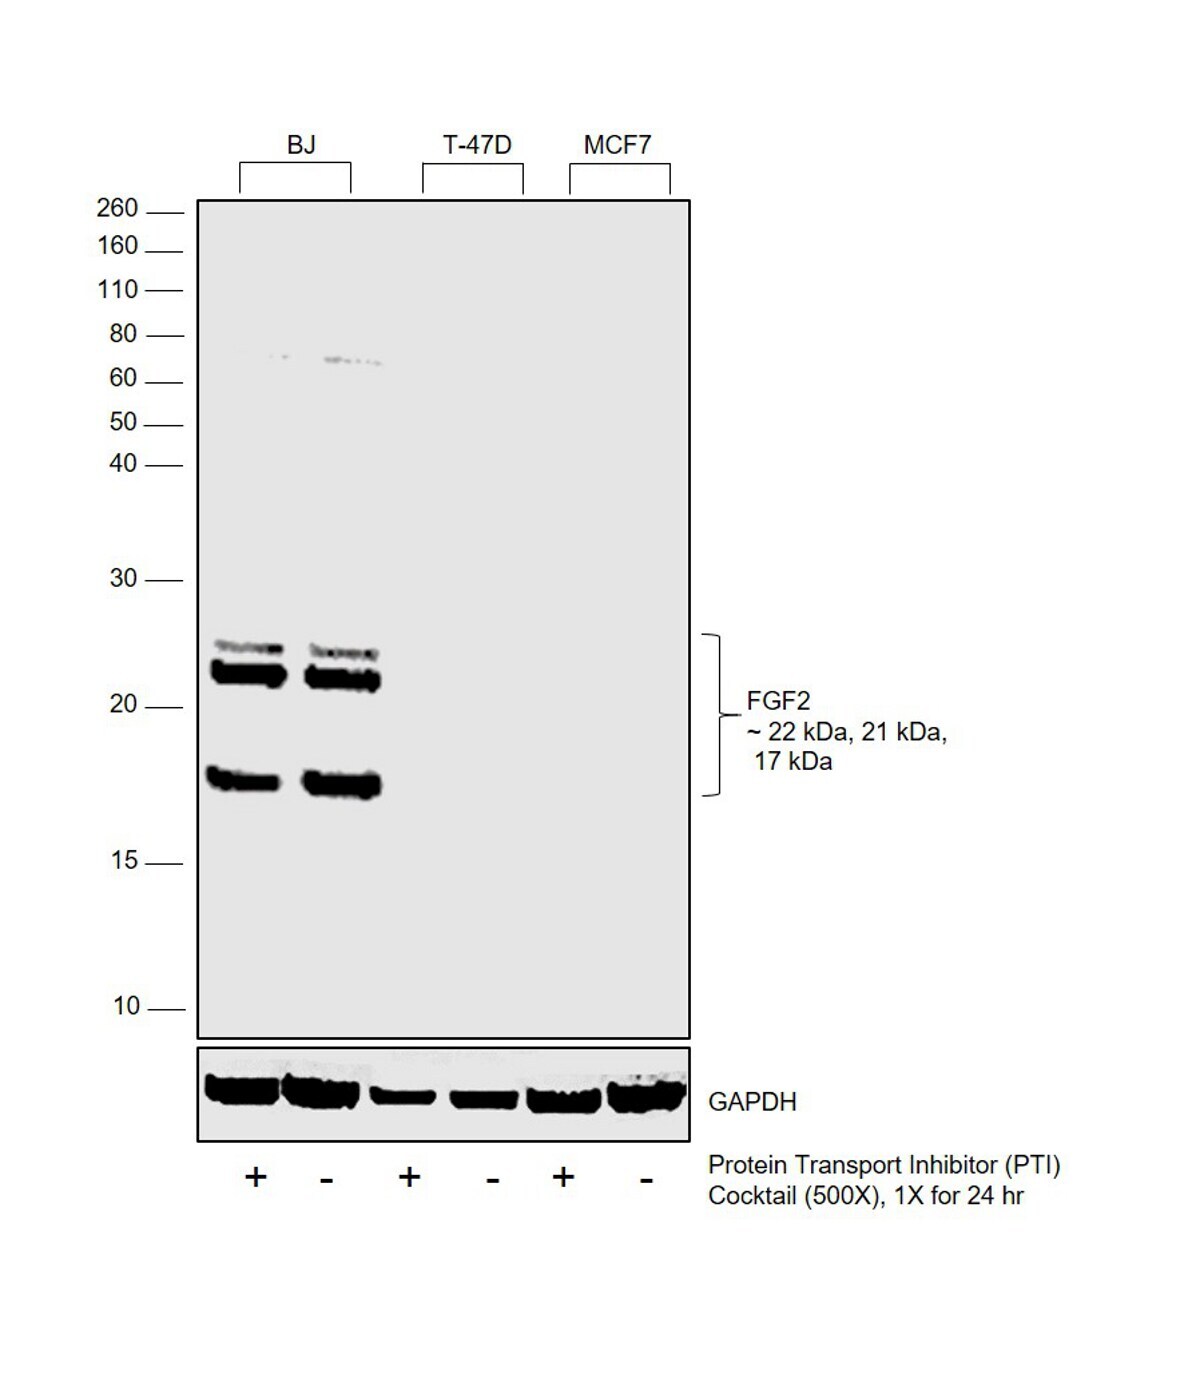
- Western blot was performed using Anti-FGF2 Monoclonal Antibody (FB-8) (Product # MA1-24682) and 17 kDa, 21 kDa and 22 kDa bands corresponding to FGF2 was observed in fibroblast cell model BJ but not in MCF7 and T-47D. Whole cell extracts (30 µg lysate) of BJ treated with PTI (1X for 4 hours) (Lane 1), untreated BJ (Lane 2), T-47D treated with PTI (1X for 4 hours) (Lane 3), untreated T-47D (Lane 4), MCF7 treated with PTI (1X for 4 hours) (Lane 5) and untreated MCF7 (Lane 6) were electrophoresed using NuPAGE™ 12% Bis-Tris Protein Gel (Product # NP0341BOX). Resolved proteins were then transferred onto a Nitrocellulose membrane (Product # IB23001) by iBlot® 2 Dry Blotting System (Product # IB21001). The blot was probed with the primary antibody (1:2000 dilution) and detected by chemiluminescence with Goat anti-Mouse IgG (H+L) Superclonal™ Recombinant Secondary Antibody, HRP (Product # A28177,1:8000 dilution) using the iBright FL 1000 (Product # A32752). Chemiluminescent detection was performed using Novex® ECL Chemiluminescent Substrate Reagent Kit (Product # WP20005). FGF2, a protein of the fibroblast growth factor family, is secreted in high abundance by fibroblast cell lines like BJ. Entrapment of FGF2 using PTI (a generic secretory pathway blocker) increases intracellular accumulation of the target in BJ but not in T-47D and MCF7 which are reported low expressing for the same.
Supportive validation
- Submitted by
- Invitrogen Antibodies (provider)
- Main image

- Experimental details
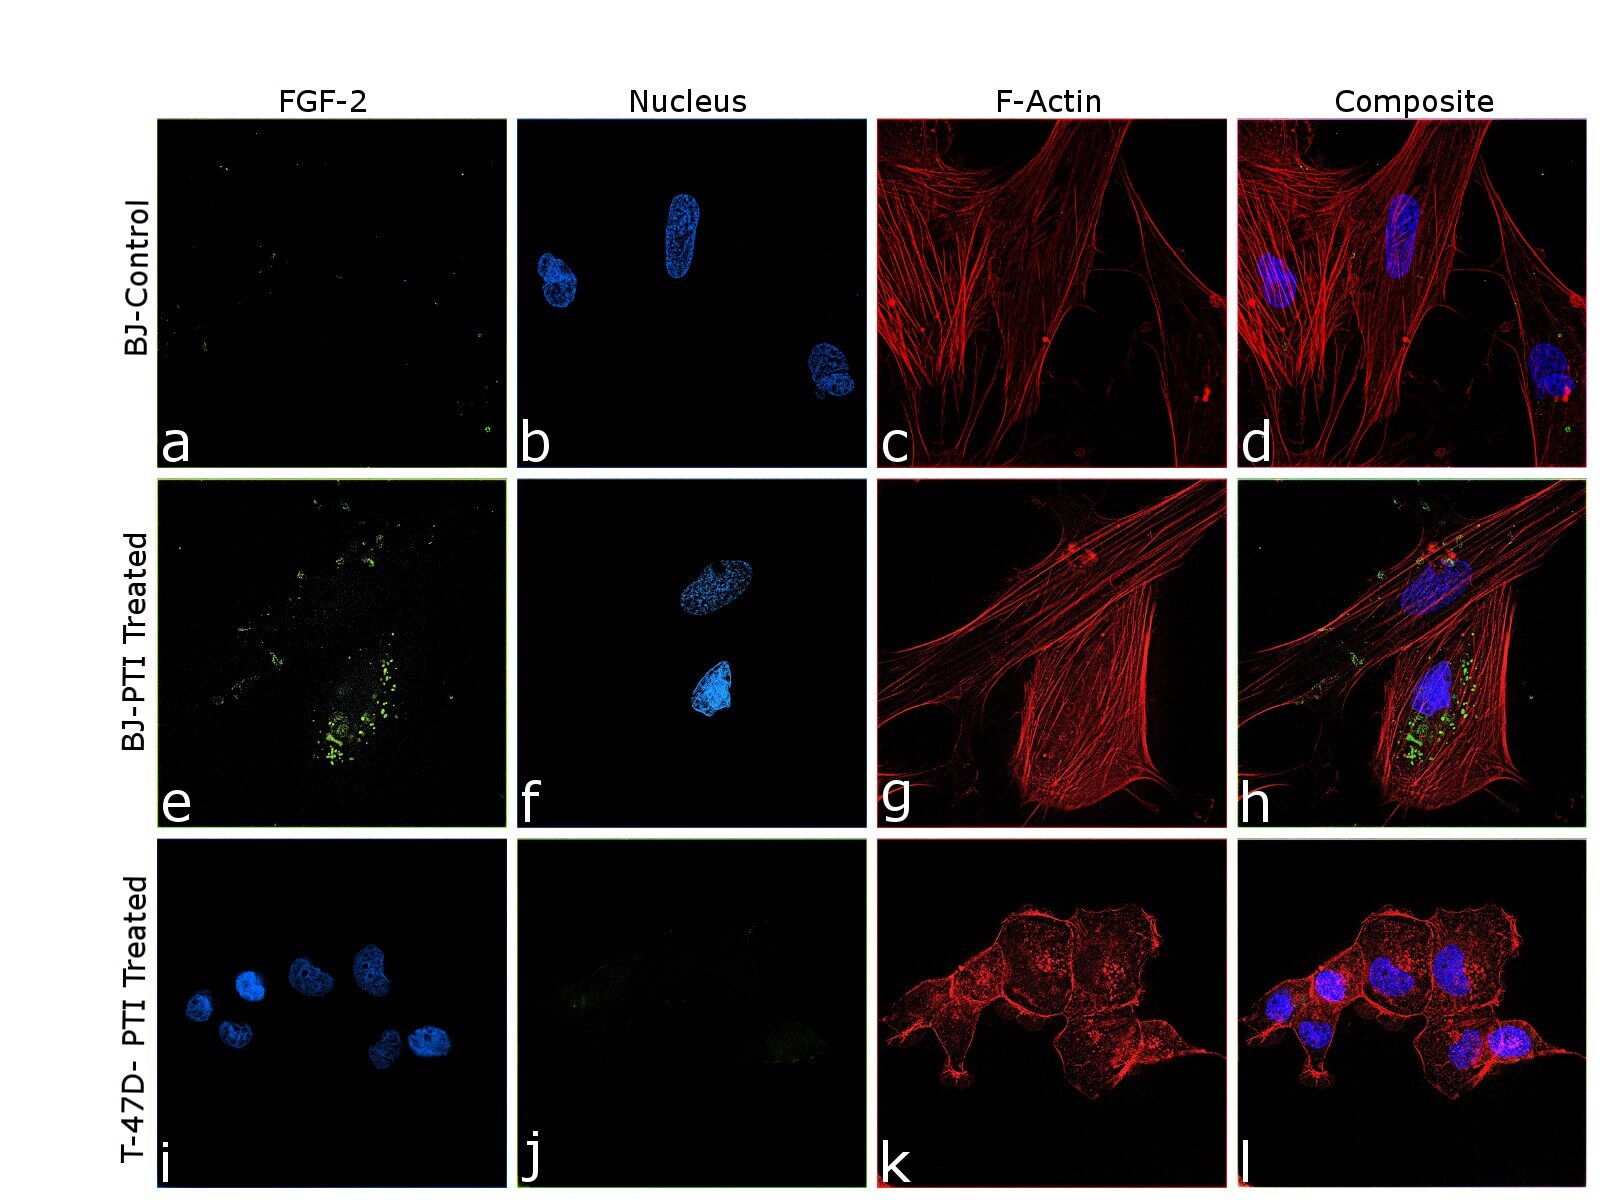
- Immunofluorescence analysis of FGF2 was performed using 80% confluent log phase BJ and T-47D, control and untreated, cells. Cells were fixed with 4% paraformaldehyde for 10 mins, permeabilized with 0.1% Triton™ X-100 for 10 mins, and blocked with 2% BSA for 45 mins at room temperature. The cells were labeled with FGF2 Monoclonal Antibody (FB-8) (Product # MA1-24682) at 1:100 in 0.1% BSA, incubated at 4 degree celsius overnight and labeled with Donkey anti-Mouse IgG (H+L) Highly Cross-Adsorbed Secondary Antibody, Alexa Fluor Plus 488 (Product # A32766), (1:2500 dilution), for 45 mins at room temperature (Panel a, e, i: Green). Nuclei (Panel b, f, j: Blue) were stained with ProLong™ Diamond Antifade Mountant with DAPI (Product # P36962). F-actin (Panel c, g, k: Red) was stained with Rhodamine Phalloidin (Product # R415, 1:300). Panel d represents merged image of untreated BJ cells showing faint staining for FGF2 that is enhanced upon PTI treatment to punctate cytoplasmic staining (Panel h). Panel l represents T-47D cells showing no staining for FGF2 upon PTI treatment. The images were captured at 60X magnification. FGF2 follows type I unconventional secretory pathway where it undergoes self-oligomerization and interacts with the inner and outer leaflets of the plasma membrane for its release. The punctate pattern of FGF2 seen in panel h is similar to that shown by Steringer et.al. of the intermediates and oligomers of FGF2 for membrane insertion.
Supportive validation
- Submitted by
- Invitrogen Antibodies (provider)
- Main image
- Experimental details
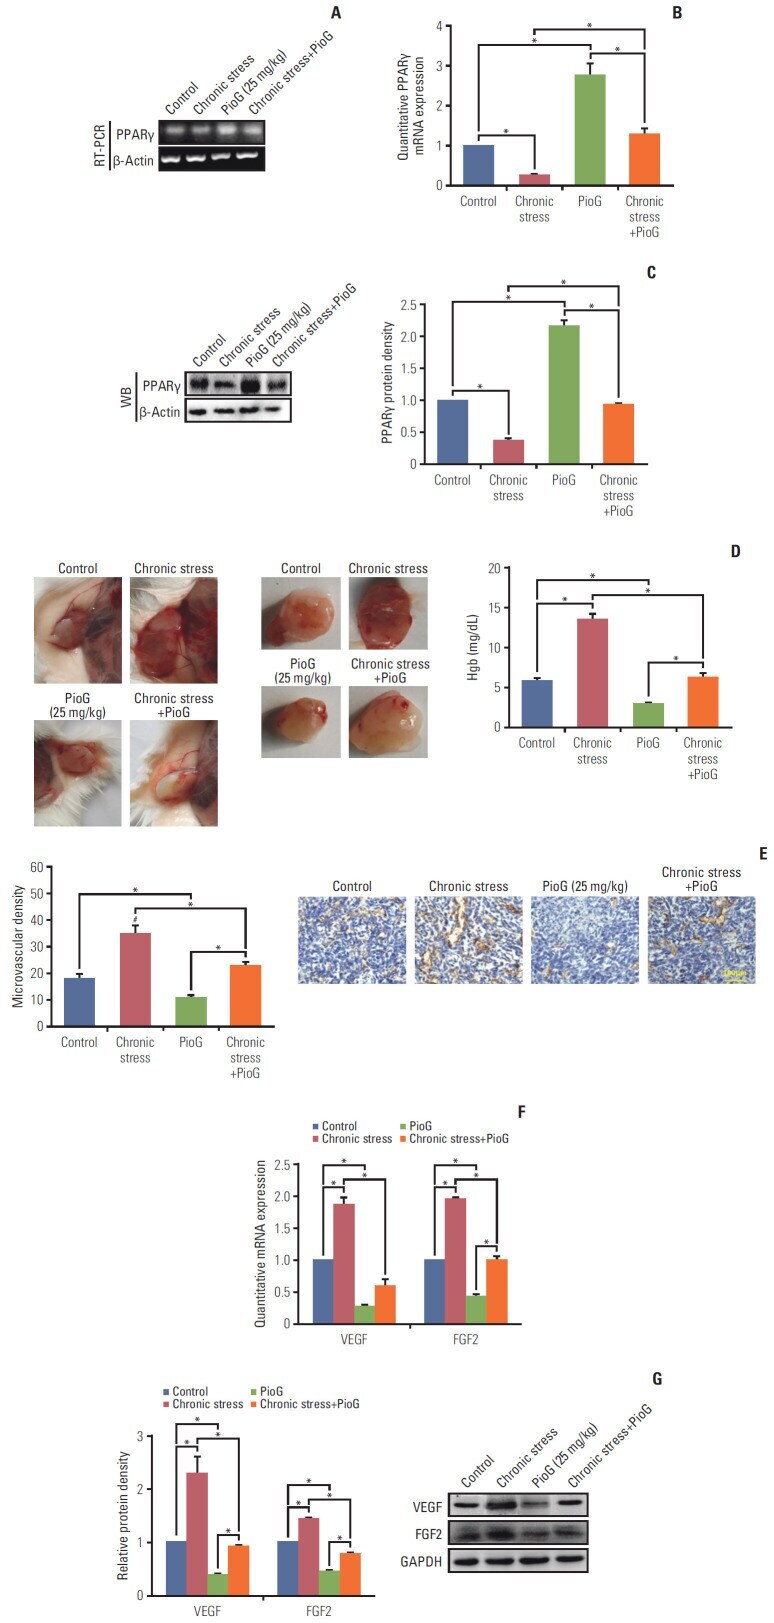
- Fig. 2. Effect of chronic stress alone or in combination with pioglitazone (PioG) on angiogenesis in vivo . (A, B) Peroxisome proliferator-activated receptor gamma (PPARgamma) mRNA expression by reverse transcription polymerase chain reaction (RT-PCR) and quantitative real-time PCR (qPCR) in the tumor tissue from different groups. (C) PPARgamma protein bands (left panel) and bar graph (right panel) in the tumor tissue from different groups. (D) Representative images of Matrigel plugs and newly formed blood vessels in the Matrigel (left panel) and hemoglobin (Hgb) content in the Matrigel matrix (right panel) in which we excised the Matrigel plugs and used them for quantification of angiogenesis. (E) Microvascular density was measured (left panel) and images of tumor section CD31 immunohistochemistry staining (right panel). (F) Quantitative vascular endothelial growth factor (VEGF) and fibroblast growth factor 2 (FGF2) mRNA expression in tumor tissues detected by qPCR. (G) VEGF and FGF2 protein levels in tumor tissues were detected by western blot (WB). GAPDH, glyceraldehyde 3-phosphate dehydrogenase. Values are presented as mean+-standard error of mean. * p < 0.05.
- Submitted by
- Invitrogen Antibodies (provider)
- Main image

- Experimental details
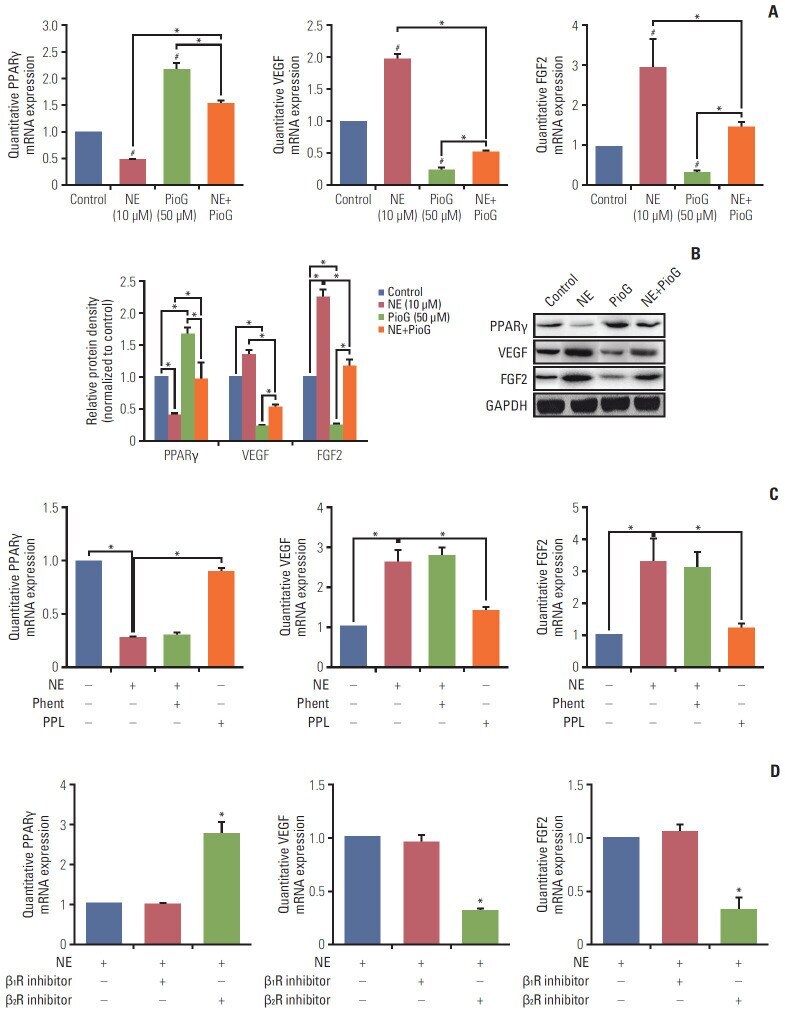
- Fig. 4. Effect of norepinephrine (NE) alone or in combination with pioglitazone (PioG) on proangiogenic factors expression in vitro . (A) Peroxisome proliferator-activated receptor gamma (PPARgamma), vascular endothelial growth factor (VEGF), and fibroblast growth factor 2 (FGF2) mRNA expression in 4T1 cells treated with NE (10 muM) alone or in combination with PioG (50 muM) by quantitative real-time polymerase chain reaction analysis. # p < 0.05 vs. control, * p < 0.05 vs. NE+PioG group. (B) PPARgamma, VEGF, and FGF2 protein expression by western blot in the same condition. GAPDH, glyceraldehyde 3-phosphate dehydrogenase. (C) PPARgamma, VEGF, and FGF2 mRNA expression in 4T1 cells treated with NE (10 muM) alone or in combination with alphaR inhibitor phent (1 muM) or betaR inhibitor propranolol (PPL, 1 muM). * p < 0.05. (D) PPARgamma, VEGF, and FGF2 mRNA expression in 4T1 cells treated with NE (10 muM) alone or in combination with beta 1 R inhibitor metoprolol (1 muM) or beta 2 R inhibitor ICI118551 (1 muM). * p < 0.05.
- Submitted by
- Invitrogen Antibodies (provider)
- Main image
- Experimental details
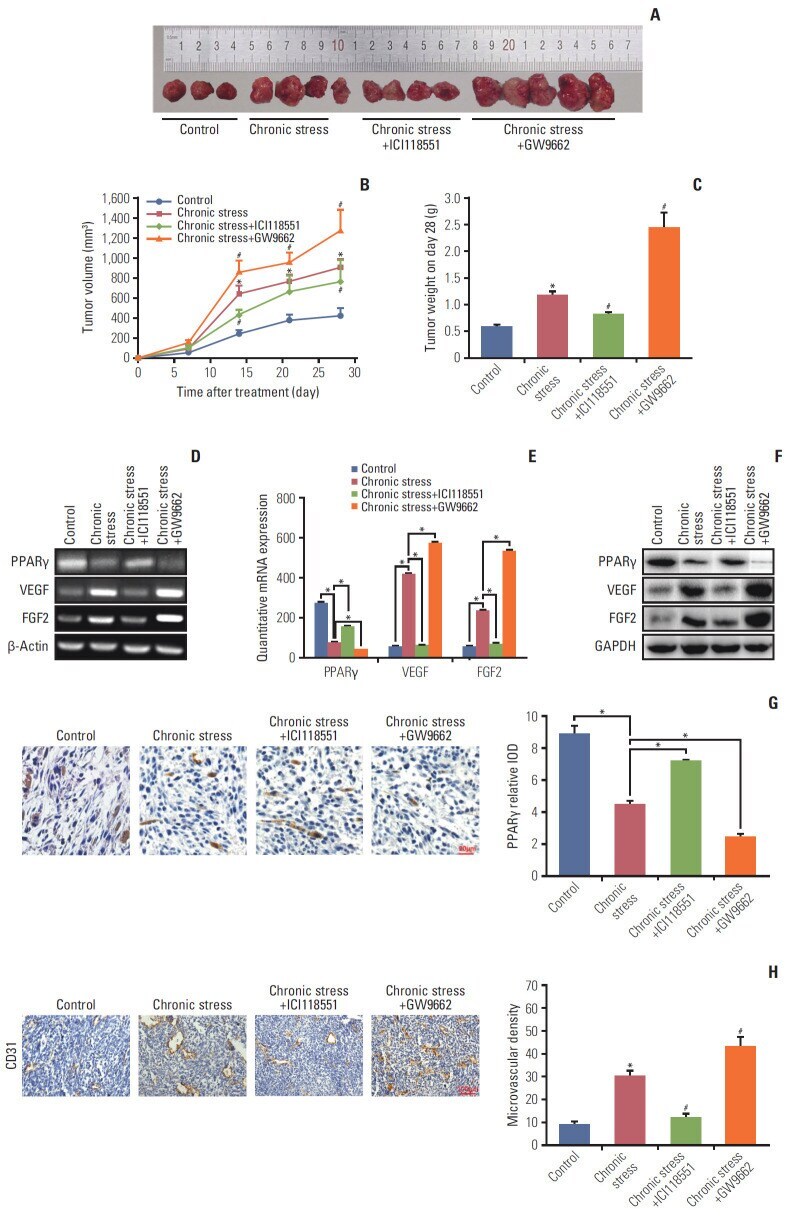
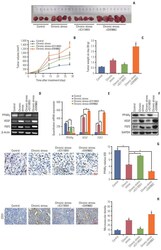
- Fig. 6. beta 2 receptor activation and peroxisome proliferator-activated receptor gamma (PPARgamma) inhibition is involved in chronic stress-induced tumor angiogenesis in vivo . (A) Representative tumor images from mice in control (n=4), ICI118551 (n=4) and GW9662 group (n=5). (B) Tumor growth curves. (C) Average tumor weight was measured on day 28. * p < 0.05 vs. control, # p < 0.05 vs. chronic stress. (D, E) PPARgamma, vascular endothelial growth factor (VEGF), and fibroblast growth factor 2 (FGF2) mRNA expression in tumor tissues by reverse transcription polymerase chain reaction (D) and quantitative real-time polymerase chain reaction (E). * p < 0.05. (F) PPARgamma, VEGF, and FGF2 protein expression in tumor tissues by western blot. GAPDH, glyceraldehyde 3-phosphate dehydrogenase. (G) Representative images (left panel) and bar graph (right panel) of PPARgamma expression detected in tumor tissue paraffin sections by immunohistochemistry staining. * p < 0.05. (H) Images of tumor section CD31 immunohistochemistry staining (left panel) and microvascular density was measured (right panel). * p < 0.05 vs. control, # p < 0.05 vs. chronic stress.