Explore
 Validate
 Learn
Learn Immunocytochemistry
Antibody data
- Antibody Data
- Antigen structure
- References [1]
- Comments [0]
- Validations
- Immunocytochemistry [1]
- Other assay [3]
Submit
Validation data
Reference
Comment
Report error
- Product number
- 11-9938-80 - Provider product page

- Provider
- Invitrogen Antibodies
- Product name
- Cytokeratin 8 Monoclonal Antibody (LP3K), FITC, eBioscience™
- Antibody type
- Monoclonal
- Antigen
- Other
- Description
- Description: This LP3K monoclonal antibody reacts with human cytokeratin 8 (K8), a 55-kDa member of the family of intermediate filament proteins. Cytokeratin 8 is a type II (or basic) keratin that is expressed in epithelial and carcinoma cells. Cytokeratins form the intracellular cytoskeletal network that maintains the integrity and stability of cells and tissues. More specifically, studies have demonstrated the involvement of cytokeratin 8 in protection against apoptosis, stress, or injury, as well as regulation of the cell cycle. This keratin is frequently co-expressed with cytokeratin 18, a type I (or acidic) keratin as a heterodimer. Although detected primarily in the cytoplasm of normal healthy cells, cytokeratin 8 has been found to localize to the plasma membrane in some tumor cells. Finally, cytokeratin 8 is phosphorylated on serine 73 in dividing cells.
- Conjugate
- Green dye
- Antibody clone number
- LP3K
- Concentration
- 0.5 mg/mL
Submitted references SeqStain is an efficient method for multiplexed, spatialomic profiling of human and murine tissues.
Rajagopalan A, Venkatesh I, Aslam R, Kirchenbuechler D, Khanna S, Cimbaluk D, Kordower JH, Gupta V
Cell reports methods 2021 Jun 21;1(2)
Cell reports methods 2021 Jun 21;1(2)
No comments: Submit comment
Supportive validation
- Submitted by
- Invitrogen Antibodies (provider)
- Main image

- Experimental details
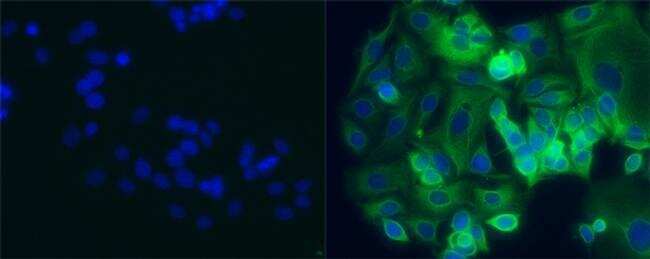
- Immunocytochemistry of fixed MCF7 cells using 10 µg/mL of mouse IgG1 isotype control FITC (Product # 11-4714-42) (left) or Anti-Human Cytokeratin 8 FITC (right). Nuclei are counterstained with DAPI.
- Conjugate
- Green dye
Supportive validation
- Submitted by
- Invitrogen Antibodies (provider)
- Main image
- Experimental details
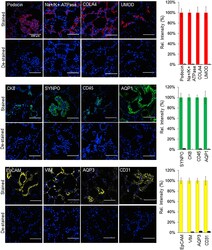
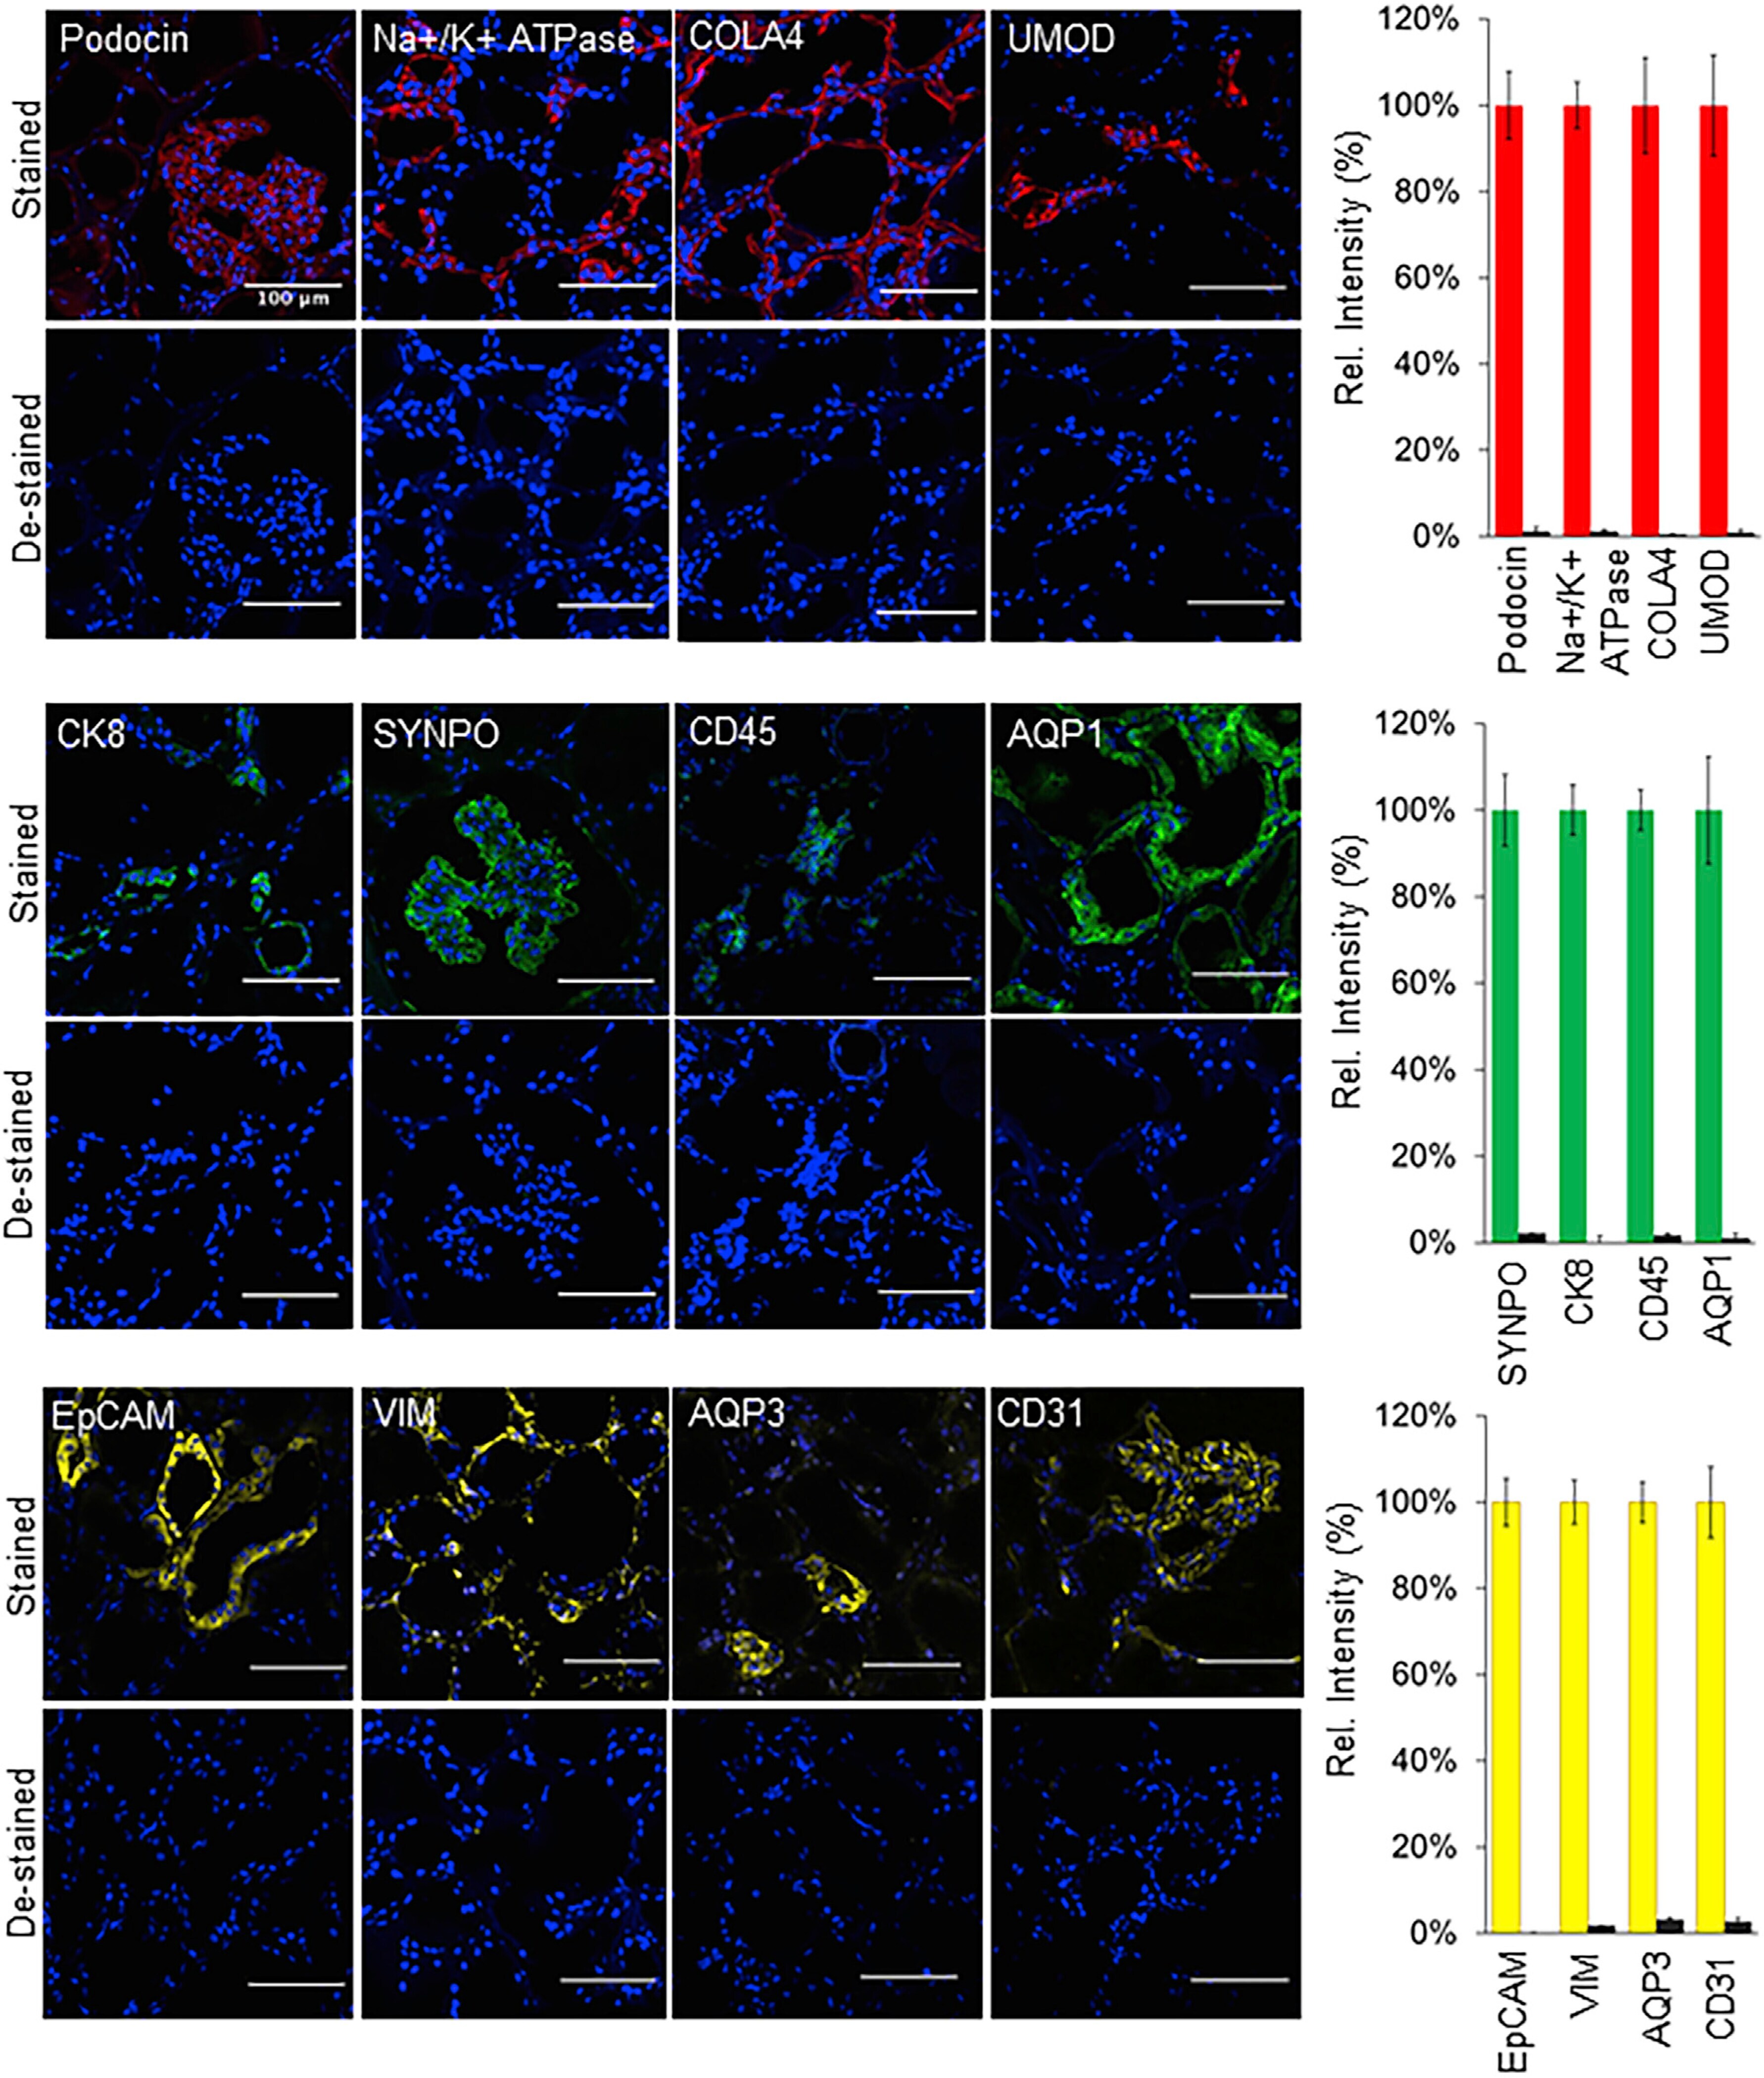
- Figure 3. Enzymatic de-staining of tissues stained using the SeqStain antibodies Immunofluorescence images showing human kidney tissue sections stained using SeqStain antibodies (as indicated in the panel). The antibodies were labeled using either the AF488 fluorophore (shown in green), the Cy3 fluorophore (shown in red), or the Cy5 fluorophore (shown in yellow). Immunofluorescence images of these tissue sections after de-staining with DNase I treatment are shown below each panel. All images are representative of at least three replicates. Graphs showing quantification of fluorescence intensity after staining (red bars, green bars, or yellow bars) and de-staining (brown bars) in each panel is also presented on the right. Graphs show the mean +- SD. Scale bar, 100 mum.
- Conjugate
- Green dye
- Submitted by
- Invitrogen Antibodies (provider)
- Main image
- Experimental details
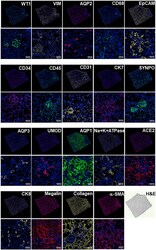
- Figure 6. SeqStain-based multiplex imaging of whole human kidney tissue provides a 20-plex image Immunofluorescent images of whole kidney tissue sections after each round of staining with unique SeqStain antibodies (as indicated) and DAPI (as indicated in the panel). Zoomed-in sections of images are presented below each panel. A serial section stained with H&E is also presented. Scale bars, 100 mum.
- Conjugate
- Green dye

- Submitted by
- Invitrogen Antibodies (provider)
- Main image
- Experimental details
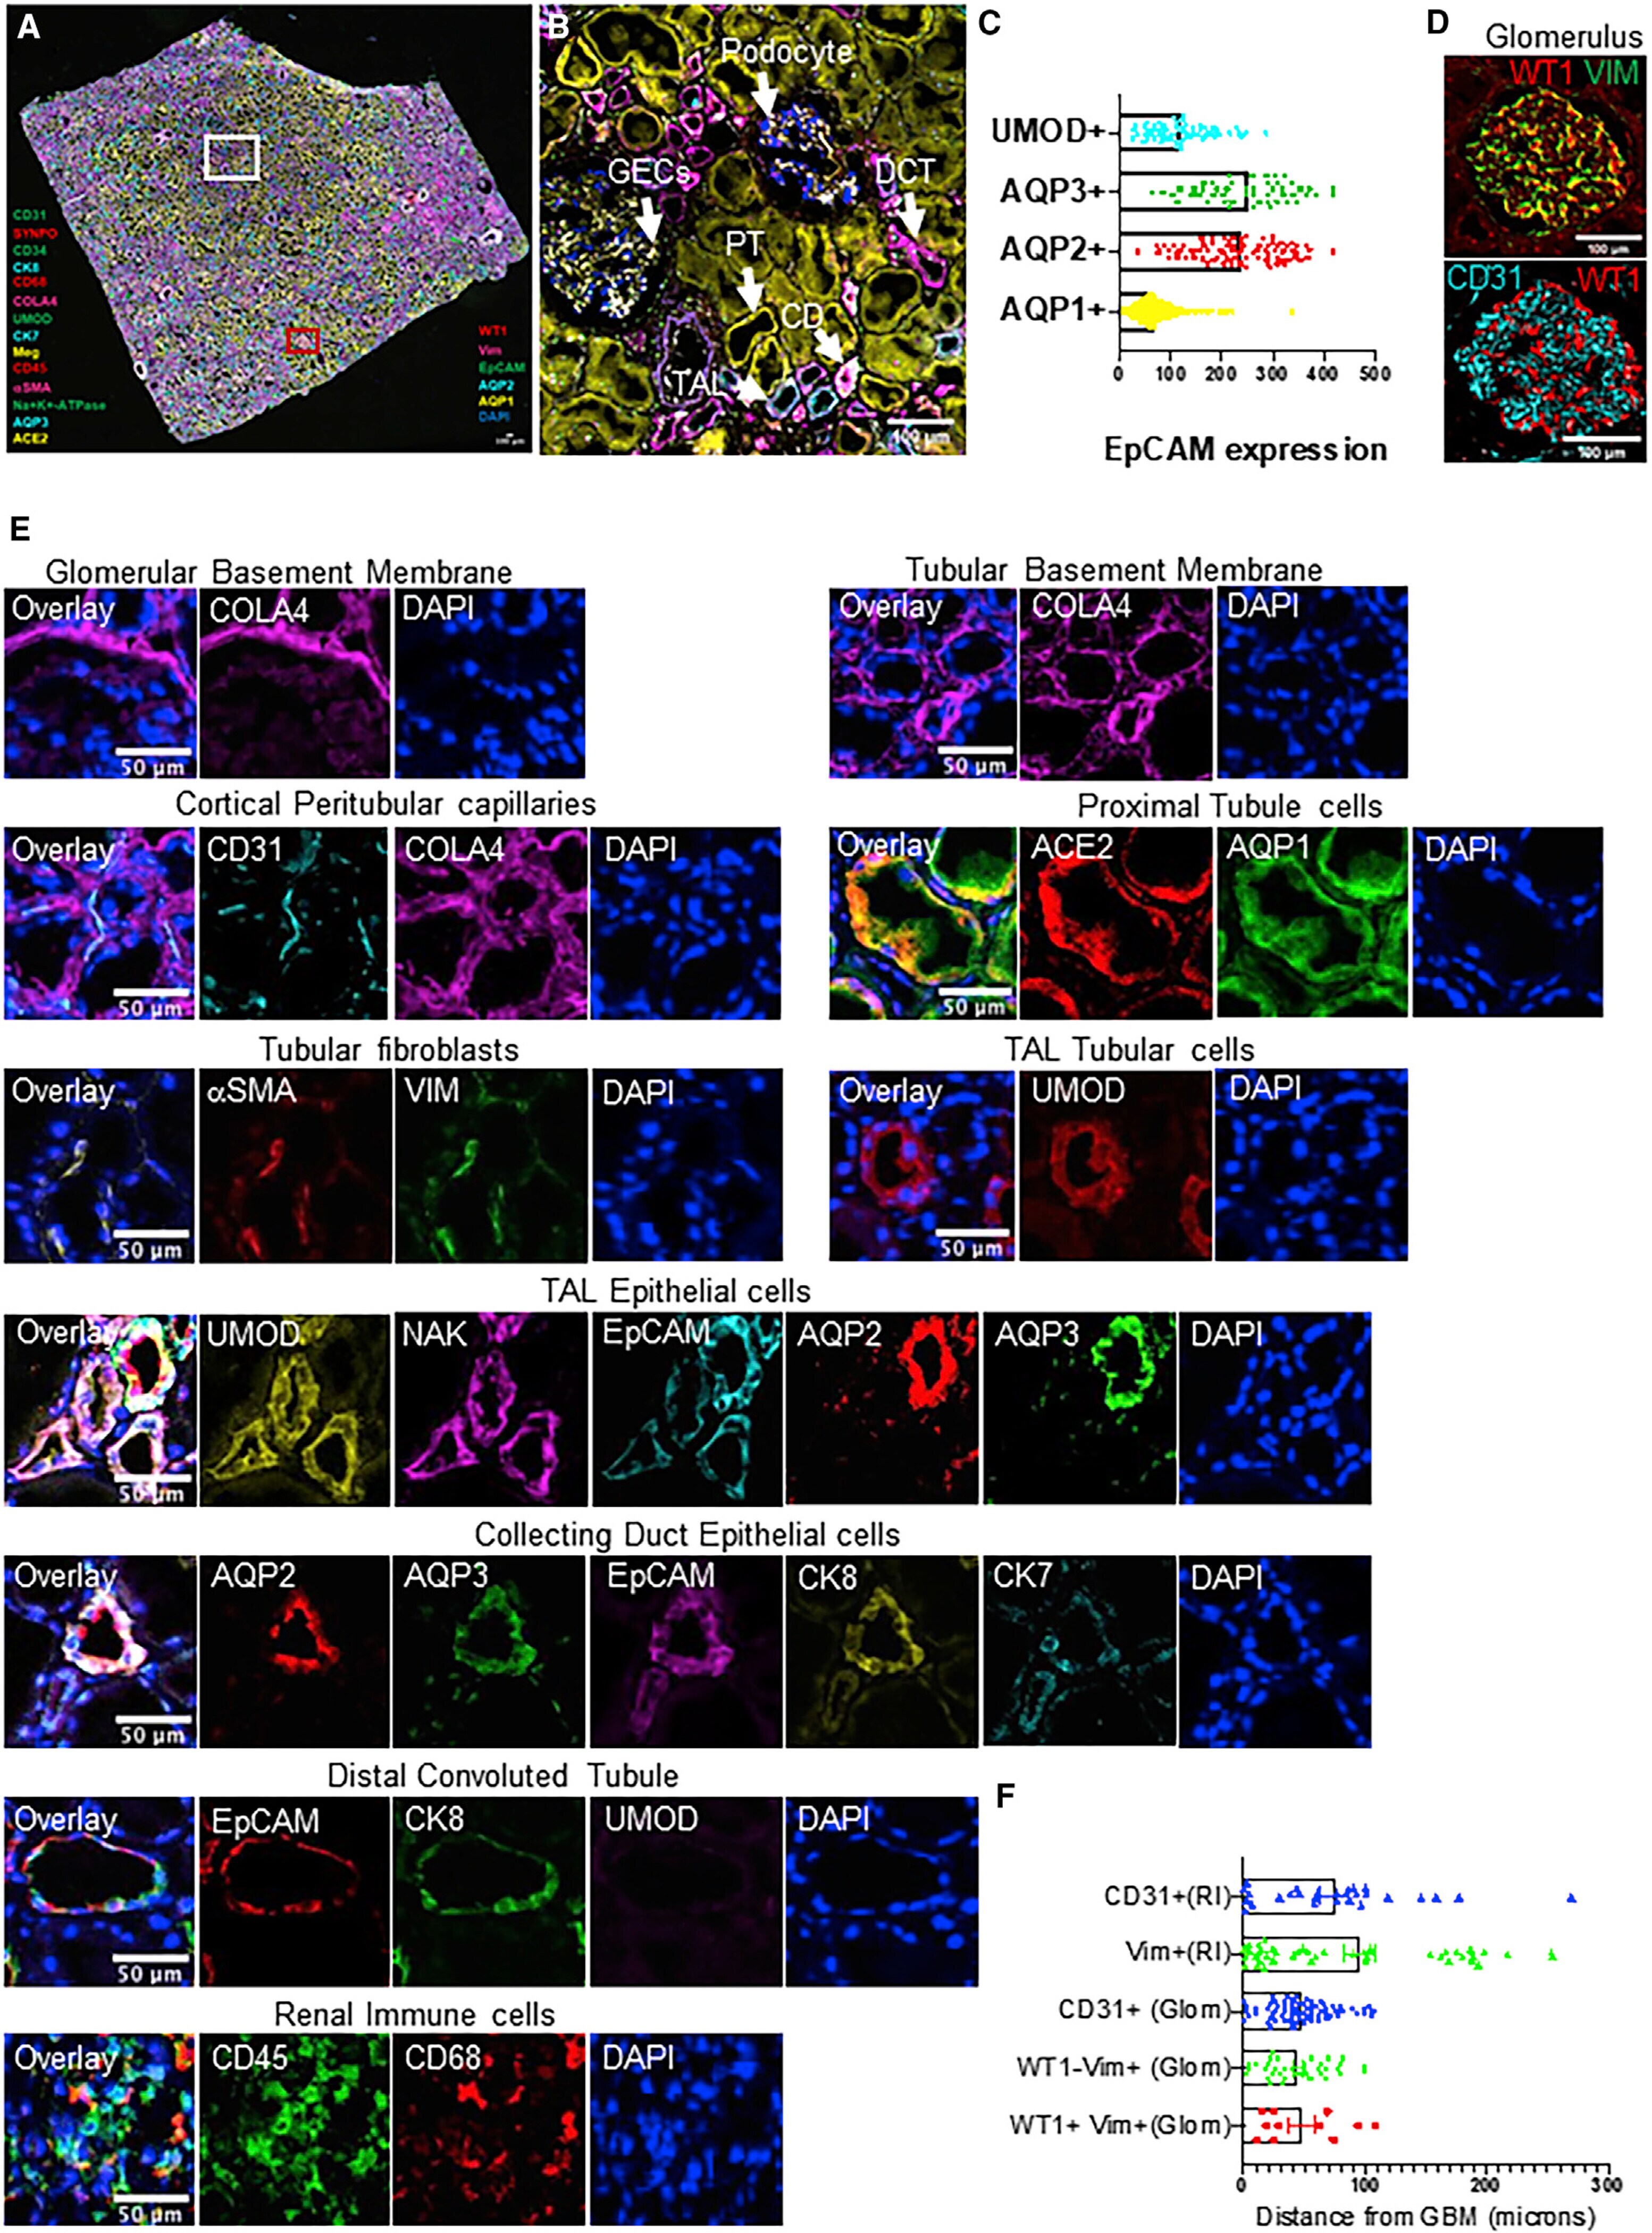
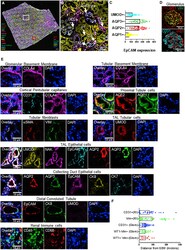
- Figure 7. SeqStain multiplex imaged panels identify major substructures in the human kidney (A) Image showing a composite overlay of aligned immunofluorescence image stack of 20 unique markers from the whole kidney tissue section. Scale bar, 100 mum. (B) Image of a zoomed-in region from the whole kidney tissue section in (A) (white square) showing various components of the kidney tissue, including the glomerular endothelial cells (GECs), proximal tubule (PT), collecting duct (CD), distal convoluted tubules (DCT), and podocytes. Scale bar, 100 mum. (C) Boxed dot plot showing computed co-expression of EpCAM and the indicated markers on a per-cell basis (mean +- SD). (D) Image of a zoomed-in region from the whole kidney tissue section in (A) (red square) showing one glomerulus (two panels), false colored for the indicated markers. Scale bar, 100 mum. (E) Representative images showing zoomed-in regions of composite overlay of aligned immunofluorescence image stacks from (A) for the identification of various immunophenotypes of cells and tissue sections based on co-localization of various markers (as labeled). Scale bar, 50 mum. (F) Boxed dot plot of cellular neighborhoods showing the computed distances of the indicated cells from glomerular basement membrane of a selected glomerulus in the kidney (mean +- SD). Glom refers to cells residing inside the glomerulus, whereas RI refers to cells residing outside the glomerulus, in the renal interstitium.
- Conjugate
- Green dye