Explore
 Validate
 Learn
Learn Western blot
Antibody data
- Antibody Data
- Antigen structure
- References [4]
- Comments [0]
- Validations
- Western blot [4]
- Immunocytochemistry [1]
- Other assay [3]
Submit
Validation data
Reference
Comment
Report error
- Product number
- 14-9938-82 - Provider product page

- Provider
- Invitrogen Antibodies
- Product name
- Cytokeratin 8 Monoclonal Antibody (LP3K), eBioscience™
- Antibody type
- Monoclonal
- Antigen
- Other
- Description
- Description: This LP3K monoclonal antibody reacts with human cytokeratin 8 (K8), a 55-kDa member of the family of intermediate filament proteins. Cytokeratin 8 is a type II (or basic) keratin that is expressed in epithelial and carcinoma cells. Cytokeratins form the intracellular cytoskeletal network that maintains the integrity and stability of cells and tissues. More specifically, studies have demonstrated the involvement of cytokeratin 8 in protection against apoptosis, stress, or injury, as well as regulation of the cell cycle. This keratin is frequently co-expressed with cytokeratin 18, a type I (or acidic) keratin as a heterodimer. Although detected primarily in the cytoplasm of normal healthy cells, cytokeratin 8 has been found to localize to the plasma membrane in some tumor cells. Finally, cytokeratin 8 is phosphorylated on serine 73 in dividing cells. Applications Reported: This LP3K antibody has been reported for use in immunoblotting (WB) and immunocytochemistry. Applications Tested: This LP3K antibody has been tested by western blot analysis of reduced A549 cell lysate, as well as by immunocytochemistry of A549 cells. For western blotting, this antibody can be used at 1-10 µg/mL. For immunocytochemistry, LP3K can be used at 1 µg/mL. It is recommended that the antibody be carefully titrated for optimal performance in the assay of interest. Purity: Greater than 90%, as determined by SDS-PAGE. Aggregation: Less than 10%, as determined by HPLC. Filtration: 0.2 µm post-manufacturing filtered.
- Reactivity
- Human
- Host
- Mouse
- Isotype
- IgG
- Antibody clone number
- LP3K
- Vial size
- 100 µg
- Concentration
- 0.5 mg/mL
- Storage
- 4° C
Submitted references SeqStain is an efficient method for multiplexed, spatialomic profiling of human and murine tissues.
The human keratins: biology and pathology.
Cytokeratin 8 associates with the external leaflet of plasma membranes in tumour cells.
Conformational changes in the rod domain of human keratin 8 following heterotypic association with keratin 18 and its implication for filament stability.
Rajagopalan A, Venkatesh I, Aslam R, Kirchenbuechler D, Khanna S, Cimbaluk D, Kordower JH, Gupta V
Cell reports methods 2021 Jun 21;1(2)
Cell reports methods 2021 Jun 21;1(2)
The human keratins: biology and pathology.
Moll R, Divo M, Langbein L
Histochemistry and cell biology 2008 Jun;129(6):705-33
Histochemistry and cell biology 2008 Jun;129(6):705-33
Cytokeratin 8 associates with the external leaflet of plasma membranes in tumour cells.
Gires O, Andratschke M, Schmitt B, Mack B, Schaffrik M
Biochemical and biophysical research communications 2005 Mar 25;328(4):1154-62
Biochemical and biophysical research communications 2005 Mar 25;328(4):1154-62
Conformational changes in the rod domain of human keratin 8 following heterotypic association with keratin 18 and its implication for filament stability.
Waseem A, Karsten U, Leigh IM, Purkis P, Waseem NH, Lane EB
Biochemistry 2004 Feb 10;43(5):1283-95
Biochemistry 2004 Feb 10;43(5):1283-95
No comments: Submit comment
Supportive validation
- Submitted by
- Invitrogen Antibodies (provider)
- Main image
- Experimental details
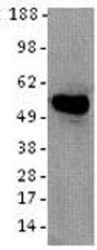
- Immunoblotting of reduced A549 cell lysate with 5 µg/mL of Anti-Human Cytokeratin 8 Purified. Bands were visualized using Anti-Mouse IgG HRP.
- Submitted by
- Invitrogen Antibodies (provider)
- Main image

- Experimental details
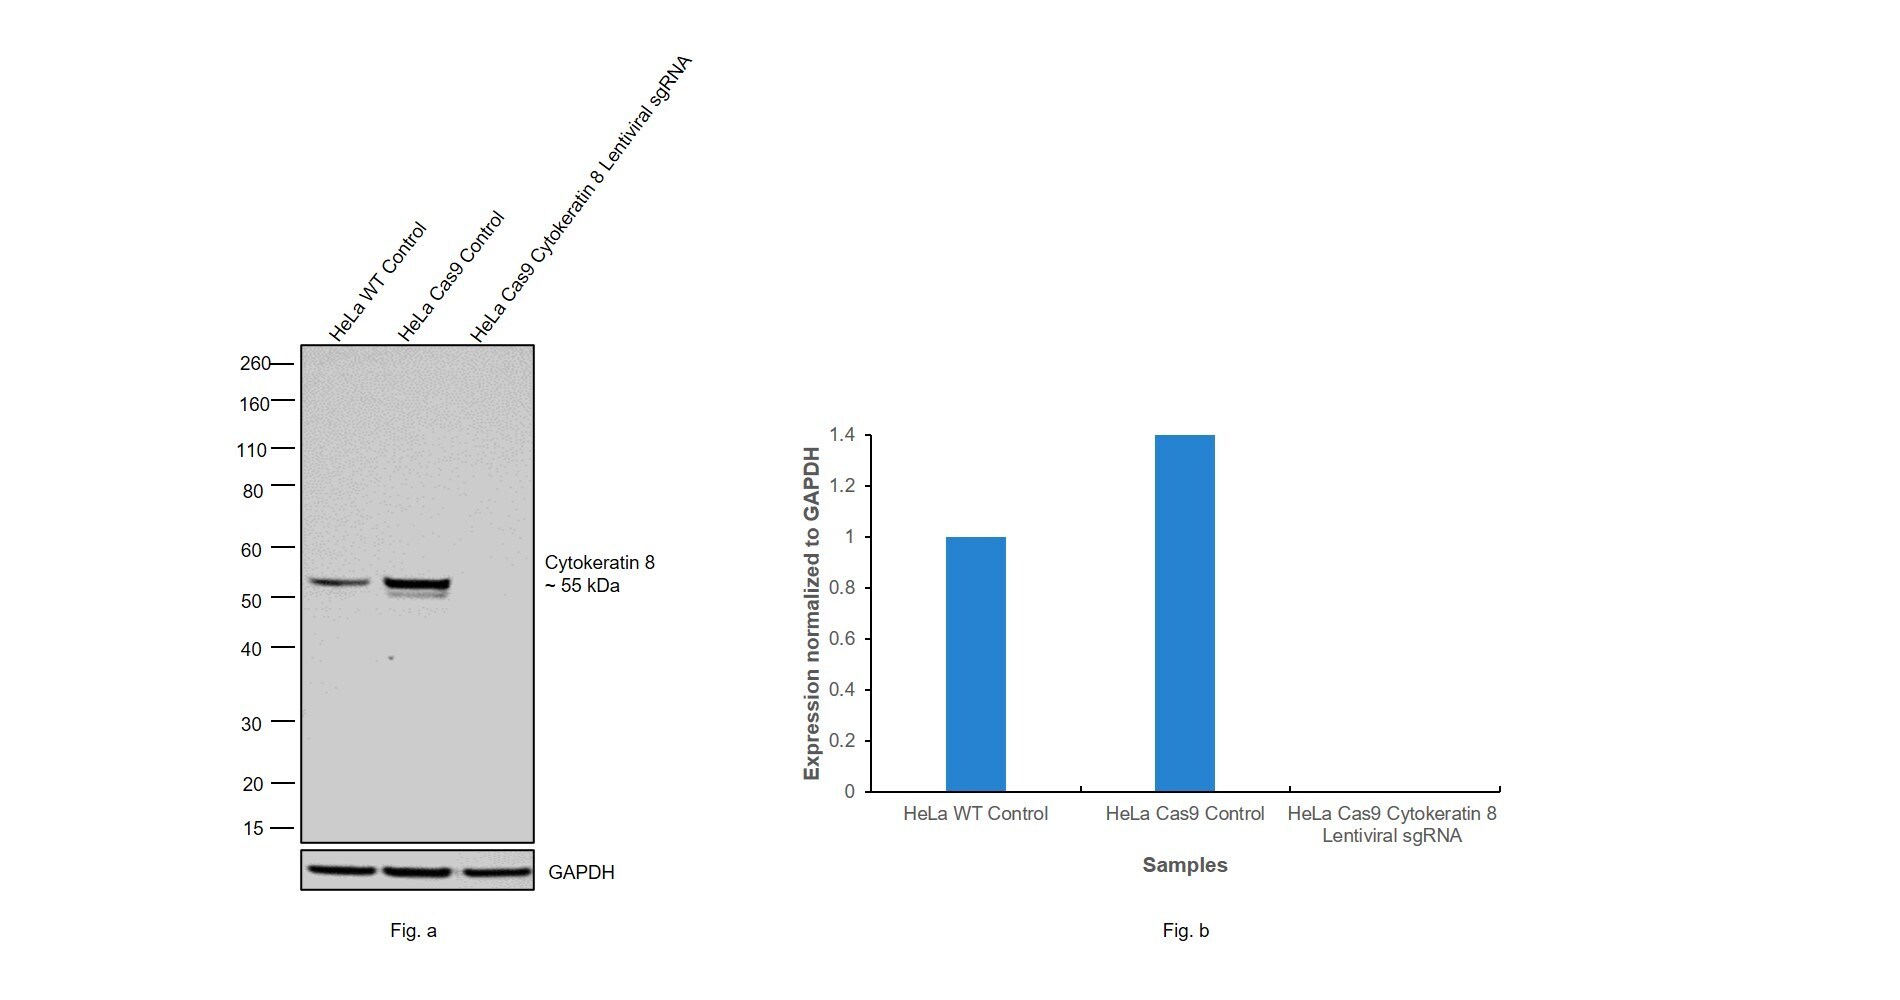
- CRISPR-Cas9 mediated genome editing ofCytokeratin 8 (as confirmed by next generation sequencing) was achieved by using LentiArray™ Lentiviral sgRNA (Product # A32042, AssayID CRISPR745510_LV) and LentiArray Cas9 Lentivirus (Product # A32064). Fig (a) Western blot analysis of Cytokeratin 8 was performed by loading 30 µg of HeLa Wild Type (Lane 1), HeLa Cas9 (Lane 2) and HeLa Cas9 cells transduced with Cytokeratin 8 Lentiviral sgRNA (Lane 3) whole cell extracts. The samples were electrophoresed using NuPAGE™ Novex™ 4-12% Bis-Tris Protein Gel (Product # NP0322BOX). Resolved proteins were then transferred onto a nitrocellulose membrane (Product # IB23001) by iBlot® 2 Dry Blotting System (Product # IB21001). The blot was probed with Anti-Cytokeratin 8 Monoclonal Antibody (LP3K), eBioscience™ (Product # 14-9938-82) using 1 µg/mL dilution and Goat anti-Mouse IgG (H+L) Superclonal™ Recombinant Secondary Antibody, HRP (Product # A28177 1:5,000 dilution).Chemiluminescent detection was performed using Novex® ECL Chemiluminescent Substrate Reagent Kit (Product # WP20005). A loss of signal in sgRNA transduced cells using the LentiArray™ CRISPR product line confirms that antibody is specific toCytokeratin 8 (Fig (b)).
- Submitted by
- Invitrogen Antibodies (provider)
- Main image
- Experimental details
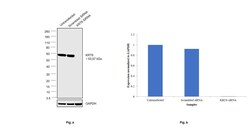
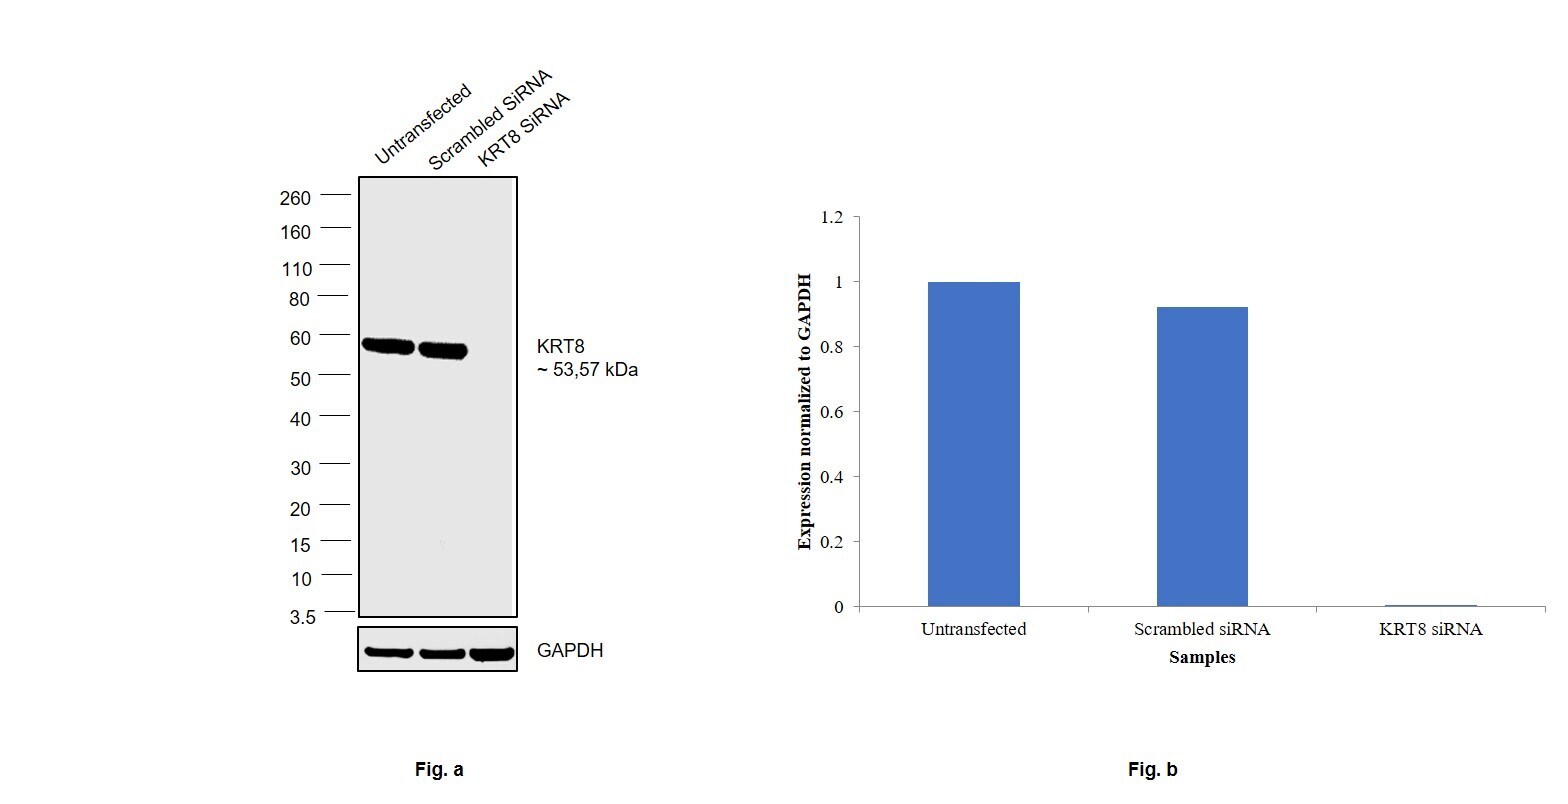
- Knockdown of Cytokeratin 8 was achieved by transfecting Caco-2 with Cytokeratin 8 specific siRNAs (Silencer® select Product # S7969, S7970). Western blot analysis (Fig. a) was performed using Whole cell extracts from the Cytokeratin 8 knockdown cells (lane 3), non-targeting scrambled siRNA transfected cells (lane 2) and untransfected cells (lane 1). The blot was probed with Cytokeratin 8 Monoclonal Antibody (LP3K), eBioscience™ (Product # 14-9938-82, at a concentration of 1 µg/mL) and Goat anti-Mouse IgG (H+L) Superclonal™ Recombinant Secondary Antibody, HRP (Product # A28177, 1:4000 dilution). Densitometric analysis of this western blot is shown in histogram (Fig. b). Decrease in signal upon siRNA mediated knock down confirms that antibody is specific to Cytokeratin 8.
- Submitted by
- Invitrogen Antibodies (provider)
- Main image
- Experimental details
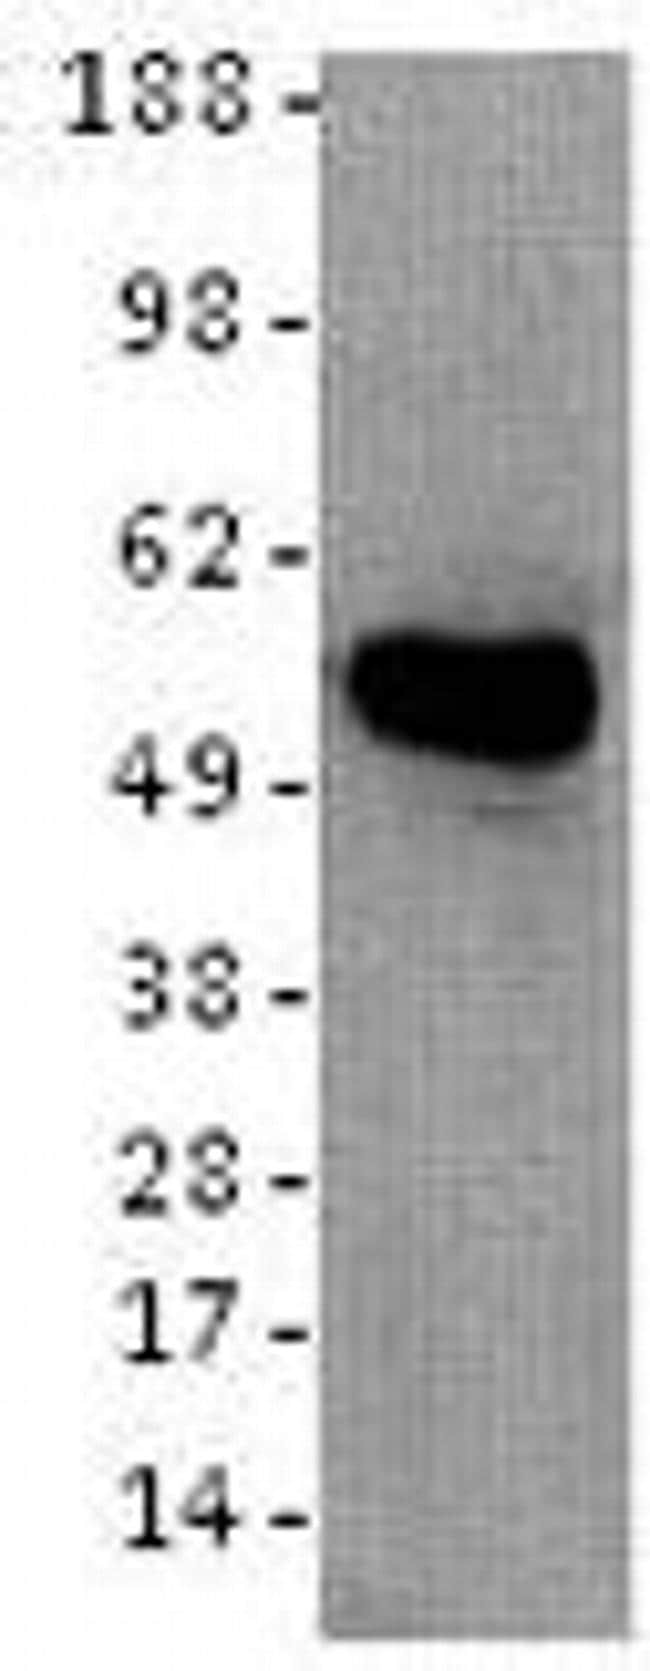
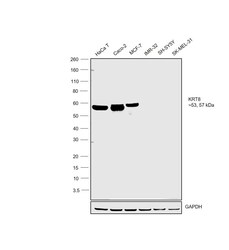
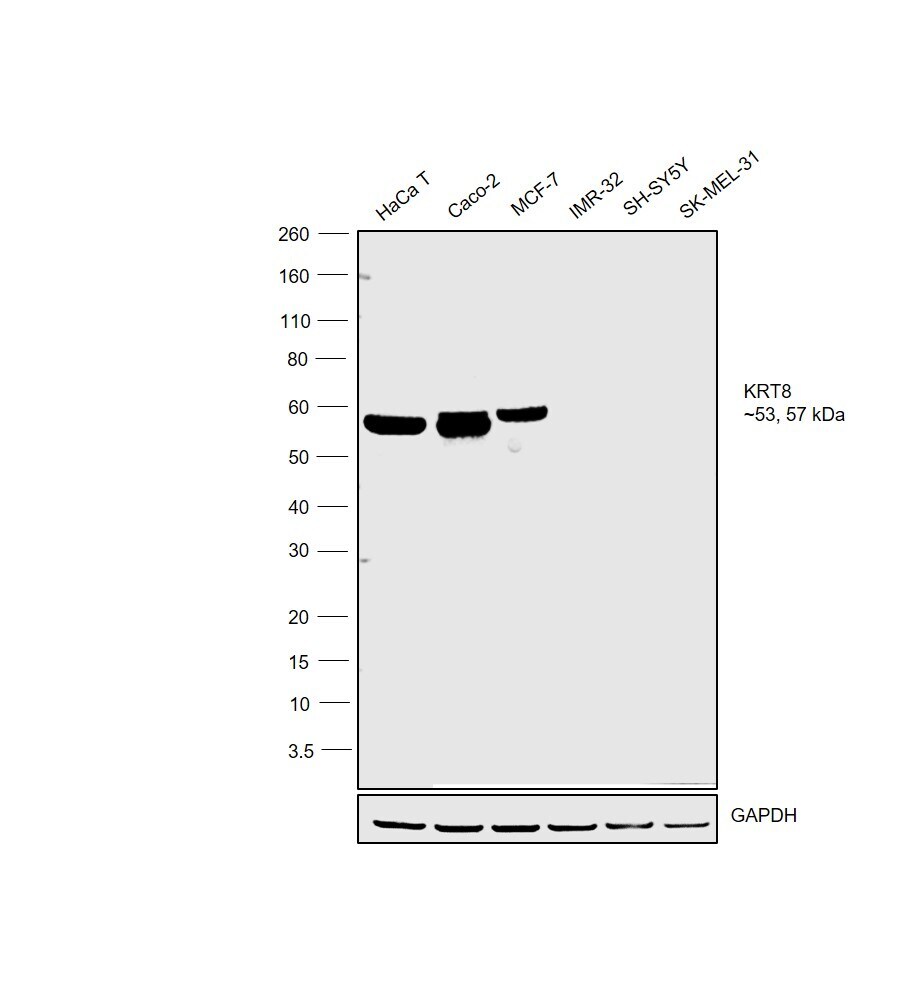
- Western blot was performed using Anti-Cytokeratin 8 Monoclonal Antibody (LP3K), eBioscience™(Product # 14-9938-82) and 53 & 57 kDa bands corresponding to Cytokeratin 8 was observed across the cell lines except IMR-32, SH-SY5Y and SK-MEL-31. Whole cell extracts (30 µg lysate) of HaCaT (Lane 1), Caco-2 (Lane 2), MCF-7 (Lane 3), IMR-32 (Lane 4), SH-SY5Y (Lane 5) and SK-MEL-31 (Lane 6) were electrophoresed using NuPAGE™ 4-12% Bis-Tris Protein Gel (Product # NP0321BOX). Resolved proteins were then transferred onto a Nitrocellulose membrane (Product # LC2001) by iBlot® 2 Dry Blotting System (Product # IB21001). The blot was probed with the primary antibody at a concentration of 1 µg/mL and detected by chemiluminescence with Goat anti-Mouse IgG (H+L) Superclonal™ Recombinant Secondary Antibody, HRP (Product # A28177,1:4000 dilution using the iBright FL 1000 (Product # A32752). Chemiluminescent detection was performed using Novex® ECL Chemiluminescent Substrate Reagent Kit (Product # WP20005).
Supportive validation
- Submitted by
- Invitrogen Antibodies (provider)
- Main image
- Experimental details
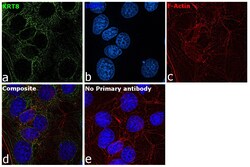
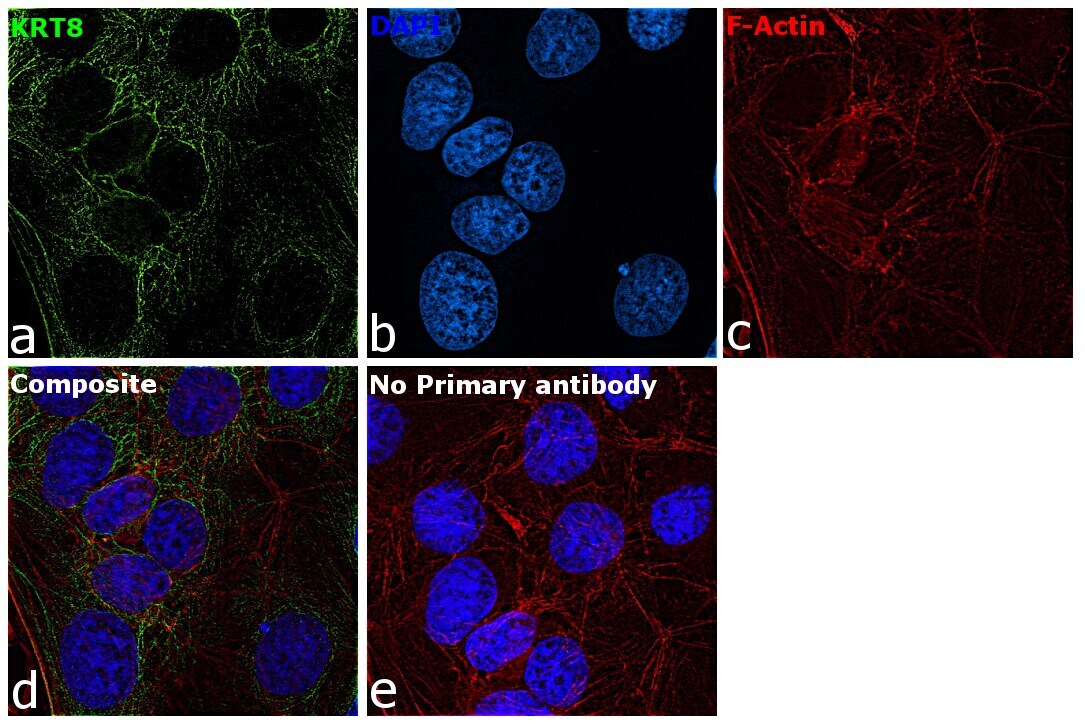
- Immunofluorescence analysis of Cytokeratin 8 was performed using 70% confluent log phase Caco-2 cells. The cells were fixed with ice-cold acetone at 4°C for 5 minutes, and blocked with 2% BSA for 45 minutes at room temperature. The cells were labeled with Cytokeratin 8 Monoclonal Antibody (LP3K), eBioscience™ (Product # 14-9938-82) at a concentration of 1 µg/mL in 0.1% BSA, incubated at 4 degree celsius overnight and then labeled with Goat anti-Mouse IgG (H+L) Superclonal™ Recombinant Secondary Antibody, Alexa Fluor® 488 conjugate (Product # A28175), (1:2000 dilution), for 45 minutes at room temperature (Panel a: Green). Nuclei (Panel b:Blue) were stained with ProLong™ Diamond Antifade Mountant with DAPI (Product # P36962). F-actin (Panel c: Red) was stained with Rhodamine Phalloidin (Product # R415, 1:300 dilution). Panel d represents the merged image showing cytoskeletal localization. Panel e represents control cells with no primary antibody to assess background. The images were captured at 60X magnification.
Supportive validation
- Submitted by
- Invitrogen Antibodies (provider)
- Main image
- Experimental details
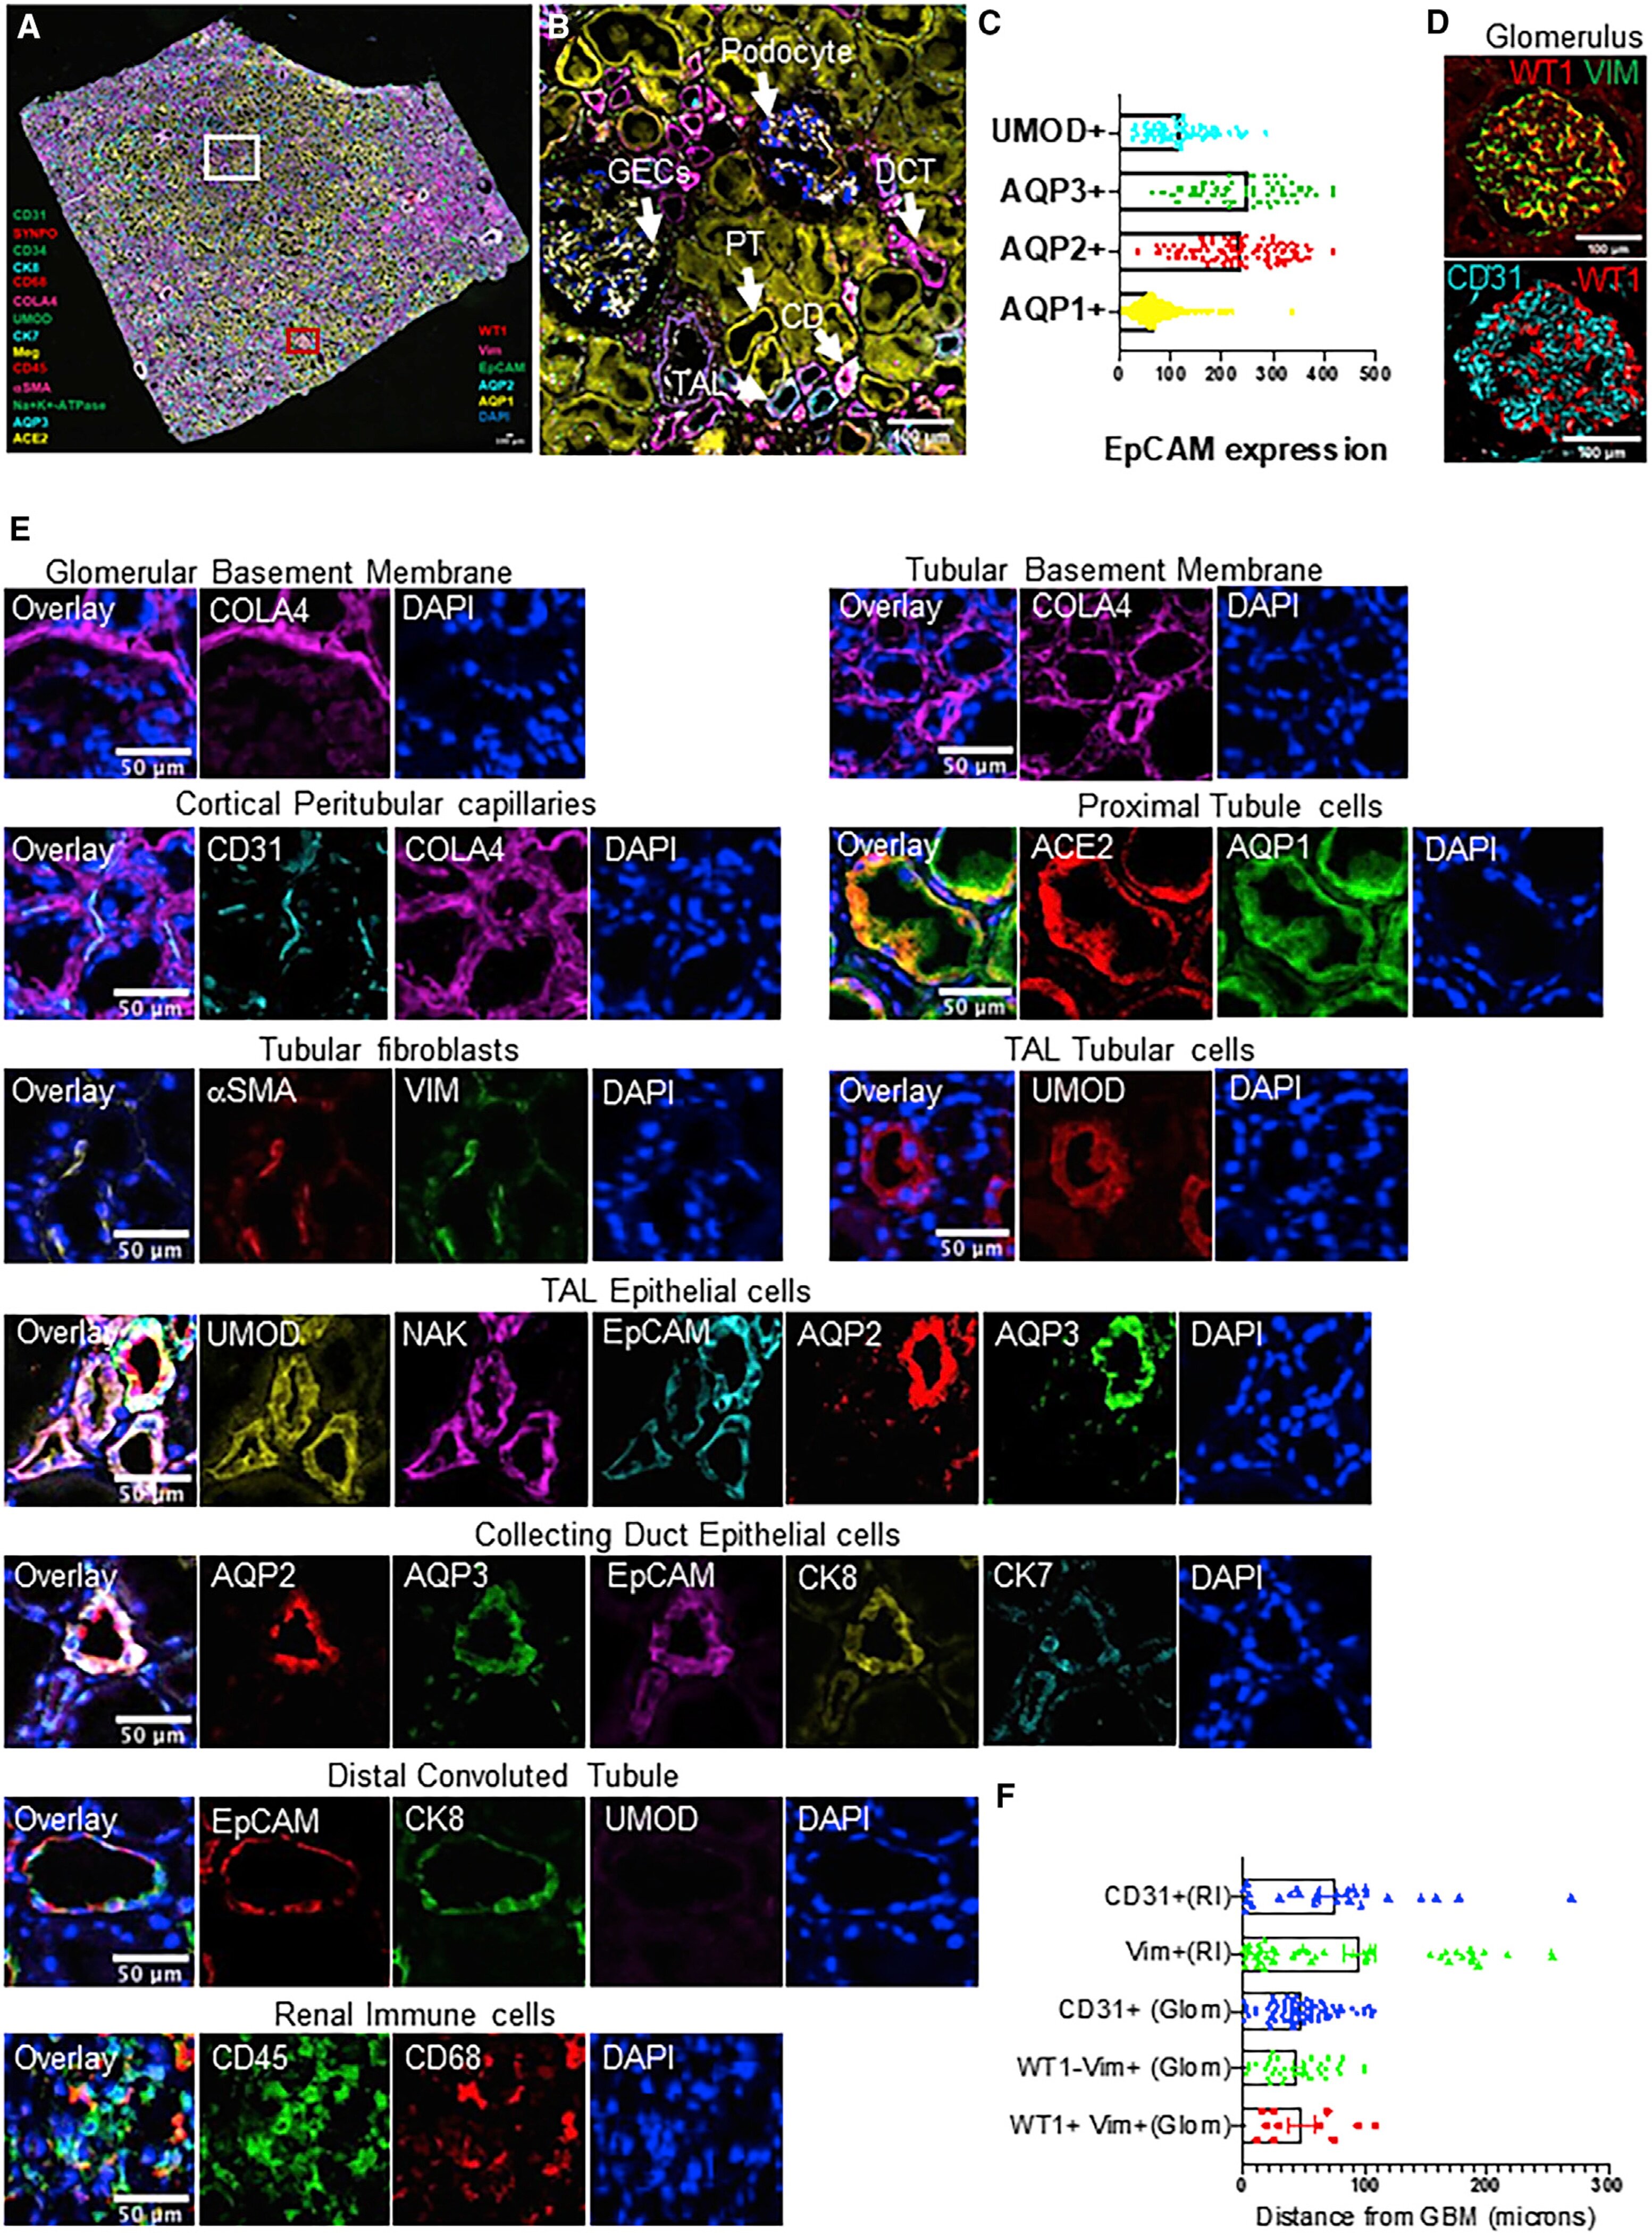
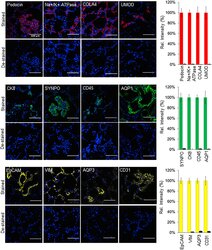
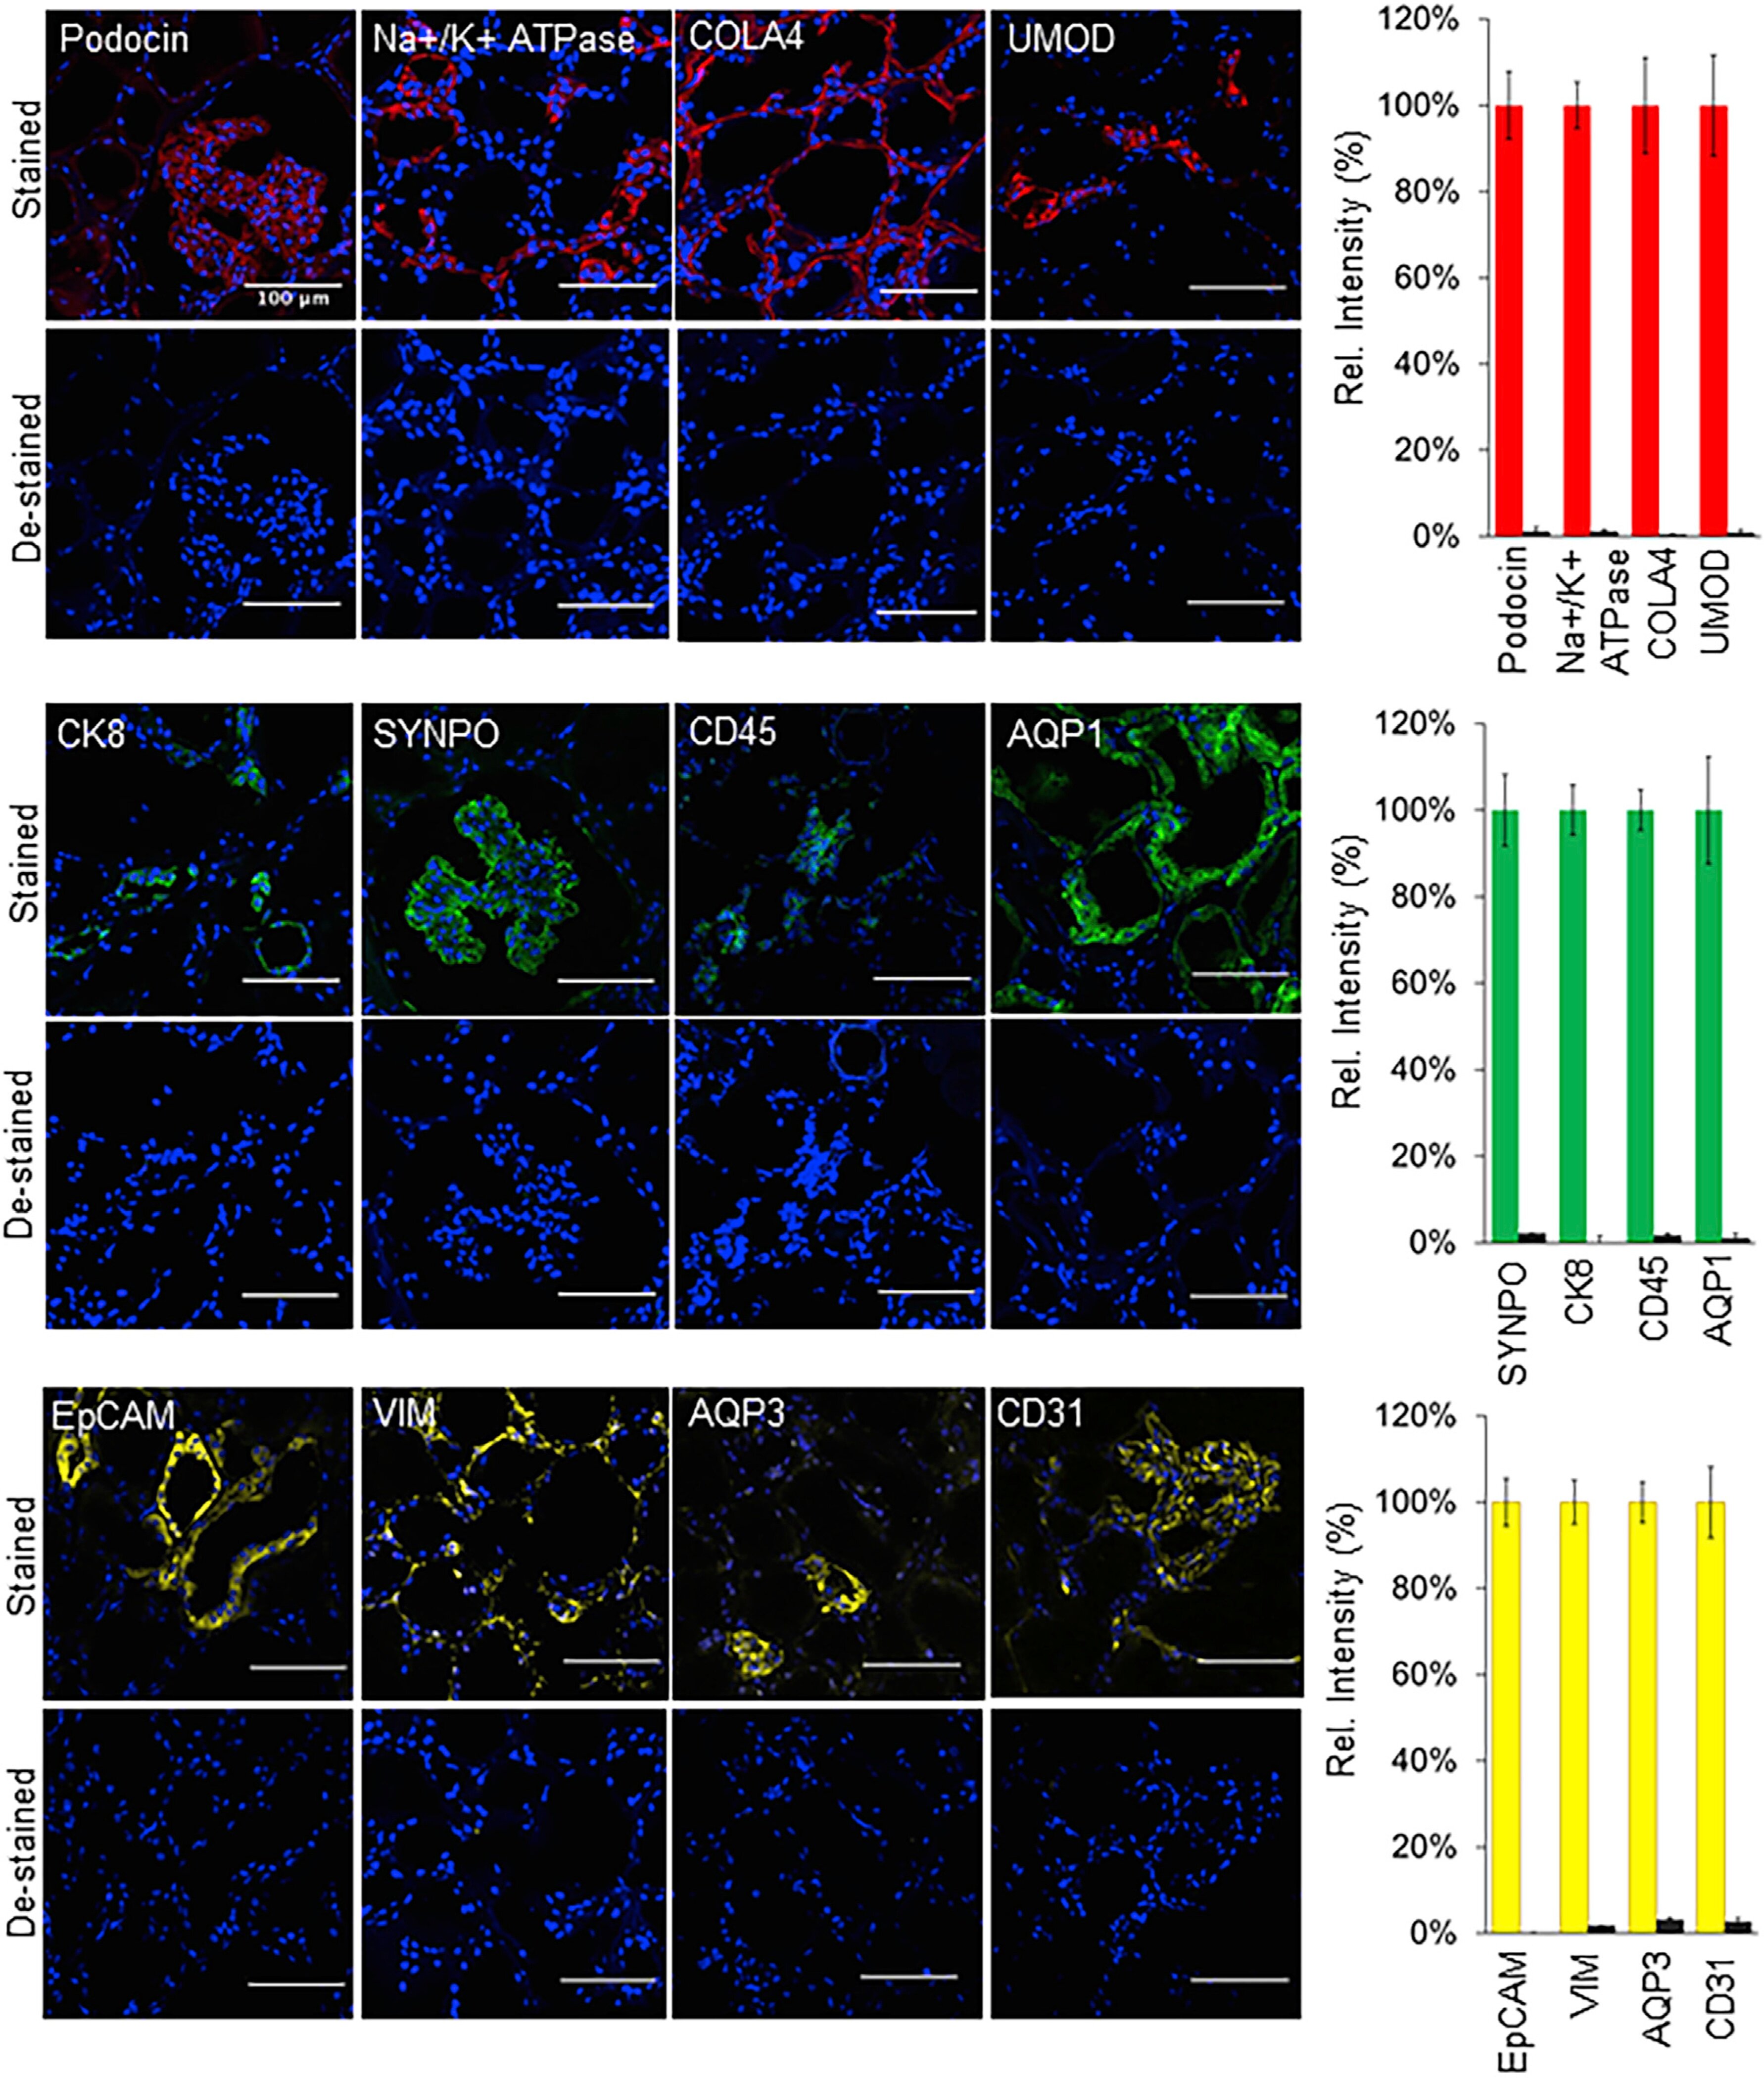
- Figure 3. Enzymatic de-staining of tissues stained using the SeqStain antibodies Immunofluorescence images showing human kidney tissue sections stained using SeqStain antibodies (as indicated in the panel). The antibodies were labeled using either the AF488 fluorophore (shown in green), the Cy3 fluorophore (shown in red), or the Cy5 fluorophore (shown in yellow). Immunofluorescence images of these tissue sections after de-staining with DNase I treatment are shown below each panel. All images are representative of at least three replicates. Graphs showing quantification of fluorescence intensity after staining (red bars, green bars, or yellow bars) and de-staining (brown bars) in each panel is also presented on the right. Graphs show the mean +- SD. Scale bar, 100 mum.
- Submitted by
- Invitrogen Antibodies (provider)
- Main image
- Experimental details
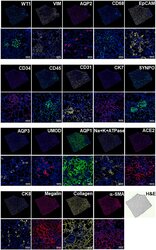
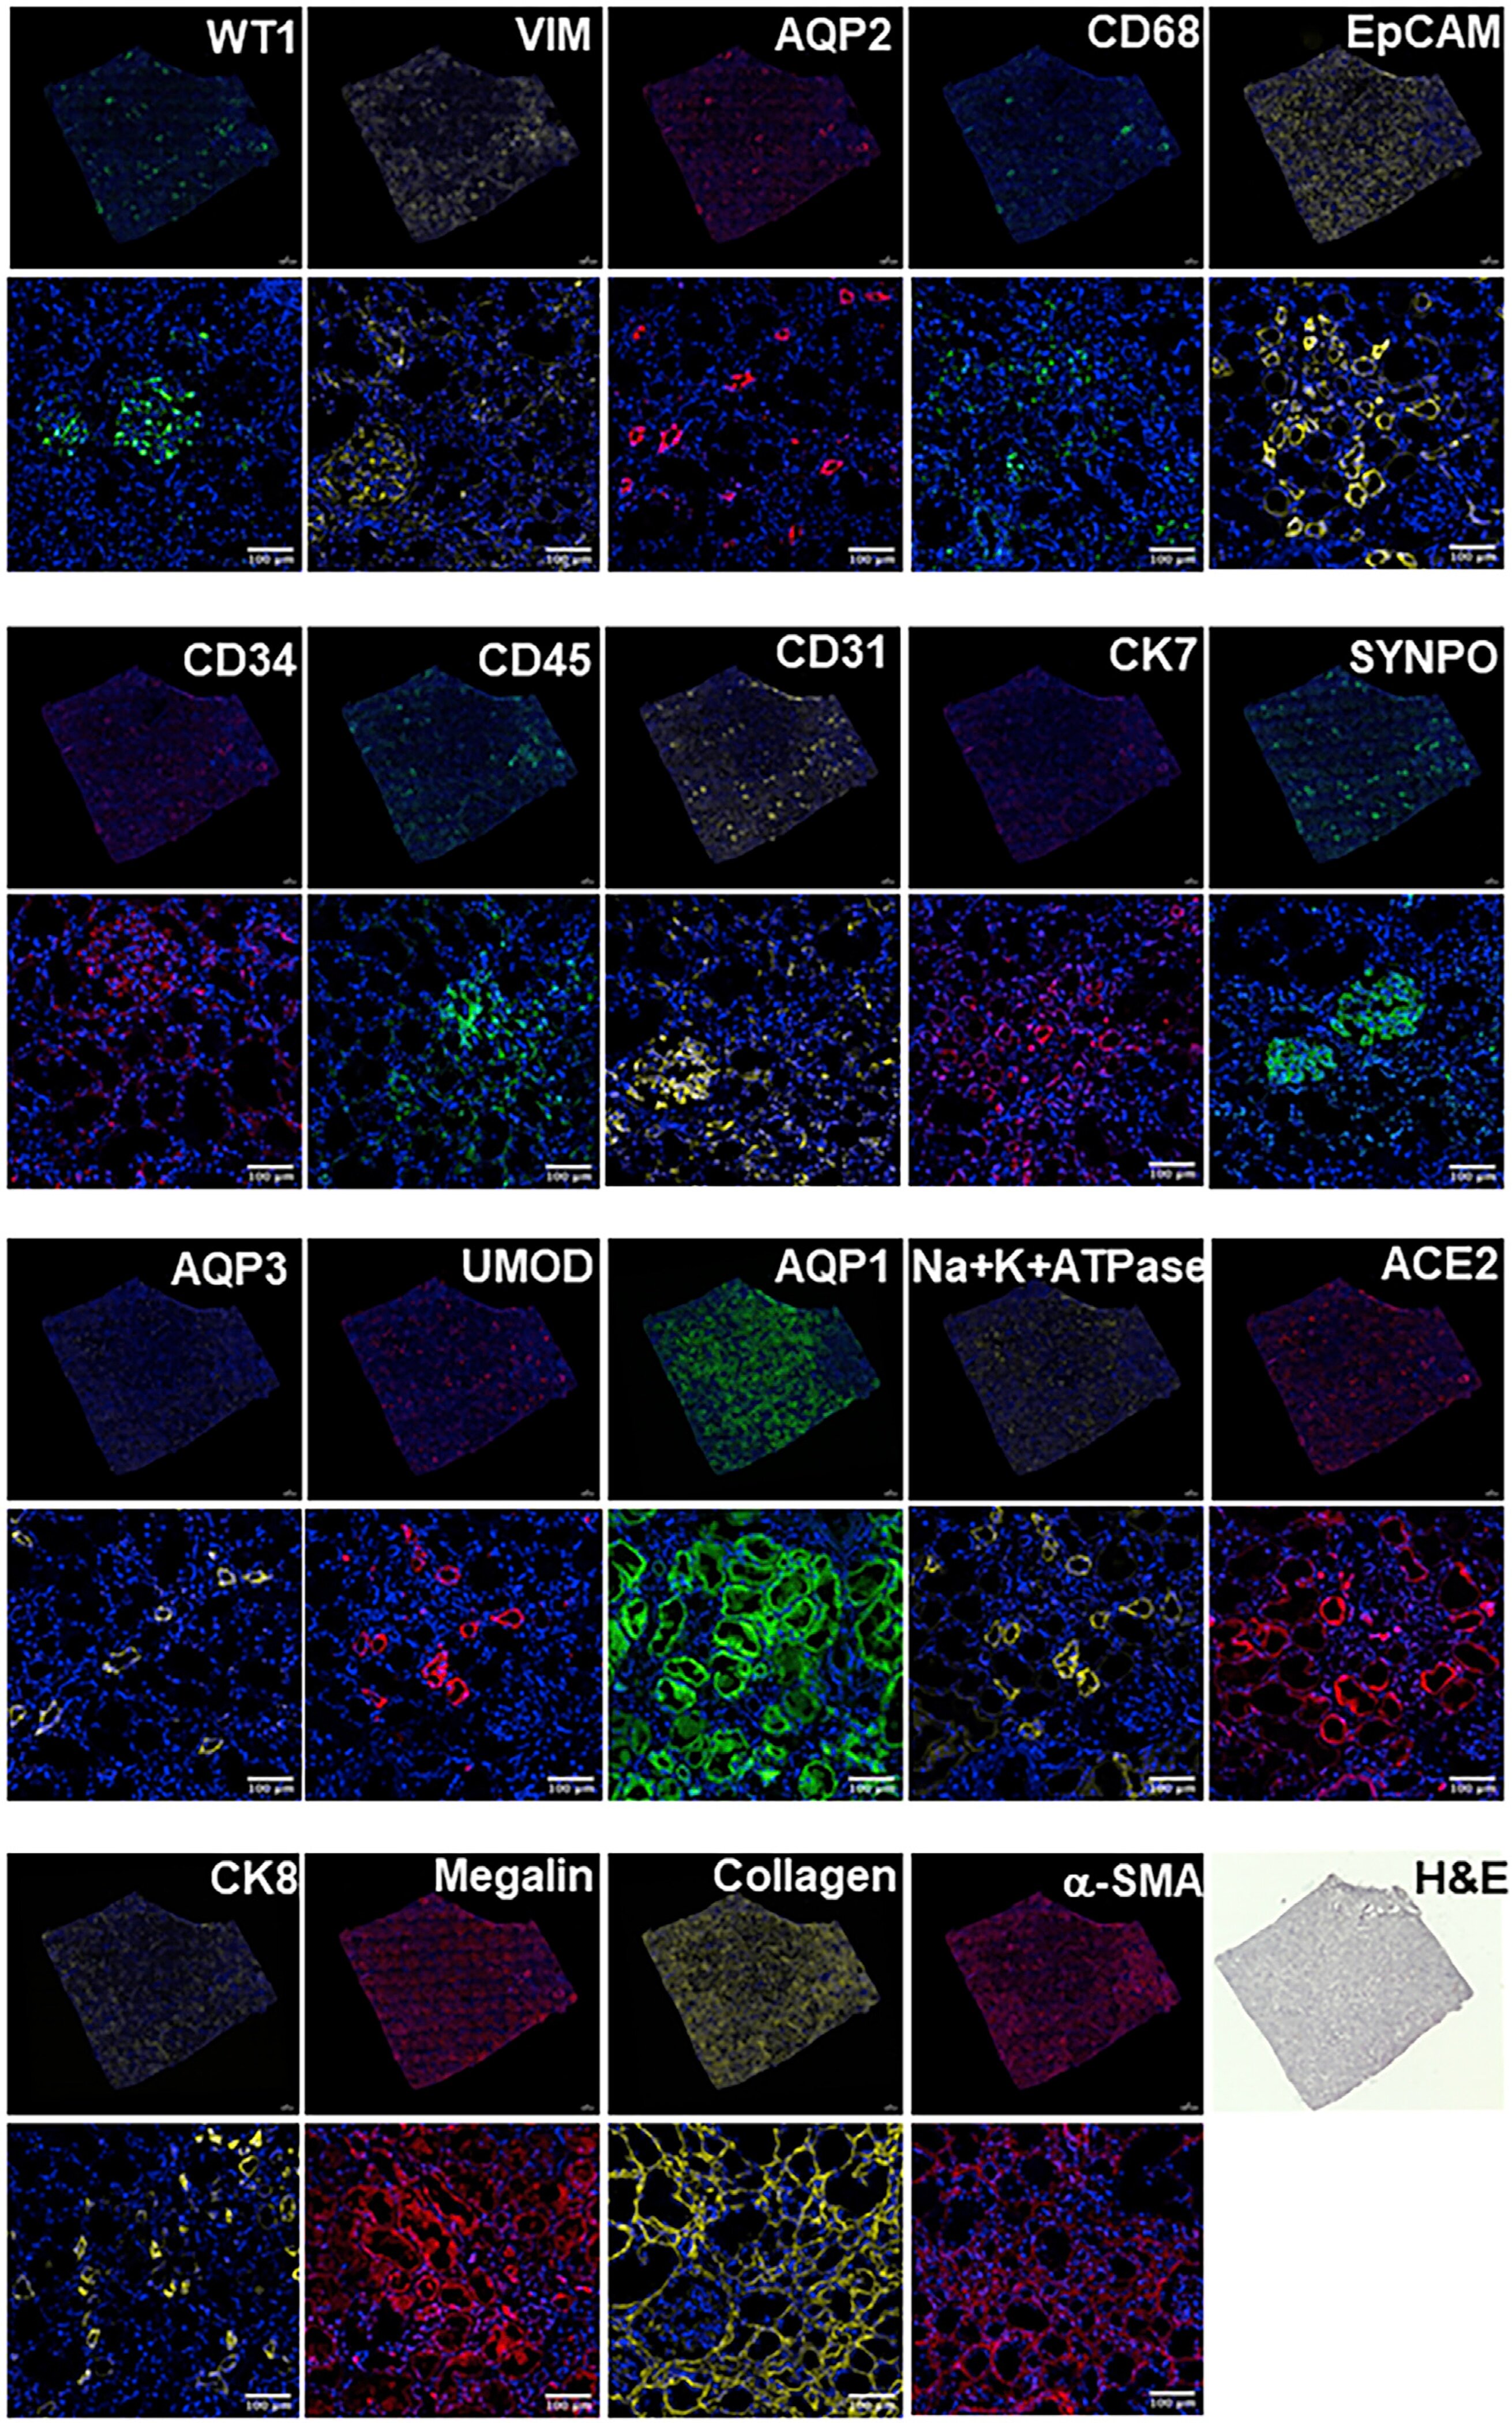
- Figure 6. SeqStain-based multiplex imaging of whole human kidney tissue provides a 20-plex image Immunofluorescent images of whole kidney tissue sections after each round of staining with unique SeqStain antibodies (as indicated) and DAPI (as indicated in the panel). Zoomed-in sections of images are presented below each panel. A serial section stained with H&E is also presented. Scale bars, 100 mum.
- Submitted by
- Invitrogen Antibodies (provider)
- Main image

- Experimental details
- Figure 7. SeqStain multiplex imaged panels identify major substructures in the human kidney (A) Image showing a composite overlay of aligned immunofluorescence image stack of 20 unique markers from the whole kidney tissue section. Scale bar, 100 mum. (B) Image of a zoomed-in region from the whole kidney tissue section in (A) (white square) showing various components of the kidney tissue, including the glomerular endothelial cells (GECs), proximal tubule (PT), collecting duct (CD), distal convoluted tubules (DCT), and podocytes. Scale bar, 100 mum. (C) Boxed dot plot showing computed co-expression of EpCAM and the indicated markers on a per-cell basis (mean +- SD). (D) Image of a zoomed-in region from the whole kidney tissue section in (A) (red square) showing one glomerulus (two panels), false colored for the indicated markers. Scale bar, 100 mum. (E) Representative images showing zoomed-in regions of composite overlay of aligned immunofluorescence image stacks from (A) for the identification of various immunophenotypes of cells and tissue sections based on co-localization of various markers (as labeled). Scale bar, 50 mum. (F) Boxed dot plot of cellular neighborhoods showing the computed distances of the indicated cells from glomerular basement membrane of a selected glomerulus in the kidney (mean +- SD). Glom refers to cells residing inside the glomerulus, whereas RI refers to cells residing outside the glomerulus, in the renal interstitium.