Explore
 Validate
 Learn
Learn Western blot
 Flow cytometry
Antibody data
- Antibody Data
- Antigen structure
- References [2]
- Comments [0]
- Validations
- Western blot [1]
- Immunocytochemistry [1]
- Other assay [6]
Submit
Validation data
Reference
Comment
Report error
- Product number
- MA5-25555 - Provider product page

- Provider
- Invitrogen Antibodies
- Product name
- NEU2 Monoclonal Antibody (OTI4F4)
- Antibody type
- Monoclonal
- Antigen
- Recombinant full-length protein
- Reactivity
- Human
- Host
- Mouse
- Isotype
- IgG
- Antibody clone number
- OTI4F4
- Vial size
- 100 μL
- Concentration
- 1 mg/mL
- Storage
- -20°C, Avoid Freeze/Thaw Cycles
Submitted references Desialylation of Atg5 by sialidase (Neu2) enhances autophagosome formation to induce anchorage-dependent cell death in ovarian cancer cells.
Desialylation of Sonic-Hedgehog by Neu2 Inhibits Its Association with Patched1 Reducing Stemness-Like Properties in Pancreatic Cancer Sphere-forming Cells.
Satyavarapu EM, Nath S, Mandal C
Cell death discovery 2021 Feb 1;7(1):26
Cell death discovery 2021 Feb 1;7(1):26
Desialylation of Sonic-Hedgehog by Neu2 Inhibits Its Association with Patched1 Reducing Stemness-Like Properties in Pancreatic Cancer Sphere-forming Cells.
Nath S, Mondal S, Butti R, Prasanna Gunasekaran V, Chatterjee U, Halder A, Kundu GC, Mandal C
Cells 2020 Jun 21;9(6)
Cells 2020 Jun 21;9(6)
No comments: Submit comment
Supportive validation
- Submitted by
- Invitrogen Antibodies (provider)
- Main image
- Experimental details
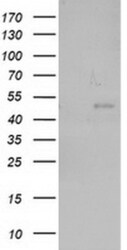
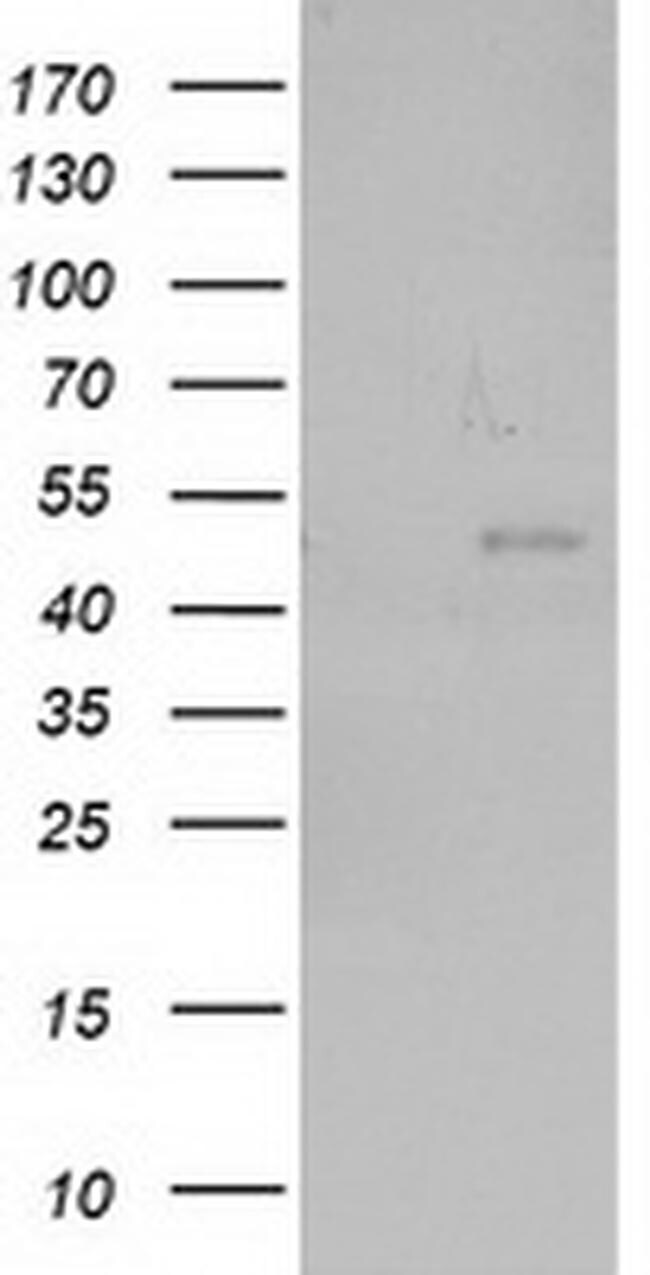
- Western blot analysis of NEU2 in HEK293T cells in untransfected (Left lane) and transfected (Right lane) samples using 5 µg per lane. The samples were separated by SDS-PAGE and probed with NEU2 (Product # MA5-25555) monoclonal antibody.
Supportive validation
- Submitted by
- Invitrogen Antibodies (provider)
- Main image

- Experimental details
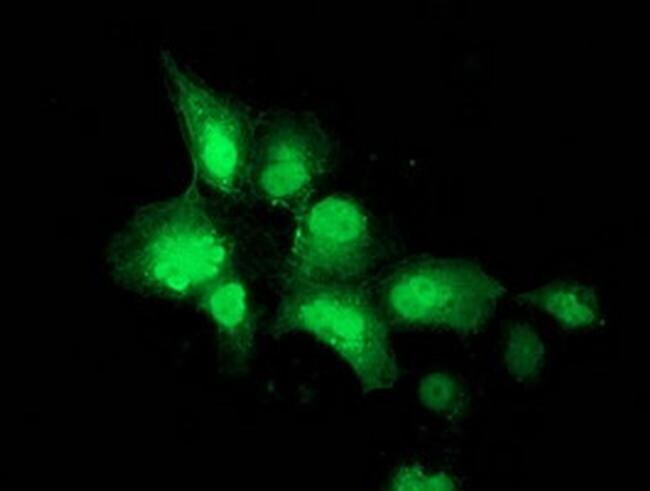
- Immunofluorescent analysis of NEU2 in COS7 cells. Cells were transfected with a plasmid overexpressing NEU2 and probed with a NEU2 monoclonal antibody (Product # MA5-25555).
Supportive validation
- Submitted by
- Invitrogen Antibodies (provider)
- Main image
- Experimental details
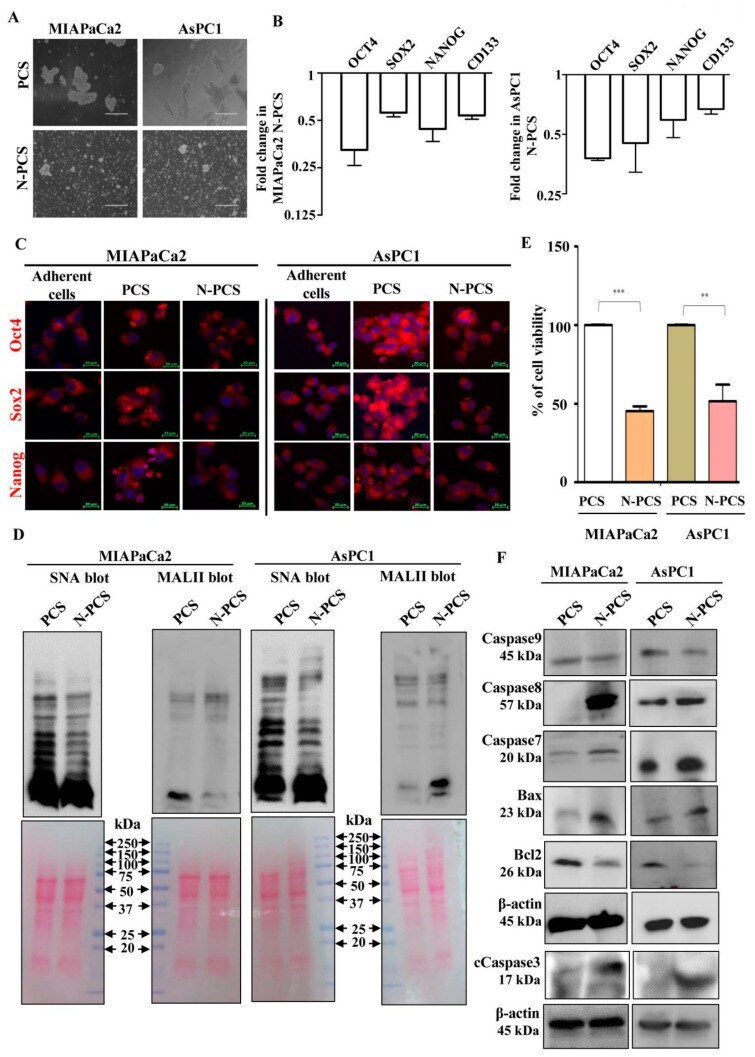
- Figure 3 Neu2-overexpressed pancreatic cancer sphere-forming cells (N-PCS) exhibited reduced sialylation and stemness-like property. ( A ) Phase-contrast images showed reduced sphere formation of N-PCS compared to PCS generated from both MIAPaCa2 and AsPC1 cells. ( B ) Bar graph of qPCR data showed decreased expression of pluripotent stem cell markers (OCT4, SOX2, NANOG) and CD133 in N-PCS than PCS from both MIAPaCa2 and AsPC1 cells. ( C ) Confocal microscopy images showed enhanced expression of Oct4, Sox2 and Nanog in PCS compared to adherent cancer cells. Those expressions were again reduced in N-PCS. ( D ) Representative blots exhibited reduced SNA and MALII binding with N-PCS compared to PCS. Cell lysates were prepared and electrophoretically separated using 10% polyacrylamide gel and further processed for Western blotting. Ponceau S stained blots were used as loading control. ( E ) Cell viability assay showed reduced viability upon Neu2 overexpression in PCS. Error bars represent the mean (+-) SD; p -values (** p < 0.01; *** p < 0.001) calculated using Two-tailed Student's t -test. ( F ) Western blot analysis illustrated higher expression of pro-caspase proteins such as Caspase 7, 8, cleaved caspase 3 and Bax along with reduced expression of Bcl2 in N-PCS. No change of expression level was found in Caspase 9. beta-actin served as a loading control.
- Submitted by
- Invitrogen Antibodies (provider)
- Main image

- Experimental details
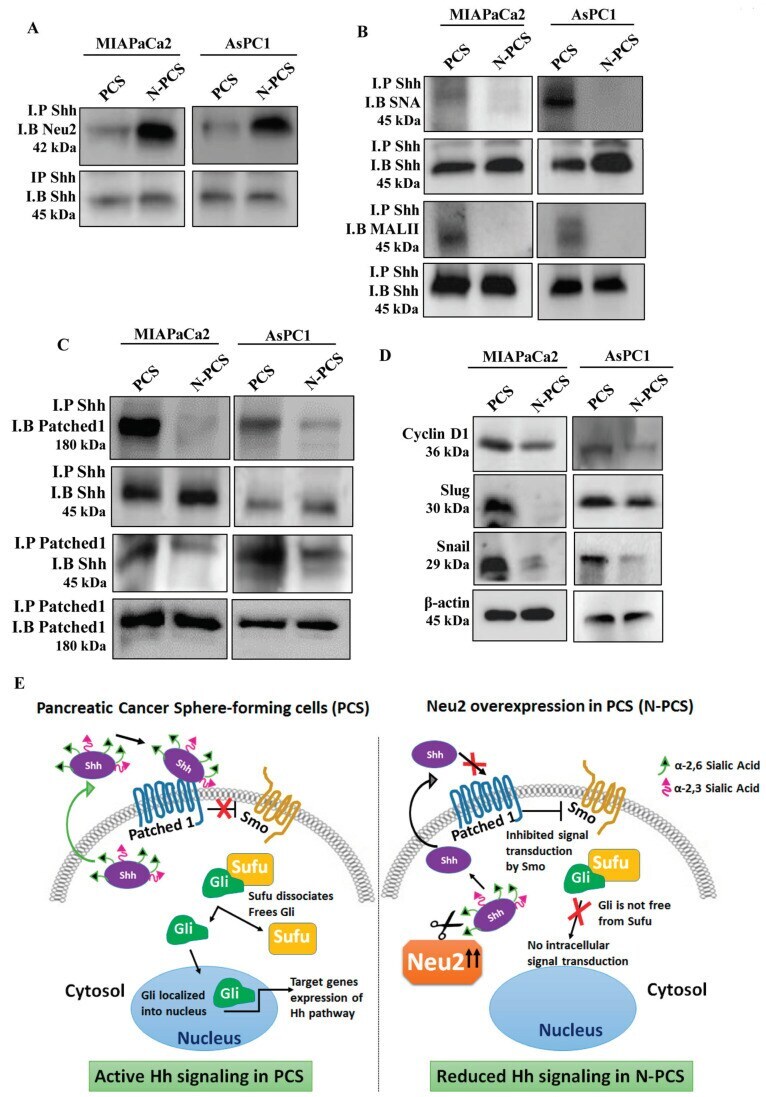
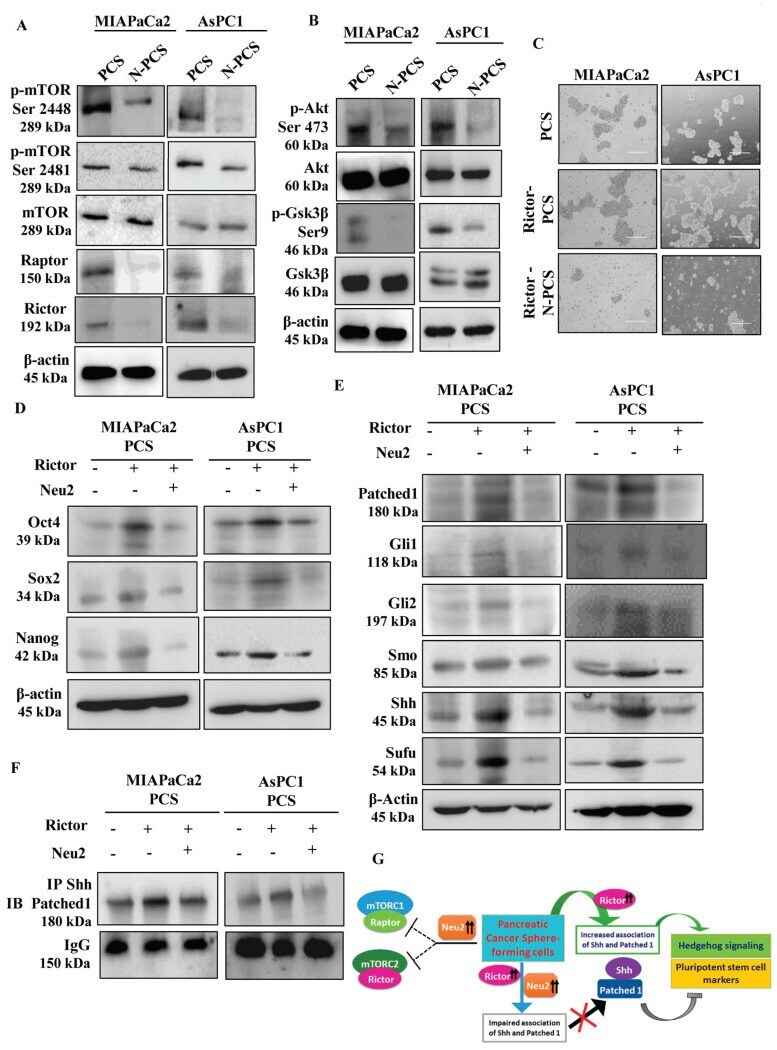
- Figure 5 Impaired association of Shh with Patched1 due to desialylation of Shh by overexpressed Neu2. ( A , B ) Co-immunoprecipitation of Neu2 and Shh showed higher association in N-PCS than PCS. Cell lysate (200 mug) was incubated with the anti-Shh antibody (1:100) overnight at 4 degC. Immuno-complexes were incubated with protein A-Sepharose 4B for 3 h, resolved by SDS-PAGE, and subsequently identified using the anti-Neu2 antibodies ( A ). The immunocomplexes were also identified using the SNA and MALII, respectively, to illustrate reduced alpha2,6- and alpha2,3-linked sialylation of Shh in N-PCS ( B ). Immunoblots with anti-Shh antibody served as a loading control. ( C ) Co-immunoprecipitation showed decreased association of Patched1 and Shh in N-PCS. This was performed as described in materials and methods. Immunocomplex was identified using the anti-Patched1 and anti-Shh antibodies. Immunoblots of Shh and Patched1 served as loading controls, respectively. ( D ) Representative Western blots showed reduced expression of Hedgehog pathway target proteins such as Cyclin D1, Slug and Snail in N-PCS. beta-actin was used as a loading control. ( E ) Schematic diagram highlighting reduced association of Shh with Patched1 in N-PCS due to removal of sialic acids on Shh by overexpressed-Neu2. As a result, the Hedgehog signaling cascade is downregulated by inhibiting Smo and reducing the expression of Sufu and Gli proteins.
- Submitted by
- Invitrogen Antibodies (provider)
- Main image
- Experimental details
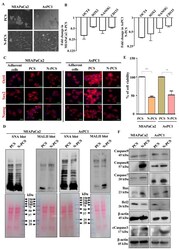
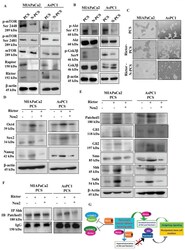
- Figure 6 Neu2 overexpression modulates mTORC1/2 activity leading to further downregulation of Hh signaling in N-PCS. ( A ) Representative immunoblots exhibited reduced mTORC1/2 formation and decreased expression of Raptor and Rictor in N-PCS from both MIAPaCa2 and AsPC1 cells. beta-actin used as a loading control. ( B ) Western blot analysis demonstrated reduced inhibitory phosphorylation of Gsk3 beta at Ser 9 and decreased phosphorylation of Akt at Ser 473 in N-PCS from both the cell lines. beta-actin used as a loading control. ( C ) Phase-contrast images illustrated higher sphere generation upon Rictor overexpression in PCS. Co-overexpression of Rictor and Neu2 in PCS exhibited reduction of sphere formation. ( D , E ) Representative immunoblots showed enhanced expression of Oct4, Sox2 and Nanog at protein level in Rictor-overexpressed PCS whereas reduced expression of these molecules was observed when both Rictor and Neu2 were co-overexpressed in PCS. beta-actin used as a loading control ( D ). Similarly, increased expression of Hedgehog pathway proteins was observed in Rictor-overexpressed PCS which were reversed in Rictor and Neu2 co-overexpressed conditions. beta-actin used as a loading control ( E ). ( F ) Co-immunoprecipitation of Patched1 and Shh exhibited enhanced association upon Rictor overexpression in PCS. Co-overexpression of Rictor and Neu2 in PCS exhibited reduction of association of Patched1 and Shh. Immunoblots of IgG served as a loading control. ( G ) Schem
- Submitted by
- Invitrogen Antibodies (provider)
- Main image

- Experimental details
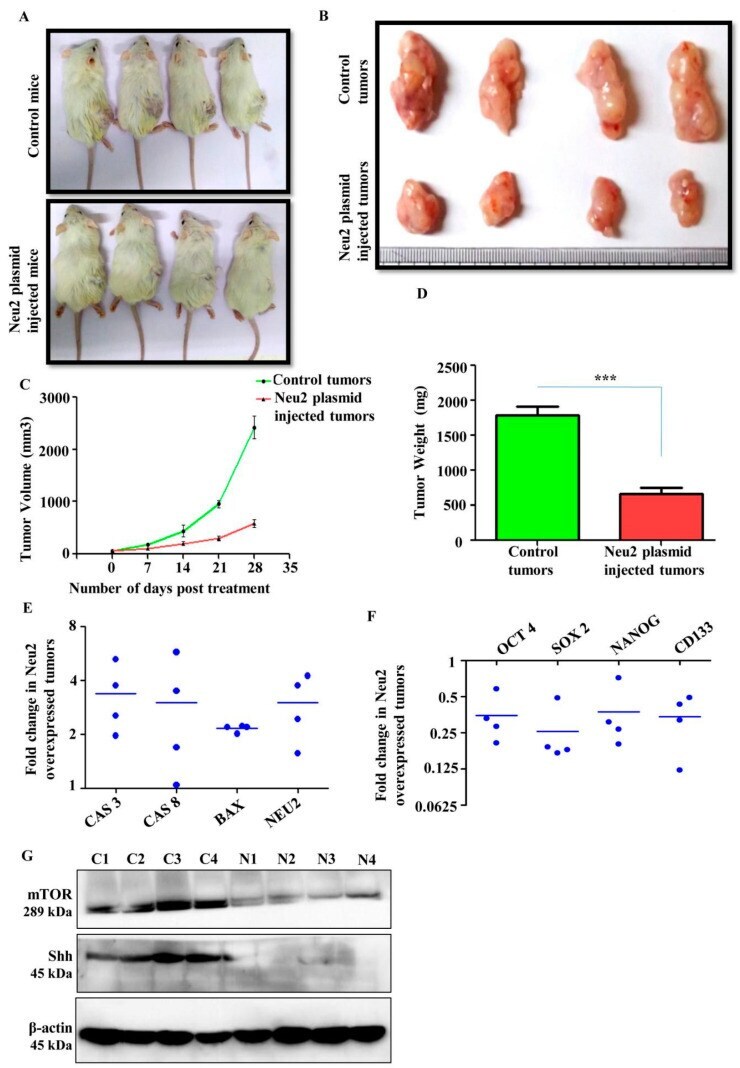
- Figure 7 Neu2 overexpression reduced tumor growth in NOD/SCID mice. ( A - D ) MIAPaCa-2 (1 x 10 7 ) cells were injected subcutaneously into the dorsal side of the right flanks of male NOD/SCID mice to develop tumors. Mice were either injected with vehicle control or 1.5 mg/kg body wt. Neu2-plasmid in admixture with Lipofectamine 2000 (1:2) twice a week for 3 weeks intratumorally. Pictures of tumor-bearing mice ( A ), extracted tumors ( B ), reduced tumor volumes ( C ) and reduced tumor weight were observed in Neu2-plasmid injected mice ( D ). Error bars represent the mean (+-)SD; p -value (*** p < 0.001) calculated using Two-tailed Student's t -test. ( E , F ) Tumor tissues were homogenized and single-cell suspensions were made, and subsequently total RNA was extracted using Trizol. Neu2 overexpression was confirmed at genetic level. qPCR analysis showed upregulation of pro-apoptotic genes such as CAS 3, CAS 8 and BAX in Neu2-overexpressed tumors ( E ). qPCR data showed downregulation of pancreatic cancer stem cell specific markers such as OCT4, SOX2, NANOG and CD133 in Neu2-plasmid-injected tumor samples ( F ). ( G ) Tumor tissues were homogenized and whole cell lysates were made. Representative immunoblots illustrated decreased levels of Shh and mTOR in Neu2-plasmid-injected tumor samples. beta-actin used as a loading control.
- Submitted by
- Invitrogen Antibodies (provider)
- Main image
- Experimental details
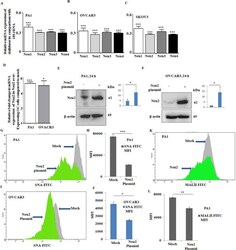
- Fig. 1 Overexpressed Neu2 demonstrated preferential specificity toward alpha2,6-linked sialic acids on OC cells. A - C Genetic expression levels of Neu1, Neu2, Neu3, and Neu4 in PA1 ( A ), OVCAR3 ( B ), and SKOV3 ( C ) ovarian cancer cell lines by real-time PCR analysis. Relative mRNA expression was expressed in comparison to 18S rRNA. D Relative fold change in the Neu2 mRNA level in PA1 and OVCAR3 after overexpression with Neu2 plasmid (24 h) compared to mock cells was analyzed by real-time PCR analysis. E , F Western blot analysis was performed to confirm the enhanced Neu2 protein levels in transfected PA1 ( E ) and OVCAR3 ( F ) cells compared to mock using an anti-Neu2 antibody. beta-Actin was used as a loading control. G - J FACS analysis showing that Neu2 overexpression decreased the FITC-SNA binding in PA1 ( G ) and OVCAR3 ( I ) compared to mock cells. Bar graphs represent the MFI values of FITC-SNA-stained mock and Neu2-overexpressed PA1 ( H ) and OVCAR3 ( J ) cells. K , L Binding of FITC-MALII with mock and Neu2-overexpressed PA1 ( K ) by flow cytometry. The MFI values are compared by plotting a bar graph ( L ). The results are represented as mean +- SD from independent experiments and p values (* p < 0.05; ** p < 0.01; *** p < 0.001; two-tailed t test) represented the significant differences between the means of the two test groups.

- Submitted by
- Invitrogen Antibodies (provider)
- Main image

- Experimental details
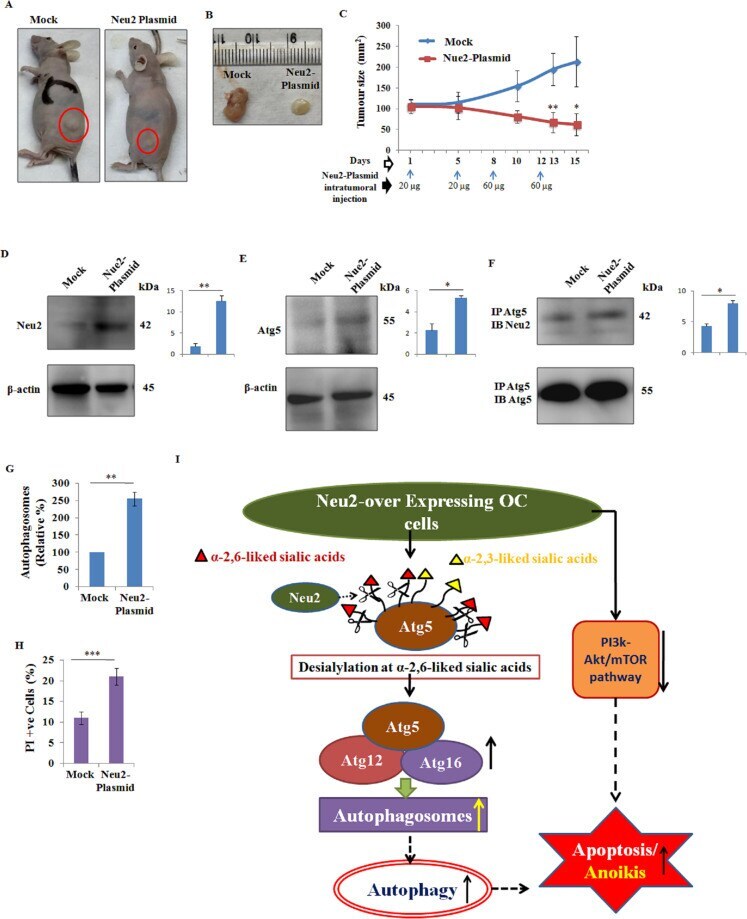
- Fig. 7 Neu2 plasmid decreased tumor size through enhancing autophagy and apoptosis in OC xenograft model. A PA1 cells (7 x 10 6 ) in ~200 mul of PBS:matrigel (1:1) were injected into athymic Balb/c mice ( n = 5) for generating human ovarian cancer xenograft. After tumor sizes reach ~80-120 mm 3 , Neu2 plasmid (1.0 mug/mul) was injected intratumorally for 4 times within 15 days as mentioned below. After 15 days of initial plasmid injection, images of all the experimental mice were captured and a representative image of a single mouse from each group is presented, highlighting the differences in tumor size between the two groups. B Tumors from mock and Neu2-plasmid-injected mice were isolated after 15 days of initial injection and representative images from both groups are shown . C In one group of human ovarian cancer xenograft mice ( n = 5), 20 and 60 µg of Neu2 plasmid were injected intratumorally on days 1 and 5 and days 8 and 12, respectively. Concentration of plasmid injections given throughout the experiment and time points were mentioned on the x -axis and indicated with blue arrows. The tumor's size ( y -axis) was measured on days 1, 5, 10, 13, and 15 using a screw gauge and represented on the x -axis of the line graph. D , E Primary cells were isolated from these tumors and protein levels of Neu2 (D) and Atg5 (E) were analyzed by western blot; beta-actin was used as the loading control. Representative blots are presented here. F Co-immunoprecipitation analysis o