 Explore
 Validate
 Learn
Learn Western blot
 ELISA
ELISAAntibody data
- Antibody Data
- Antigen structure
- References [1]
- Comments [0]
- Validations
- ELISA [2]
- Immunocytochemistry [1]
- Immunohistochemistry [2]
- Flow cytometry [2]
- Other assay [1]
Submit
Validation data
Reference
Comment
Report error
- Product number
- MA5-31871 - Provider product page

- Provider
- Invitrogen Antibodies
- Product name
- PTPN14 Monoclonal Antibody (2B3H7)
- Antibody type
- Monoclonal
- Antigen
- Purifed from natural sources
- Description
- MA5-31871 has been tested in indirect ELISA.
- Reactivity
- Human
- Host
- Mouse
- Isotype
- IgG
- Antibody clone number
- 2B3H7
- Vial size
- 100 μL
- Concentration
- 1 mg/mL
- Storage
- Store at 4°C short term. For long term storage, store at -20°C, avoiding freeze/thaw cycles.
Submitted references Physical Interaction between HPV16E7 and the Actin-Binding Protein Gelsolin Regulates Epithelial-Mesenchymal Transition via HIPPO-YAP Axis.
Matarrese P, Vona R, Ascione B, Paggi MG, Mileo AM
Cancers 2021 Jan 19;13(2)
Cancers 2021 Jan 19;13(2)
No comments: Submit comment
Supportive validation
- Submitted by
- Invitrogen Antibodies (provider)
- Main image
- Experimental details
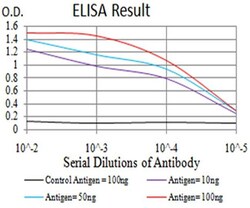
- ELISA analysis of PTPN14 in Control Antigen (black line, 100 ng); Antigen (purple line, 10 ng); Antigen (blue line, 50 ng); Antigen (red line, 100 ng). Samples were incubated with PTPN14 monoclonal antibody (Product # MA5-31871) using a dilution of 1:10,000.
- Submitted by
- Invitrogen Antibodies (provider)
- Main image

- Experimental details
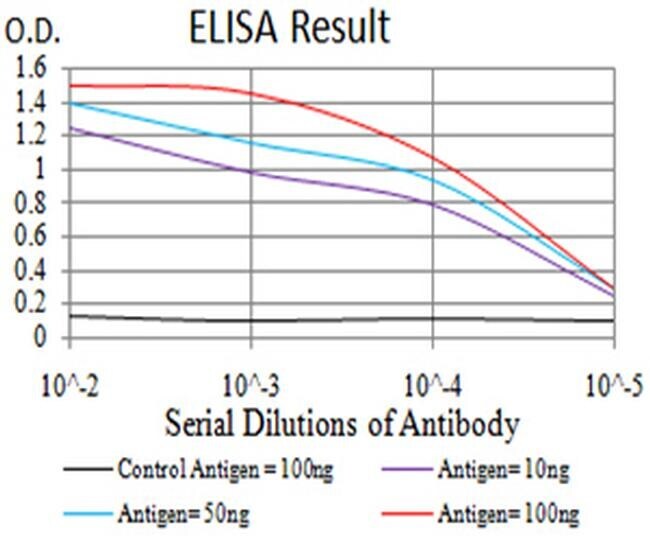
- ELISA analysis of PTPN14 in Control Antigen (black line, 100 ng); Antigen (purple line, 10 ng); Antigen (blue line, 50 ng); Antigen (red line, 100 ng). Samples were incubated with PTPN14 monoclonal antibody (Product # MA5-31871) using a dilution of 1:10,000.

Supportive validation
- Submitted by
- Invitrogen Antibodies (provider)
- Main image
- Experimental details
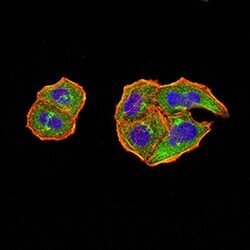
- Immunocytochemistry analysis of PTPN14 in Hela cells (green). Sample was incubated with PTPN14 monoclonal antibody (Product # MA5-31871) using a dilution of 1:200-1:1000 followed by DRAQ5 fluorescent DNA dye (blue), and Alexa Fluor- 555 phalloidin (red labeled actin filaments) .

Supportive validation
- Submitted by
- Invitrogen Antibodies (provider)
- Main image
- Experimental details
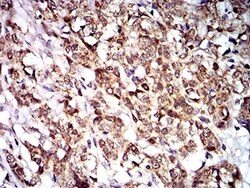
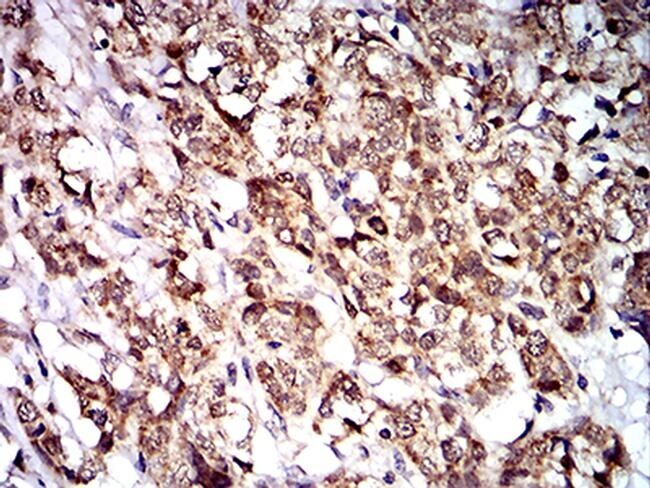
- Immunohistochemistry analysis of PTPN14 in paraffin-embedded breast cancer tissue. Sample was incubated with PTPN14 monoclonal antibody (Product # MA5-31871) using a dilution of 1:200-1:1000 followed by DAB staining.
- Submitted by
- Invitrogen Antibodies (provider)
- Main image
- Experimental details
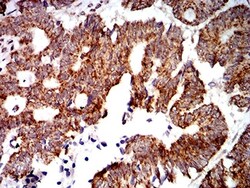
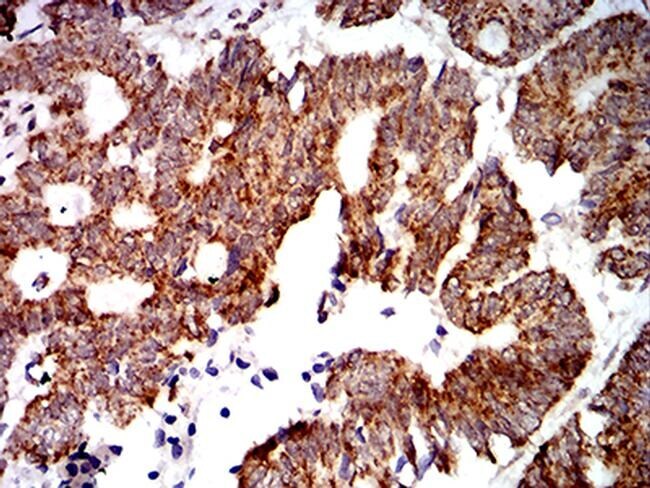
- Immunohistochemistry analysis of PTPN14 in paraffin-embedded rectum cancer tissue. Sample was incubated with PTPN14 monoclonal antibody (Product # MA5-31871) using a dilution of 1:200-1:1000 followed by DAB staining.
Supportive validation
- Submitted by
- Invitrogen Antibodies (provider)
- Main image

- Experimental details
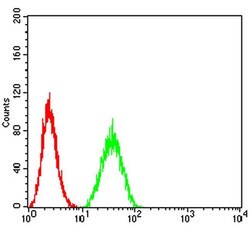
- Flow cytometry of PTPN14 in HeLa cells (green). Sample was incubated with PTPN14 monoclonal antibody (Product # MA5-31871) using a dilution of 1:200-1:400 followed by negative control (red).

- Submitted by
- Invitrogen Antibodies (provider)
- Main image
- Experimental details
- Flow cytometry of PTPN14 in HeLa cells (green). Sample was incubated with PTPN14 monoclonal antibody (Product # MA5-31871) using a dilution of 1:200-1:400 followed by negative control (red).

Supportive validation
- Submitted by
- Invitrogen Antibodies (provider)
- Main image
- Experimental details
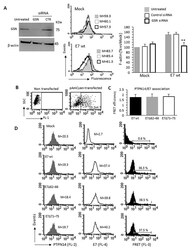
- Figure 4 Specific relevance of E7-GSN interaction. ( A ) Representative western blot of endogenous gelsolin (GSN) knockdown showing the relative abundance of GSN in pAmCyan trasfected cells (Mock), in transfected cells treated with specific siRNAs for GSN silencing (siRNAGSN) or treated with scrambled siRNAs as a negative control (siRNAcontrol) (left). Flow cytometry evaluation of the intracellular amount of F-actin restricted to pAmCyan-positive cells transfected with siRNAGSN or scrambled siRNA as control. Histograms obtained in a representative experiment are shown. Bar graph (right) shows the mean +- SD of the median fluorescence intensity obtained in four different experiments. ** p < 0.01 and *** p < 0.001 vs. Mock transfected cells. ( B - D ) Quantitative evaluation of PTPN14/E7 molecular association by FRET technique. ( B ) Flow cytometry analysis was restricted to pAmCyan-positive cells (reported as percentage). Bar graph in ( C ) shows FRET efficiency calculated according to the Riemann's algorithm. Data are reported as mean +- SD from three independent acquisitions. ( D ) Cytofluorimetric histograms obtained in one experiment representative of three. Numbers in the first and second columns indicate the median fluorescence intensity of the respective proteins, the percentage in the third column represent FL3 positive events. Uncropped western blot images for Figure 4 A are available in Supplementary Figure S8 .
