Explore
 Validate
 Learn
Learn Western blot
 Immunocytochemistry
Antibody data
- Antibody Data
- Antigen structure
- References [1]
- Comments [0]
- Validations
- Immunocytochemistry [1]
- Immunohistochemistry [2]
- Other assay [4]
Submit
Validation data
Reference
Comment
Report error
- Product number
- PA5-82881 - Provider product page

- Provider
- Invitrogen Antibodies
- Product name
- S100A8 Polyclonal Antibody
- Antibody type
- Polyclonal
- Antigen
- Recombinant protein fragment
- Description
- Immunogen sequence: LTELEKALNS IIDVYHKYSL IKGNFHAVYR DDLKKLLETE CPQYIRKKGA DVWFKELDIN TDGAVNFQEF LILVIKM
- Reactivity
- Human
- Host
- Rabbit
- Isotype
- IgG
- Vial size
- 100 μL
- Concentration
- 0.2 mg/mL
- Storage
- Store at 4°C short term. For long term storage, store at -20°C, avoiding freeze/thaw cycles.
Submitted references The Innate Immune Protein Calprotectin Interacts With and Encases Biofilm Communities of Pseudomonas aeruginosa and Staphylococcus aureus.
Baishya J, Everett JA, Chazin WJ, Rumbaugh KP, Wakeman CA
Frontiers in cellular and infection microbiology 2022;12:898796
Frontiers in cellular and infection microbiology 2022;12:898796
No comments: Submit comment
Supportive validation
- Submitted by
- Invitrogen Antibodies (provider)
- Main image

- Experimental details
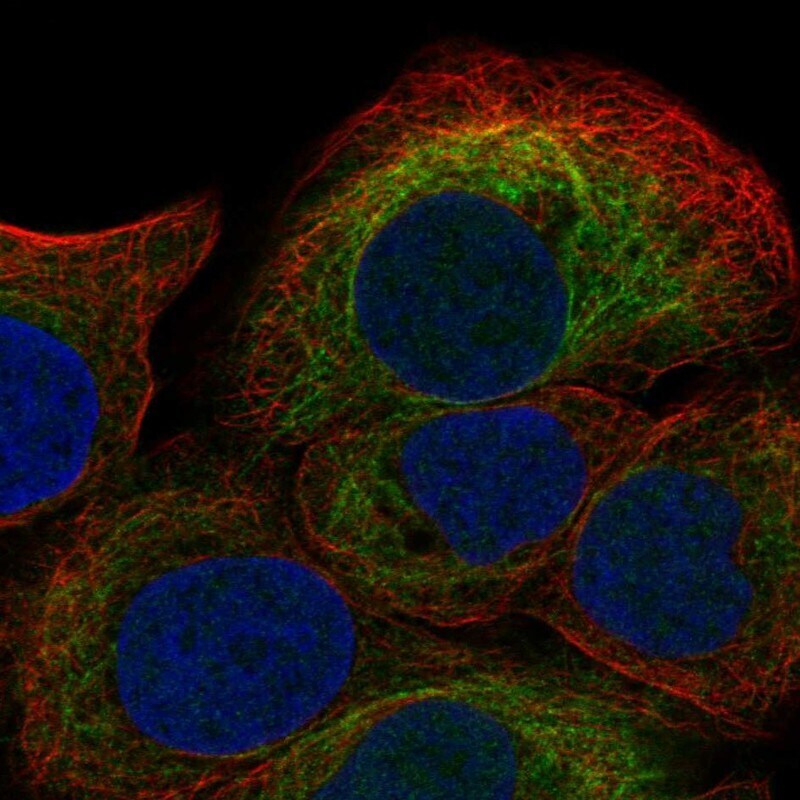
- Immunofluorecent analysis of S100A8 in human cell line HaCaT using S100A8 Polyclonal Antibody (Product # PA5-82881). Staining shows localization to intermediate filaments.
Supportive validation
- Submitted by
- Invitrogen Antibodies (provider)
- Main image
- Experimental details
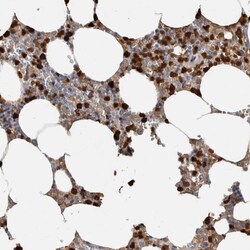
- Immunohistochemical analysis of S100A8 in human bone marrow using S100A8 Polyclonal Antibody (Product # PA5-82881) shows high expression.

- Submitted by
- Invitrogen Antibodies (provider)
- Main image
- Experimental details
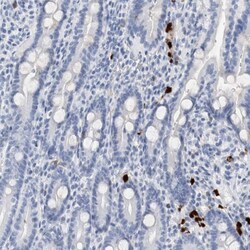
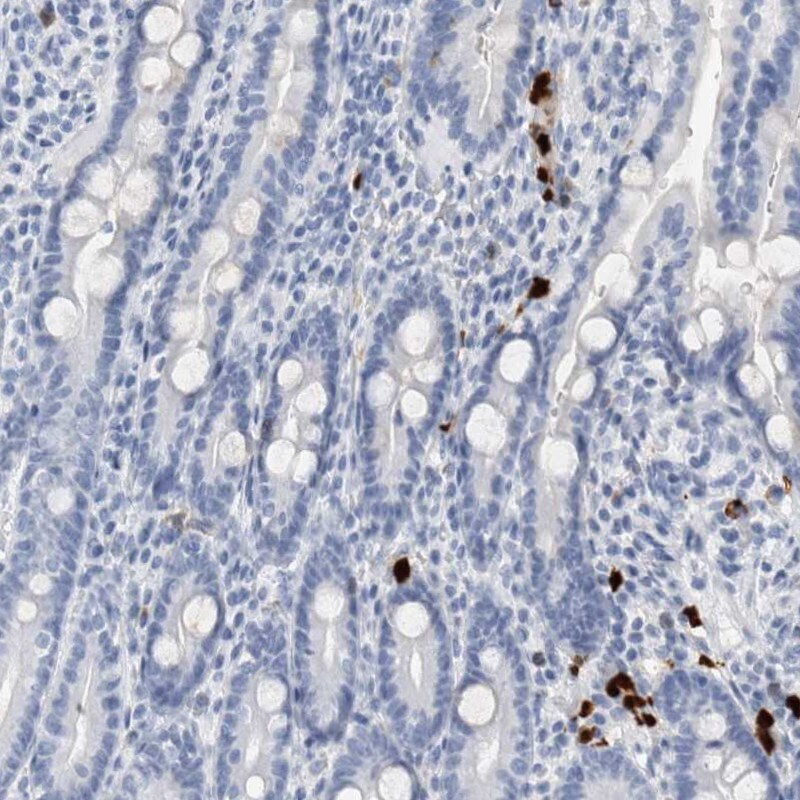
- Immunohistochemical analysis of S100A8 in human duodenum using S100A8 Polyclonal Antibody (Product # PA5-82881) shows low expression as expected.
Supportive validation
- Submitted by
- Invitrogen Antibodies (provider)
- Main image
- Experimental details
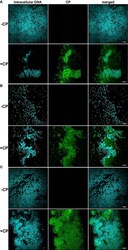
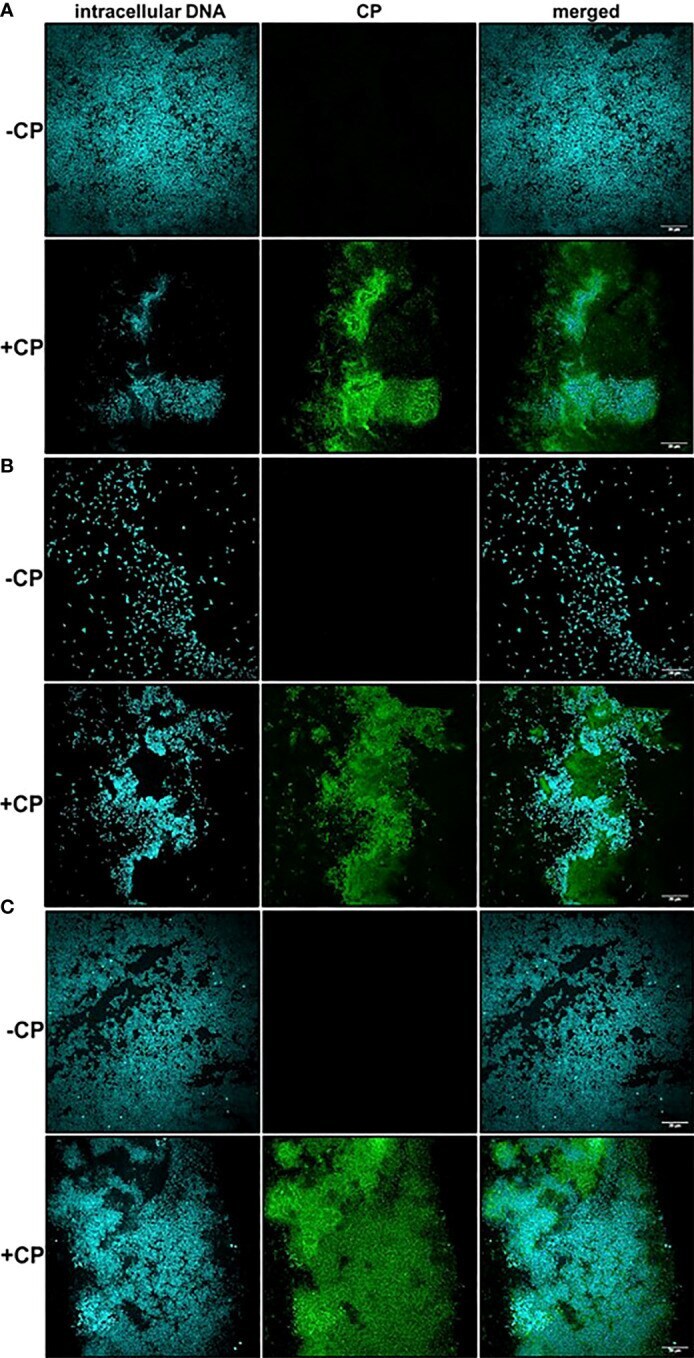
- Calprotectin is a major component of the mesh-like structure that encapsulates P. aeruginosa and S. aureus biofilms. Intracellular DNA of microbial cells was detected by staining with the cell-permeant nucleic acid dye, Hoechst 33342; CP was detected by staining with Alexa fluor 488-tagged Goat anti-Rabbit antibody. (A) P. aeruginosa monoculture (B) S. aureus monoculture (C) P. aeruginosa - S. aureus co-culture. Images show 100X magnification and were processed using ImageJ.
- Submitted by
- Invitrogen Antibodies (provider)
- Main image
- Experimental details
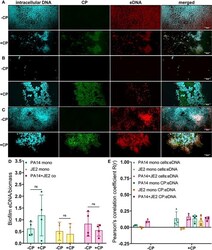
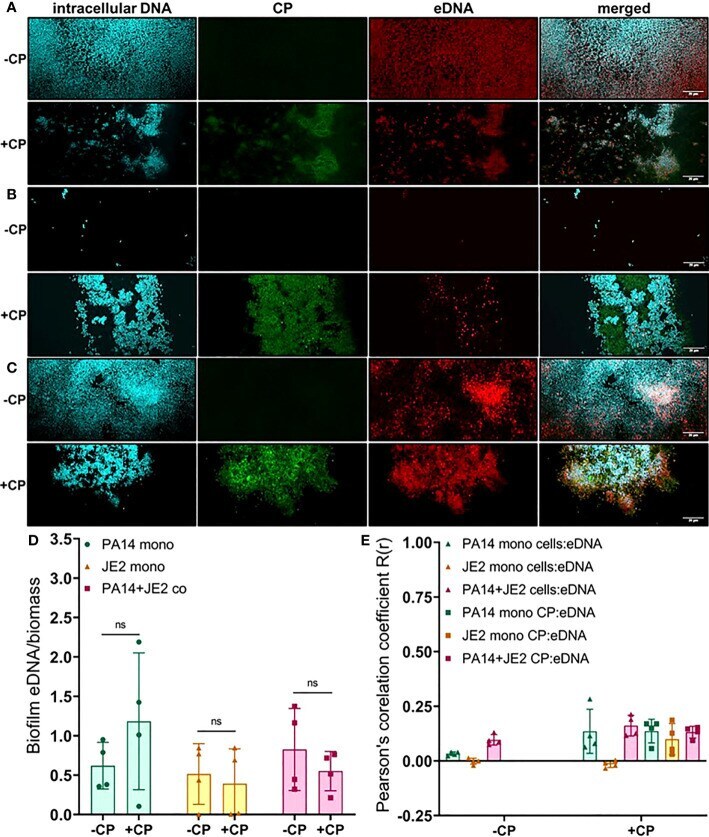
- Addition of CP minimally impacts the relative abundance of eDNA in biofilm matrices of P. aeruginosa and S. aureus. This figure depicts confocal images that represent abundance of eDNA in P. aeruginosa and/or S. aureus biofilm communities in presence or absence of CP conditions. The fluorescence dyes Hoechst 33342, Alexa 488, and TOTO-3 iodide correspond to intracellular DNA of microbial cells, CP, and eDNA in the biofilm EPS matrix of- (A) P. aeruginosa monoculture (B) S. aureus monoculture (C) P. aeruginosa - S. aureus co-culture. (D) Quantification of eDNA per biomass in P. aeruginosa and S. aureus biofilms in presence or absence of CP. (E) Colocalization analysis of eDNA signals with cells and CP show minimal correlation of distribution of eDNA with cells and/or CP. Images show 100X magnification and were processed using ImageJ. Bars represent the mean of four biological replicates performed on two independent days. Error bars represent the standard error of mean of the biological replicates. Unpaired t-test (two-tailed) was used to measure statistical significance. Comparisons marked ns denote changes that were not found to be statistically significant.
- Submitted by
- Invitrogen Antibodies (provider)
- Main image
- Experimental details
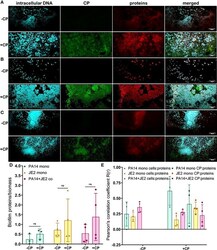
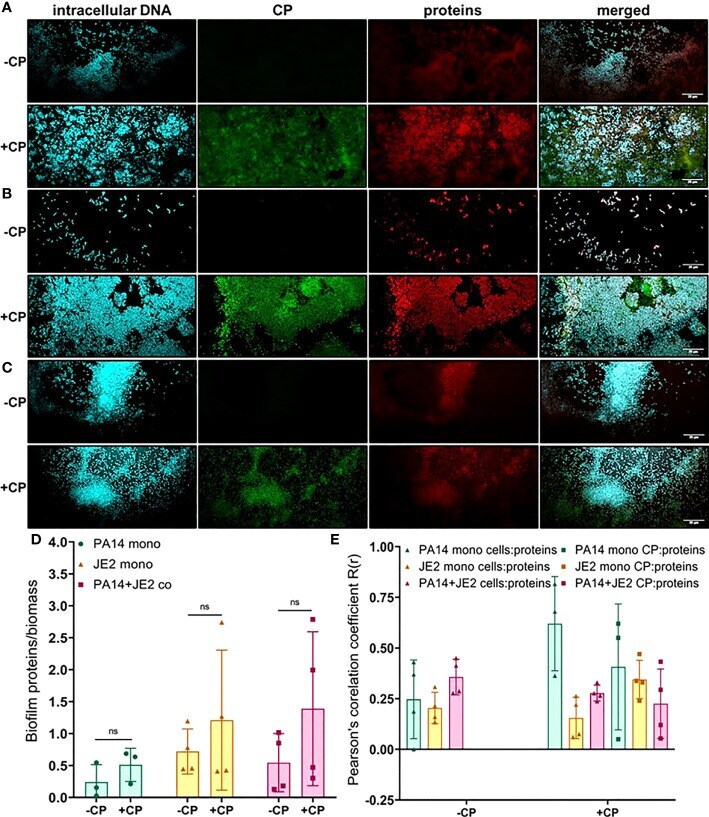
- Addition of CP correlates with subtle increase in the protein component of biofilm matrices. This figure depicts confocal images that represent abundance of proteins in P. aeruginosa and/or S. aureus biofilm communities in presence or absence of CP conditions. The fluorescence dyes Hoechst 33342, Alexa 488, and SYPRO Ruby correspond to intracellular DNA of microbial cells, CP, and matrix proteins in the biofilm EPS of- (A) P. aeruginosa monoculture (B) S. aureus monoculture (C) P. aeruginosa - S. aureus co-culture. (D) Quantification of proteins per biomass in P. aeruginosa and S. aureus biofilms in presence or absence of CP. (E) Colocalization analysis of protein signals with cells and CP show similar distribution of protein signals around cell signals and CP signals. Images show 100X magnification and were processed using ImageJ. Bars represent the mean of four biological replicates performed on two independent days. Error bars represent the standard error of mean of the biological replicates. Unpaired t-test (two-tailed) was used to measure statistical significance. Comparisons marked ns denote changes that were not found to be statistically significant.
- Submitted by
- Invitrogen Antibodies (provider)
- Main image
- Experimental details
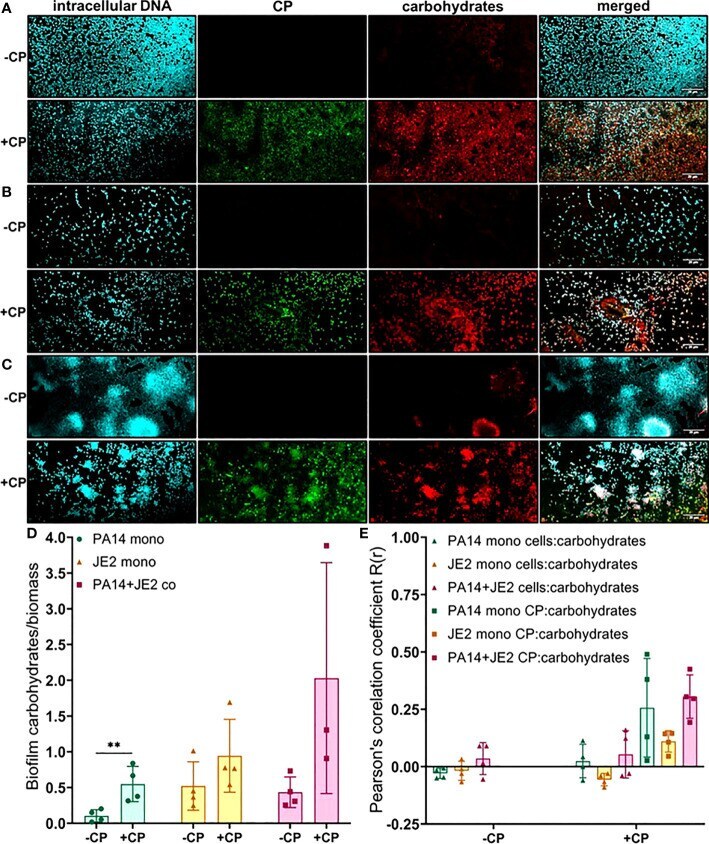
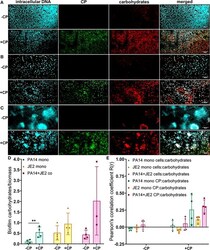
- Addition of CP leads to an increase in EPS carbohydrates in P. aeruginosa monoculture biofilms. This figure depicts confocal images that represent abundance of carbohydrates in P. aeruginosa and/or S. aureus biofilm communities in presence or absence of CP conditions. The fluorescence dyes Hoechst 33342, Alexa 488, and TRITC ConA correspond to intracellular DNA of microbial cells, CP, and carbohydrates in the biofilm EPS of- (A) P. aeruginosa monoculture (B) S. aureus monoculture (C) P. aeruginosa - S. aureus co-culture. (D) Quantification of carbohydrates per biomass in P. aeruginosa and S. aureus biofilms in presence or absence of CP. (E) Colocalization analysis of carbohydrate signals with cells and CP signals show higher correlation with CP compared to cells. Images show 100X magnification and were processed using ImageJ. Bars represent the mean of four biological replicates performed on two independent days. Error bars represent the standard error of mean of the biological replicates. Unpaired t-test (two-tailed) was used to measure statistical significance. **p