Explore
 Validate
 Learn
Learn Western blot
 Immunocytochemistry
Antibody data
- Antibody Data
- Antigen structure
- References [1]
- Comments [0]
- Validations
- Immunocytochemistry [4]
- Immunohistochemistry [5]
- Flow cytometry [2]
- Other assay [2]
Submit
Validation data
Reference
Comment
Report error
- Product number
- PA5-86063 - Provider product page

- Provider
- Invitrogen Antibodies
- Product name
- S100A8 Polyclonal Antibody
- Antibody type
- Polyclonal
- Antigen
- Recombinant full-length protein
- Reactivity
- Human, Rat
- Host
- Rabbit
- Isotype
- IgG
- Vial size
- 100 μL
- Concentration
- 1 mg/mL
- Storage
- Store at 4°C short term. For long term storage, store at -20°C, avoiding freeze/thaw cycles.
Submitted references DOK3 maintains intestinal homeostasis by suppressing JAK2/STAT3 signaling and S100a8/9 production in neutrophils.
Loh JT, Lee KG, Lee AP, Teo JKH, Lim HL, Kim SS, Tan AH, Lam KP
Cell death & disease 2021 Nov 6;12(11):1054
Cell death & disease 2021 Nov 6;12(11):1054
No comments: Submit comment
Supportive validation
- Submitted by
- Invitrogen Antibodies (provider)
- Main image
- Experimental details
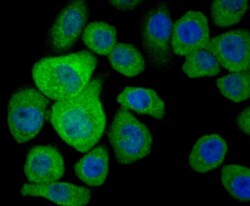
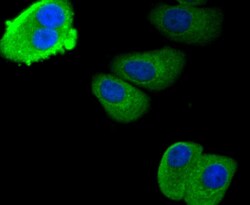
- Immunocytochemical analysis of S100A8 in AGS cells using a S100A8 Polyclonal antibody (Product # PA5-86063) as seen in green. The nuclear counter stain is DAPI (blue). Cells were fixed in paraformaldehyde, permeabilised with 0.25% Triton X100/PBS.
- Submitted by
- Invitrogen Antibodies (provider)
- Main image

- Experimental details
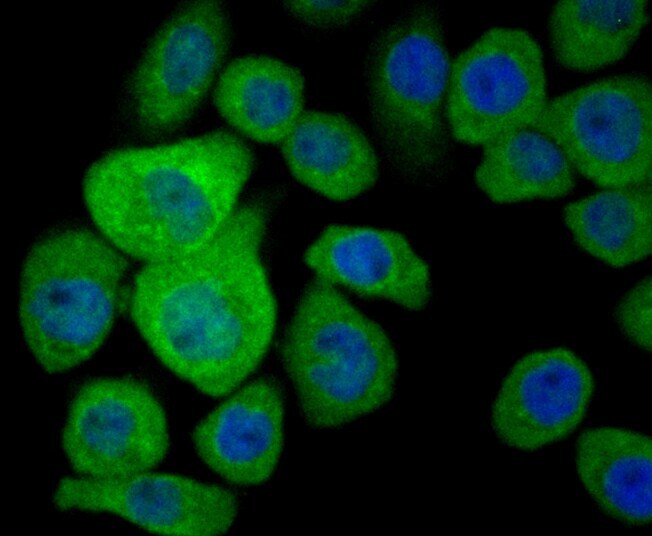
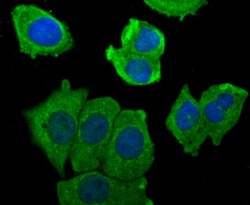
- Immunocytochemical analysis of S100A8 in MCF-7 cells using a S100A8 Polyclonal antibody (Product # PA5-86063) as seen in green. The nuclear counter stain is DAPI (blue). Cells were fixed in paraformaldehyde, permeabilised with 0.25% Triton X100/PBS.
- Submitted by
- Invitrogen Antibodies (provider)
- Main image
- Experimental details
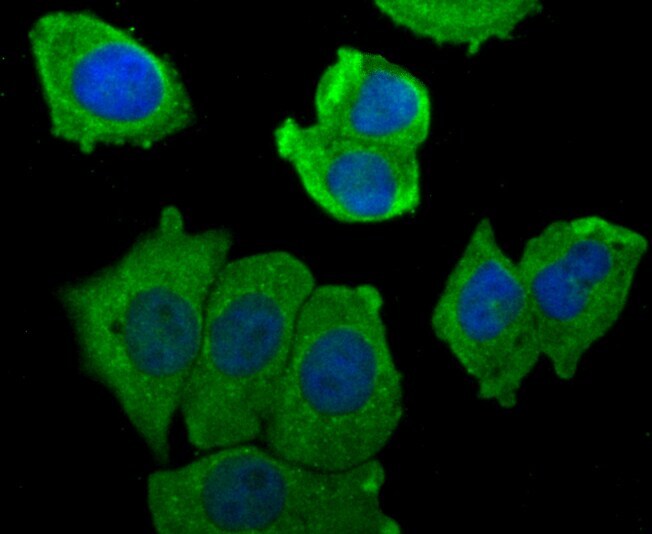
- Immunocytochemical analysis of S100A8 in SK-Br-3 cells using a S100A8 Polyclonal antibody (Product # PA5-86063) as seen in green. The nuclear counter stain is DAPI (blue). Cells were fixed in paraformaldehyde, permeabilised with 0.25% Triton X100/PBS.

- Submitted by
- Invitrogen Antibodies (provider)
- Main image
- Experimental details
- Immunocytochemical analysis of S100A8 in MCF-7 cells using a S100A8 Polyclonal antibody (Product # PA5-86063) as seen in green. The nuclear counter stain is DAPI (blue). Cells were fixed in paraformaldehyde, permeabilised with 0.25% Triton X100/PBS.

Supportive validation
- Submitted by
- Invitrogen Antibodies (provider)
- Main image
- Experimental details
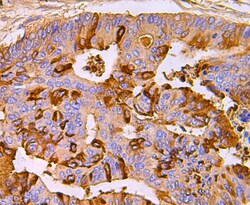
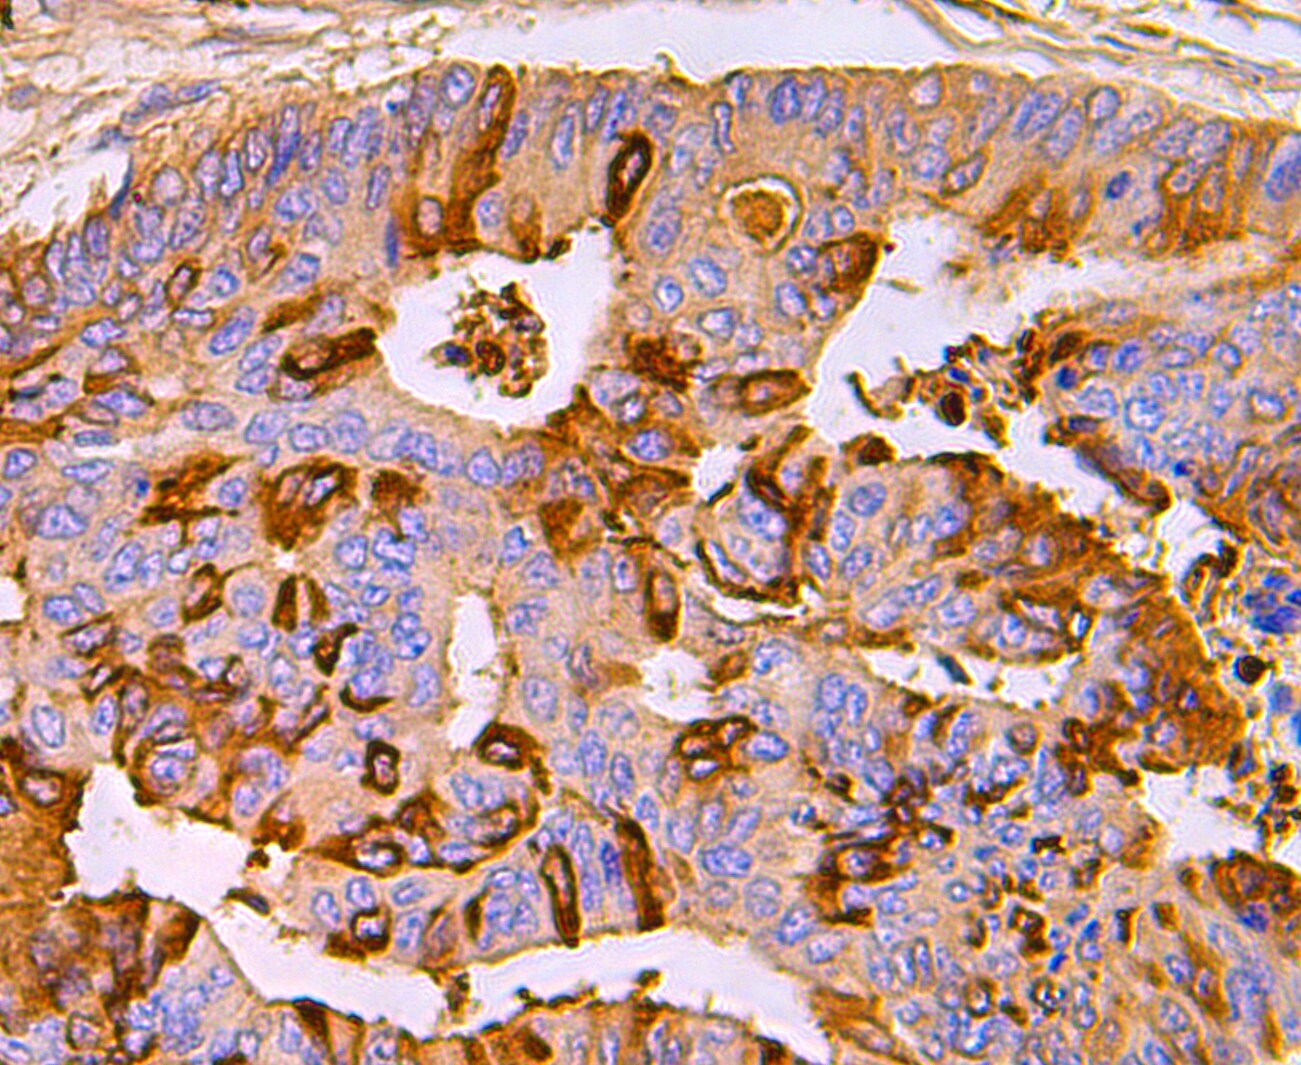
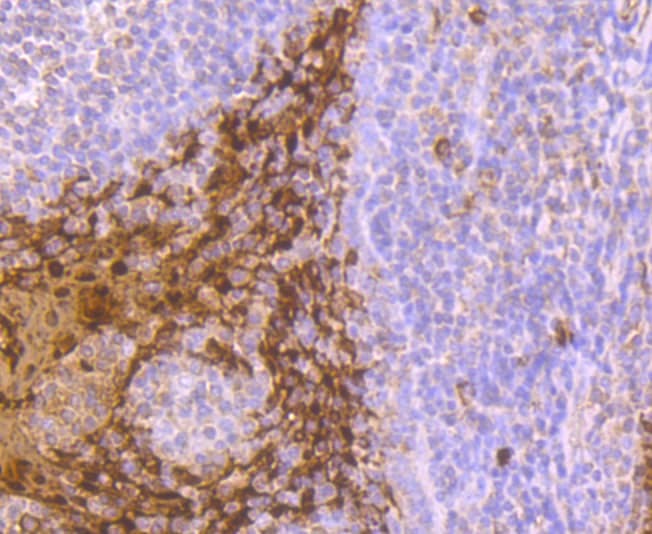
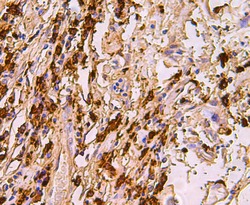
- Immunohistochemical analysis of S100A8 of paraffin-embedded Human colon cancer tissue using a S100A8 Polyclonal antibody (Product #PA5-86063). Counter stained with hematoxylin.
- Submitted by
- Invitrogen Antibodies (provider)
- Main image
- Experimental details
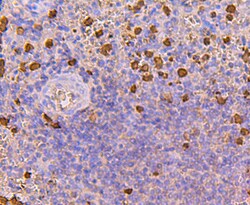
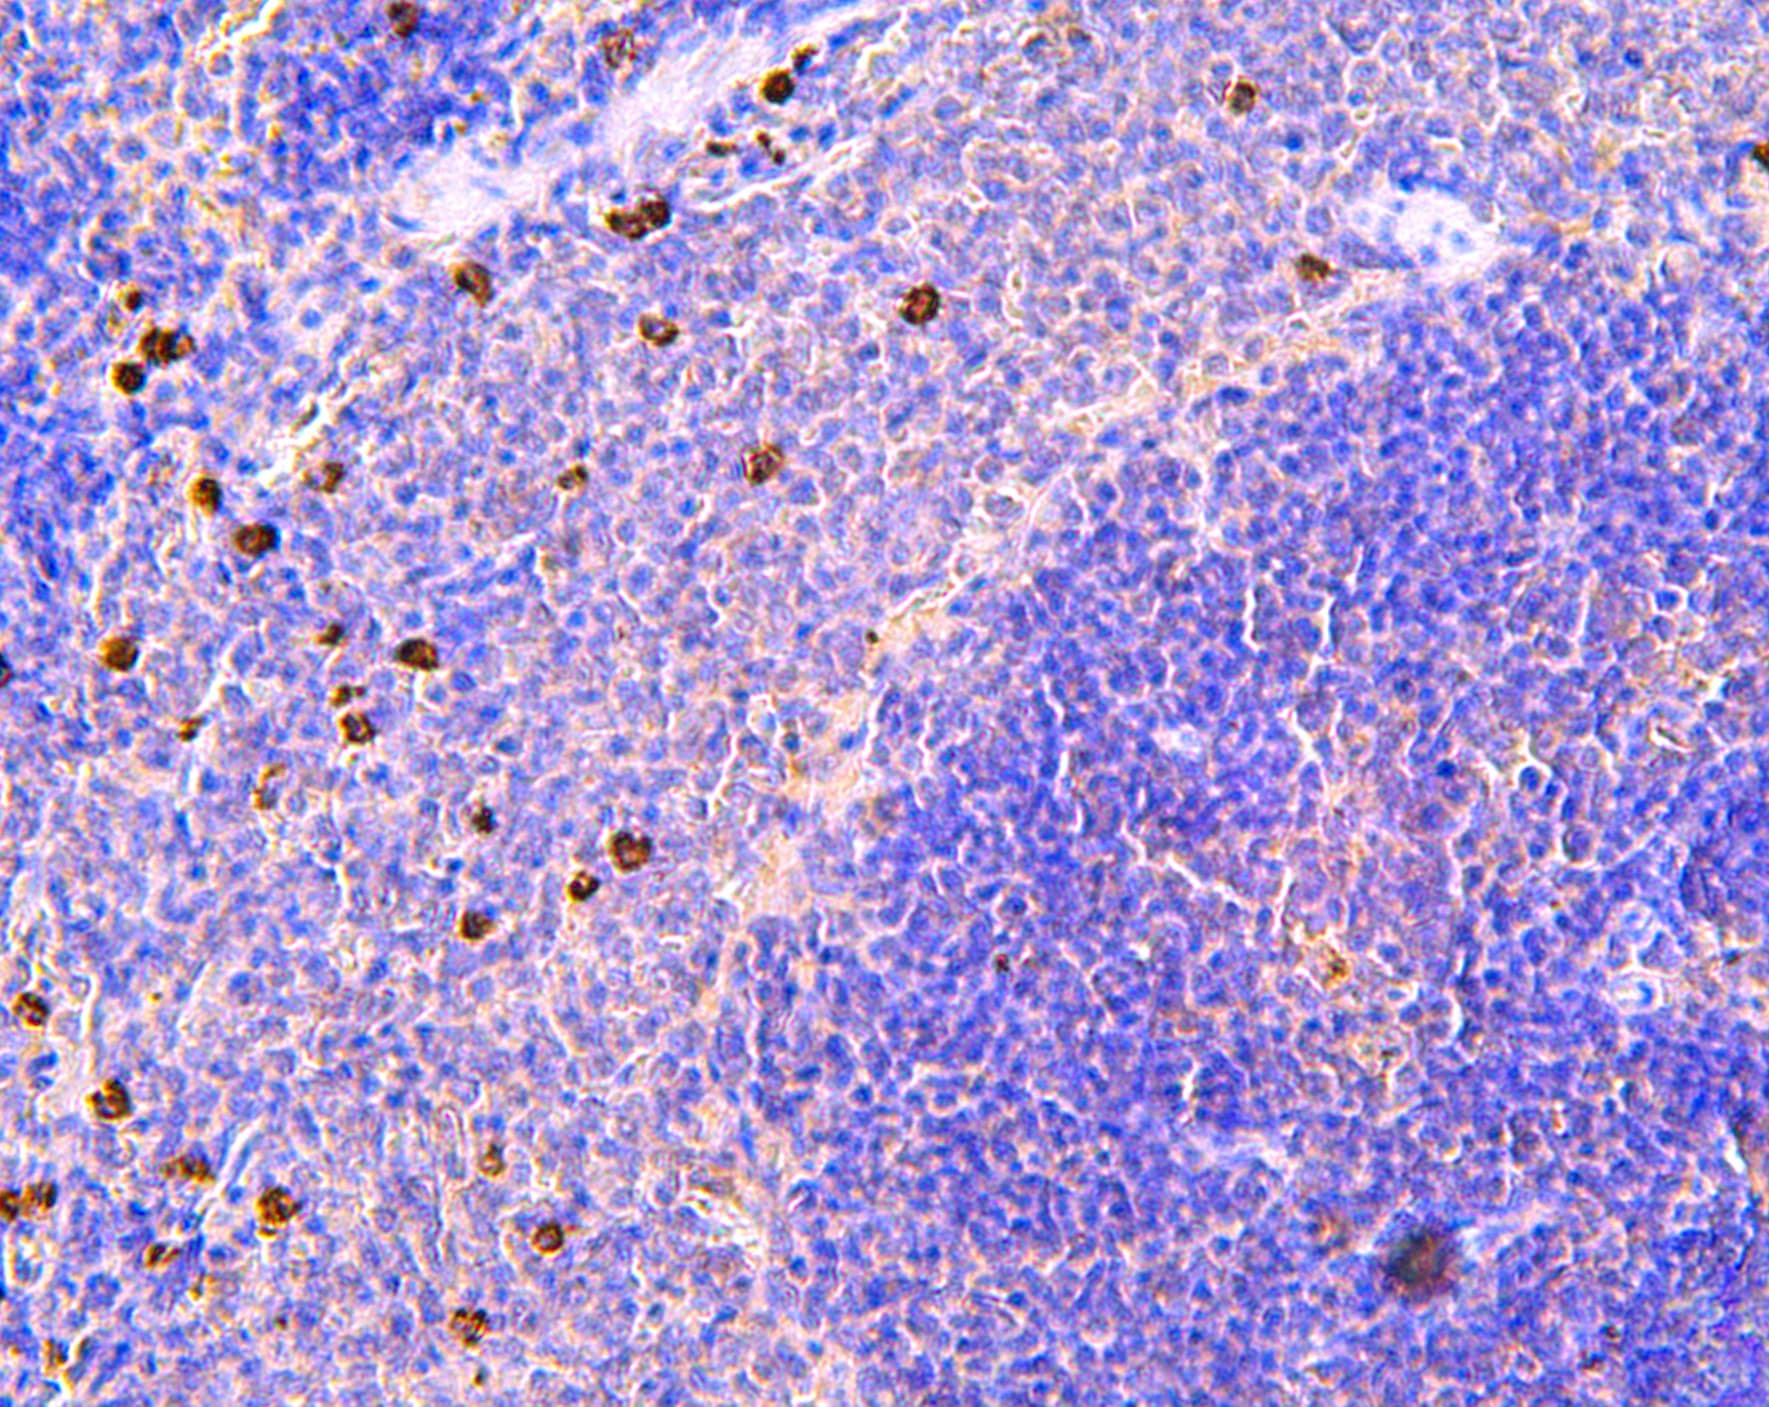
- Immunohistochemical analysis of S100A8 of paraffin-embedded Human spleen tissue using a S100A8 Polyclonal antibody (Product #PA5-86063). Counter stained with hematoxylin.
- Submitted by
- Invitrogen Antibodies (provider)
- Main image
- Experimental details
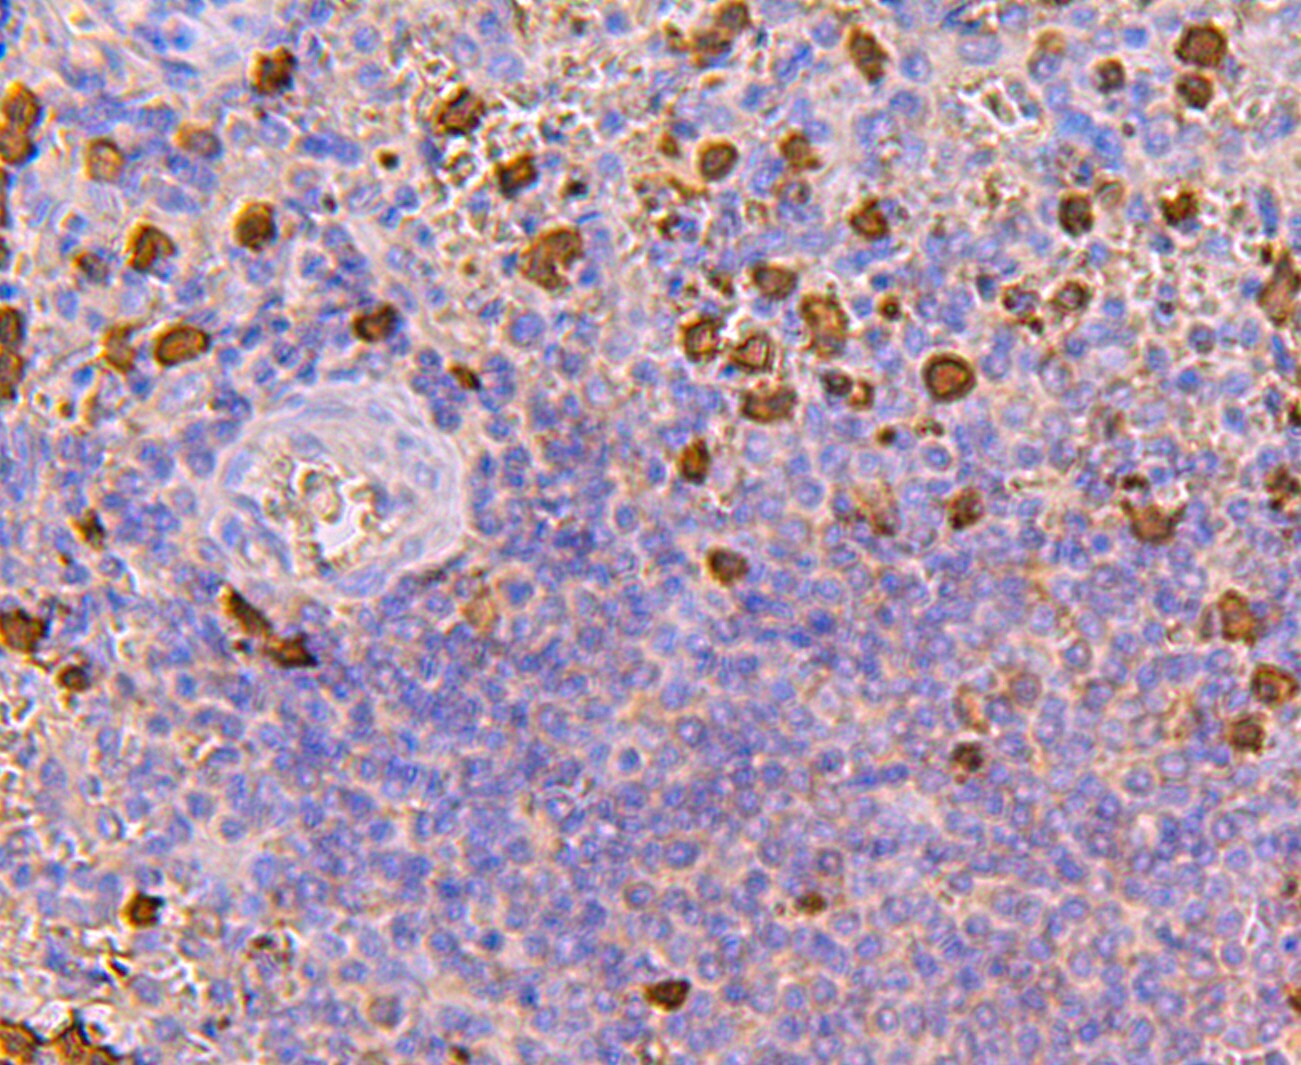
- Immunohistochemical analysis of S100A8 of paraffin-embedded Human tonsil tissue using a S100A8 Polyclonal antibody (Product #PA5-86063). Counter stained with hematoxylin.
- Submitted by
- Invitrogen Antibodies (provider)
- Main image

- Experimental details
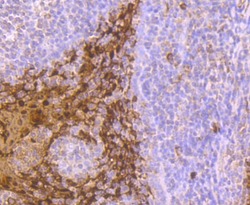
- Immunohistochemical analysis of S100A8 of paraffin-embedded rat spleen tissue using a S100A8 Polyclonal antibody (Product #PA5-86063). Counter stained with hematoxylin.
- Submitted by
- Invitrogen Antibodies (provider)
- Main image
- Experimental details
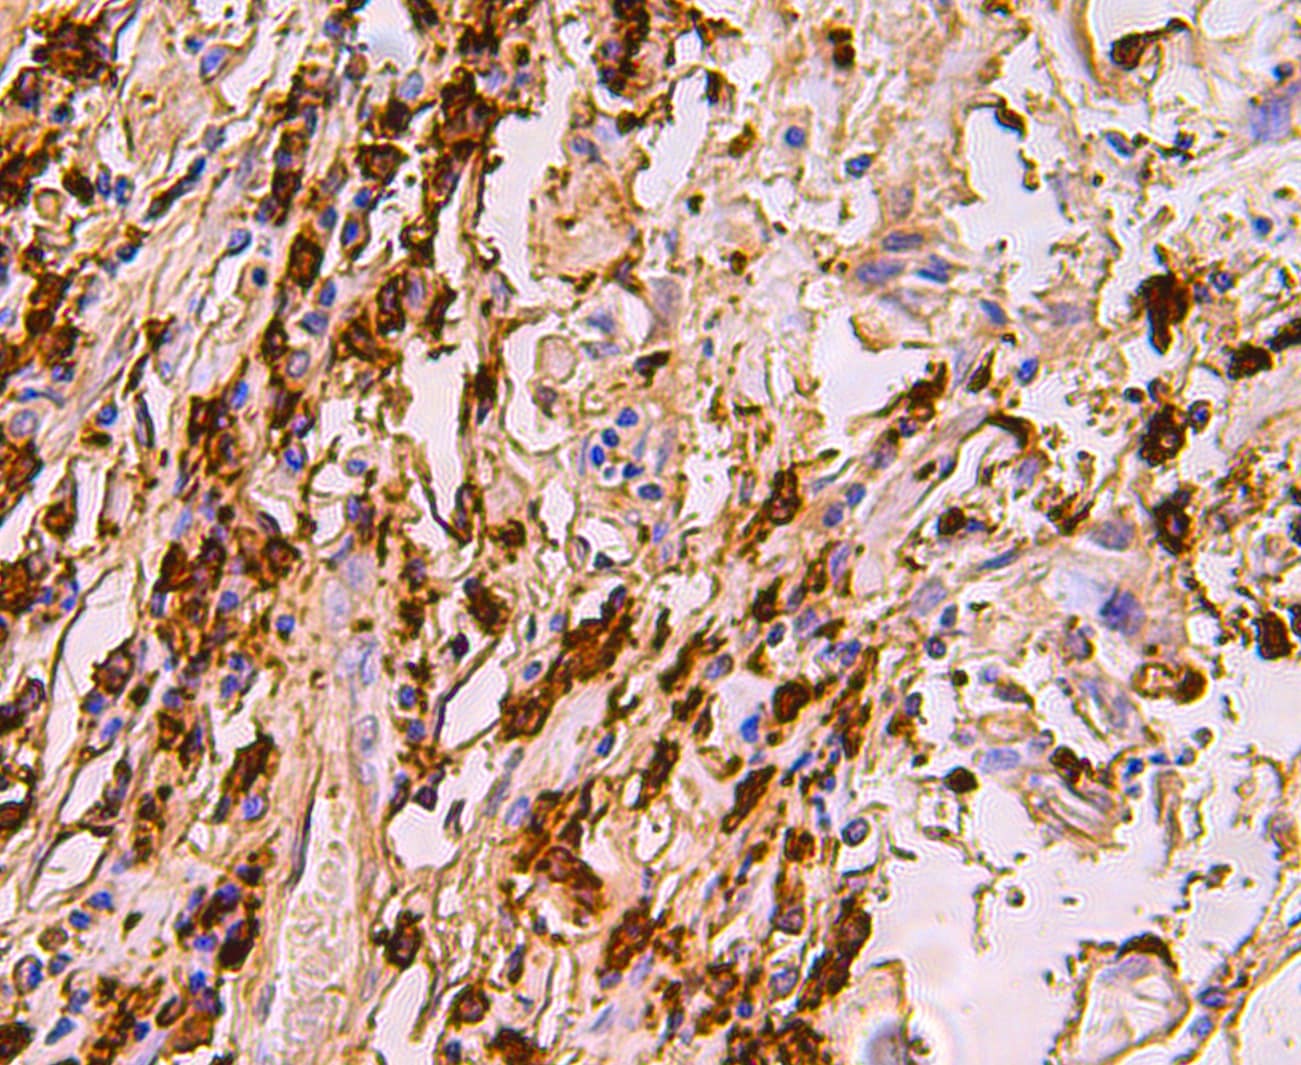
- Immunohistochemical analysis of S100A8 of paraffin-embedded Human breast cancer tissue using a S100A8 Polyclonal antibody (Product #PA5-86063). Counter stained with hematoxylin.
Supportive validation
- Submitted by
- Invitrogen Antibodies (provider)
- Main image

- Experimental details
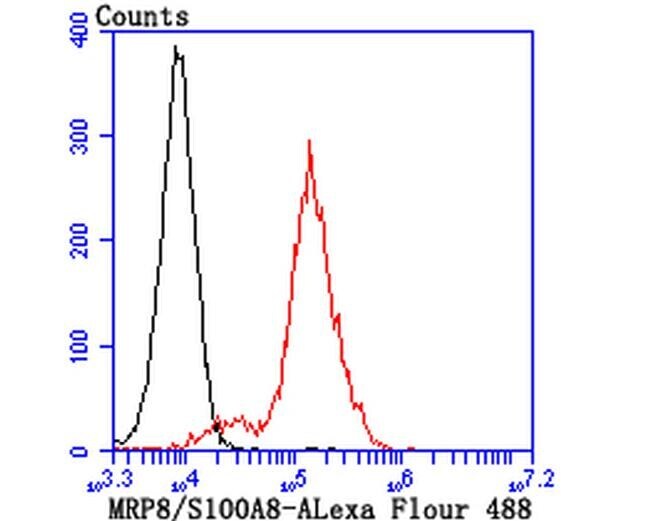
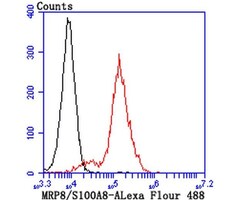
- Flow Cytometric analysis of S100A8 in THP-1 cells using a S100A8 Polyclonal Antibody (Product # PA5-86063) at a dilution of 1:100, as seen in red compared with an unlabelled control (cells without incubation with primary antibody; black).
- Submitted by
- Invitrogen Antibodies (provider)
- Main image
- Experimental details
- Flow Cytometric analysis of S100A8 in THP-1 cells using a S100A8 Polyclonal Antibody (Product # PA5-86063) at a dilution of 1:100, as seen in red compared with an unlabelled control (cells without incubation with primary antibody; black).

Supportive validation
- Submitted by
- Invitrogen Antibodies (provider)
- Main image
- Experimental details
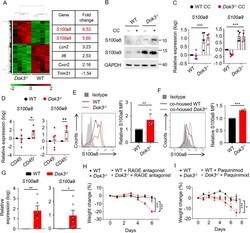
- Fig. 4 DOK3 regulates S100a8/9 production by neutrophils. A Expression heatmap based on microarray analysis of genes differentially expressed between colonic cells from WT and Dok3 -/- mice given 2% DSS in drinking water for 6 days. B Immunoblot analysis of S100a8, S100a9, and GAPDH in untreated (-) or cecal content (CC)-treated (+) lamina propria cells from WT and Dok3 -/- mice. Data is representative of three independent experiments. C RT-qPCR analysis of S100a8 and S100a9 expression relative to b-actin expression in lamina propria cells of WT and Dok3 -/- mice following 3 h stimulation with cecal contents from WT and Dok3 -/- mice. Data is shown as mean+-S.E.M (n = 4, four independent experiments). *** p < 0.0001, two-way ANOVA. D RT-qPCR analysis of S100a8 and S100a9 expression relative to b-actin expression in CD45 - and CD45 + cell fractions isolated from the lamina propria of WT and Dok3 -/- mice following 3 h stimulation with cecal contents from WT mice. Data is shown as mean +- SEM ( n = 5, five independent experiments). * p = 0.04, ** p = 0.002, unpaired two-tailed Student's t -test. E Flow cytometric analysis of S100a8 expression in WT and Dok3 -/- neutrophils following 3 h stimulation with cecal contents from WT mice. Histograms were pre-gated on singlet, CD45 + , Ly6G + cells. Filled histogram represent isotype control. Bar graph depicting MFI of S100a8 fluorescence in Dok3 -/- neutrophils relative to WT neutrophils. Data is shown as mean +- SD ( n = 6, five inde

- Submitted by
- Invitrogen Antibodies (provider)
- Main image
- Experimental details
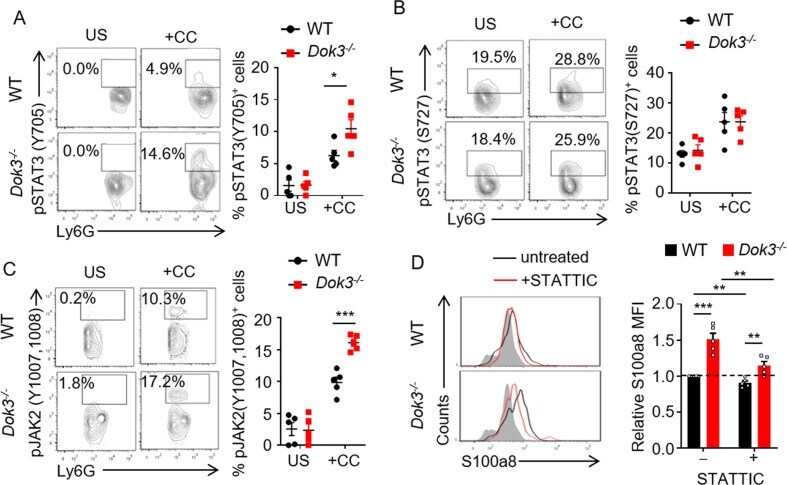
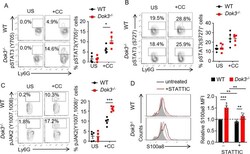
- Fig. 5 DOK3 suppresses JAK2-STAT3 signaling in neutrophils. A - C Lamina propria cells from WT and Dok3 -/- mice were unstimulated (US) or stimulated for 10 min with cecal contents (+CC) from wild-type mice. Flow cytometric analysis of A pSTAT3 (Y705), B pSTAT3 (S727) and C pJAK2 (Y1007, 1008) in colonic neutrophils ( n = 5, four independent experiments). Contour plots were pre-gated on singlet, CD45 + , Ly6G + cells. Data is shown as mean +- SEM. A * p = 0.03, unpaired two-tailed Student's t -test. C *** p = 0.0002, unpaired two-tailed Student's t -test. D Cells from lamina propria of WT and Dok3 -/- mice were stimulated for 3 h with cecal contents from wild-type mice in the absence (black histogram) or presence (red histogram) of STATTIC. Flow cytometric analysis of S100a8 expression in WT and Dok3 -/- colonic neutrophils. Histograms were pre-gated on singlet, CD45 + , Ly6G + cells. Filled histogram represents isotype control. Bar graph depicts MFI of S100a8 fluorescence in WT (black bars) and Dok3 -/- (red bars) neutrophils treated or not with STATTIC relative to that of untreated WT neutrophils. Data is shown as mean +- SEM ( n = 5, four independent experiments). ** p = 0.008, 0.007, 0.005 (from left to right), *** p = 0.0002, unpaired two-tailed Student's t -test.