Explore
 Validate
 Learn
Learn Western blot
 Immunocytochemistry
Antibody data
- Antibody Data
- Antigen structure
- References [1]
- Comments [0]
- Validations
- Immunocytochemistry [1]
- Other assay [4]
Submit
Validation data
Reference
Comment
Report error
- Product number
- PA5-101099 - Provider product page

- Provider
- Invitrogen Antibodies
- Product name
- ITPKB Polyclonal Antibody
- Antibody type
- Polyclonal
- Antigen
- Synthetic peptide
- Description
- Antibody detects endogenous levels of total IP3KB.
- Reactivity
- Human, Mouse, Rat
- Host
- Rabbit
- Isotype
- IgG
- Vial size
- 100 μL
- Concentration
- 1 mg/mL
- Storage
- -20°C
Submitted references Microglia-Derived Extracellular Vesicles Carrying miR-711 Alleviate Neurodegeneration in a Murine Alzheimer's Disease Model by Binding to Itpkb.
Zhang Y, Xu C, Nan Y, Nan S
Frontiers in cell and developmental biology 2020;8:566530
Frontiers in cell and developmental biology 2020;8:566530
No comments: Submit comment
Supportive validation
- Submitted by
- Invitrogen Antibodies (provider)
- Main image
- Experimental details
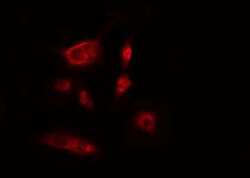
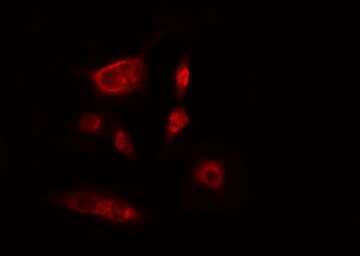
- Immunofluorescent analysis of ITPKB in HeLa cells. Samples were fixed with paraformaldehyde, permeabilized with 0.1% Triton X-100, blocked with 10% serum (45 min at 25°C) incubated with ITPKB polyclonal antibody (Product # PA5-101099) using a dilution of 1:200 (1 hr, 37°C), and followed by goat anti-rabbit IgG Alexa Fluor 594 at a dilution of 1:600.
Supportive validation
- Submitted by
- Invitrogen Antibodies (provider)
- Main image
- Experimental details
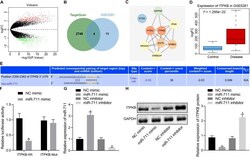
- FIGURE 3 miR-711 targets and negatively regulates Itpkb. (A) The volcano expression graph of the expression profile GSE5281. Red dots indicate upregulated genes and green dots indicate downregulated genes. (B) TargetScan prediction of downstream genes of miR-711 and Venn diagram of the top 15 genes of expression profile GSE5281. The four genes in the intersection are ERBB2IP, SEMA4C, Itpkb, and DTNA. (C) PPI network diagram of the four intersections and their related genes constructed by String. A higher gene core degree corresponds to a darker circle color, whereas a lower core degree corresponds to a bluer color. (D) Itpkb expression box plot drawn based on the data of expression profile GSE5281. The blue box on the left indicates the expression in normal samples, and the red box on the right indicates the expression in AD samples. (E) The possible binding site of miR-711 to Itpkb predicted by TargetScan. (F) Dual-luciferase reporter gene assay to verify whether miR-711 can target Itpkb. (G) RT-qPCR to detect the expression of miR-711 in BV2 cells in each group. (H) Western blot analysis to detect the expression of Itpkb normalized to GAPDH in BV2 cells in each group. * p < 0.05 versus the NC mimic group; # p < 0.05 versus the NC inhibitor group. The measurement data were summarized as mean +- standard deviation. Unpaired t -test was used for two-group comparisons. One-way ANOVA was carried out for comparisons among multiple groups followed by Tukey's post hoc test. Cellula

- Submitted by
- Invitrogen Antibodies (provider)
- Main image
- Experimental details
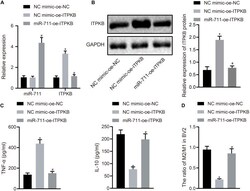
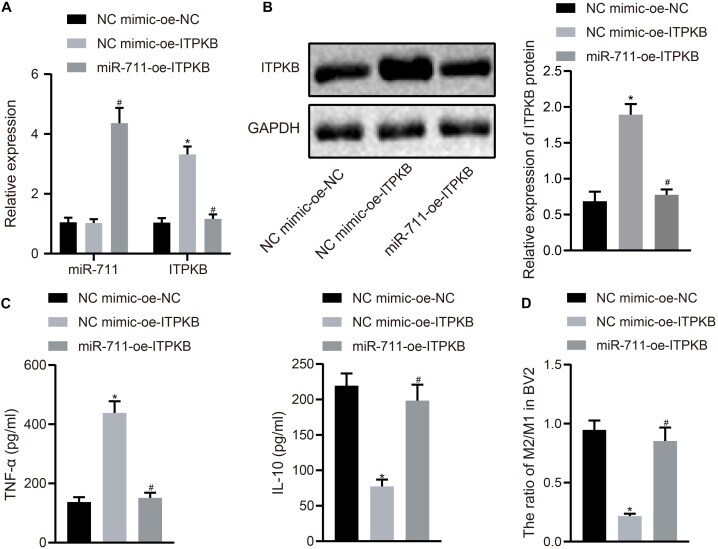
- FIGURE 4 miR-711 mediates anti-inflammatory pathway of microglia and M2-like phenotype by targeting Itpkb. (A) RT-qPCR to detect the expression of miR-711 and Itpkb in each group of BV2 cells. (B) Western blot assay to detect the expression of Itpkb normalized to GAPDH in each group of BV2 cells. (C) ELISA to detect the expression of inflammatory factor TNF-alpha and anti-inflammatory factor IL-10 in BV2 cell culture medium. (D) Flow cytometry to detect the content of M2 phenotype and M1 phenotype microglia in BV2 cells, with the ratio calculated. * p < 0.05 versus the NC mimic-OE-NC group; # p < 0.05 versus the NC mimic-OE-Itpkb group. The measurement data were summarized as mean +- standard deviation. One-way ANOVA was carried out for comparisons among multiple groups followed by Tukey's post hoc test. Cellular experiment was repeated three times independently.
- Submitted by
- Invitrogen Antibodies (provider)
- Main image
- Experimental details
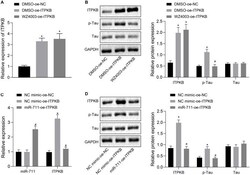
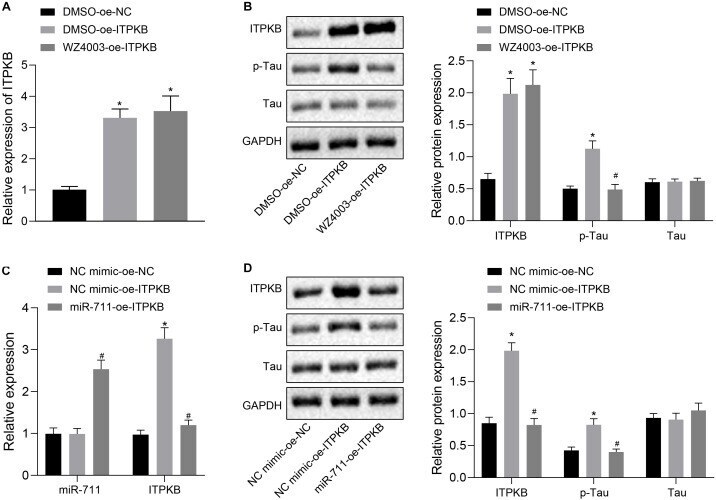
- FIGURE 5 miR-711 mediates Tau protein hyperphosphorylation via Itpkb pathway. (A) RT-qPCR detection of Itpkb expression in each group of BV2 cells. (B) Western blot detection of Itpkb, p-Tau and Tau expression normalized to GAPDH in each group of BV2 cells. (C) RT-qPCR detection of miR-711 and Itpkb expression in each group of BV2 cells. (D) Western blot detection of the expression of Itpkb, p-Tau and Tau normalized to GAPDH in BV2 cells of each group. * p < 0.05 versus the NC mimic-OE-NC group or DMSO-OE-NC group; # p < 0.05 versus the DMSO-OE-Itpkb group or NC mimic-OE-Itpkb group. The measurement data were summarized as mean +- standard deviation. One-way ANOVA was carried out for comparisons among multiple groups followed by Tukey's post hoc test. Cellular experiment was repeated three times independently.
- Submitted by
- Invitrogen Antibodies (provider)
- Main image
- Experimental details
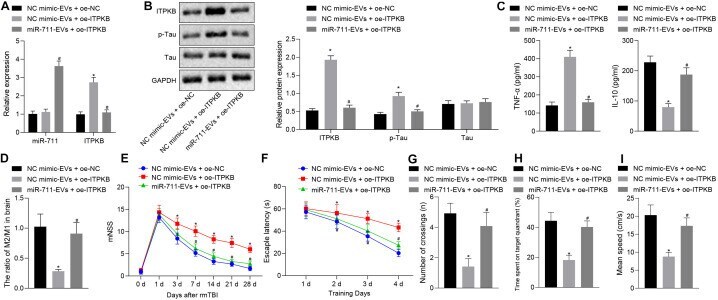
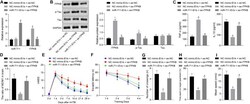
- FIGURE 6 miR-711-loaded microglia-derived EVs alleviate inflammation, neurodegenerative changes and cognitive dysfunction in mice by targeting Itpkb. (A) RT-qPCR to detect the expression of miR-711 and Itpkb in the brain tissues of mice in each group. (B) Western blot assay to detect the expression of p-Tau and Itpkb protein in mouse brain tissues, normalized to GAPDH. (C) ELISA to detect the expression of inflammatory factor TNF-alpha and anti-inflammatory factor IL-10 in mouse serum. (D ) Flow cytometry to detect the content of M2 phenotype and M1 phenotype microglia in mouse brain tissue, with the ratio calculated. (E) After the model was successfully constructed, the mice were scored for neurological deficits on days 1, 3, 7, 14, 21, and 28. (F) Quantitative analysis of the Morris water maze escape latency of the mice in each group during 4 days of training. (G) Quantitative analysis of the number of times that the mice of each group crossed the target platform. (H) Quantitative analysis of the percentage of time spent by the mice in the target quadrant. (I) Quantitative analysis of the average swimming speed of mice in each group. * p < 0.05 versus the NC mimic-EVs + OE-NC group; # p < 0.05 versus the NC mimic-EVs + OE-Itpkb group. The measurement data were summarized as mean +- standard deviation. One-way ANOVA was carried out for comparisons among multiple groups followed by Tukey's post hoc test. Repeated measures ANOVA with Bonferroni post hoc test was employed to co