Explore
 Validate
 Learn
Learn Western blot
 Immunocytochemistry
Antibody data
- Antibody Data
- Antigen structure
- References [6]
- Comments [0]
- Validations
- Immunocytochemistry [7]
- Immunohistochemistry [2]
- Other assay [4]
Submit
Validation data
Reference
Comment
Report error
- Product number
- PA3-912 - Provider product page

- Provider
- Invitrogen Antibodies
- Product name
- Rab4 Polyclonal Antibody
- Antibody type
- Polyclonal
- Antigen
- Purifed from natural sources
- Description
- PA3-912 detects Rab4 from human and mouse samples. This antibody does not detect other Rab isoforms (Rab1, Rab3, Rab5, or Rab6). PA3-912 has been successfully used in Western blot and immunofluorescence procedures. By Western blot, this antibody detects a ~24 kDa band representing Rab4 from transfected HeLa cells. The PA3-912 immunogen is purified recombinant human Rab4 protein.
- Reactivity
- Human, Mouse, Rat, Canine
- Host
- Rabbit
- Isotype
- IgG
- Vial size
- 100 μL
- Concentration
- Conc. Not Determined
- Storage
- -20°C, Avoid Freeze/Thaw Cycles
Submitted references RAB5A expression is a predictive biomarker for trastuzumab emtansine in breast cancer.
Nuclear and Cytoplasmatic Quantification of Unconjugated, Label-Free Locked Nucleic Acid Oligonucleotides.
Endosomal trafficking defects in patient cells with KIAA1109 biallelic variants.
WDFY2 restrains matrix metalloproteinase secretion and cell invasion by controlling VAMP3-dependent recycling.
Genome-wide, high-content siRNA screening identifies the Alzheimer's genetic risk factor FERMT2 as a major modulator of APP metabolism.
Dynamic internalization and recycling of a metal ion transporter: Cu homeostasis and CTR1, the human Cu⁺ uptake system.
Engebraaten O, Yau C, Berg K, Borgen E, Garred Ø, Berstad MEB, Fremstedal ASV, DeMichele A, Veer LV', Esserman L, Weyergang A
Nature communications 2021 Nov 5;12(1):6427
Nature communications 2021 Nov 5;12(1):6427
Nuclear and Cytoplasmatic Quantification of Unconjugated, Label-Free Locked Nucleic Acid Oligonucleotides.
Pendergraff H, Schmidt S, Vikeså J, Weile C, Øverup C, W Lindholm M, Koch T
Nucleic acid therapeutics 2020 Feb;30(1):4-13
Nucleic acid therapeutics 2020 Feb;30(1):4-13
Endosomal trafficking defects in patient cells with KIAA1109 biallelic variants.
Kane MS, Diamonstein CJ, Hauser N, Deeken JF, Niederhuber JE, Vilboux T
Genes & diseases 2019 Mar;6(1):56-67
Genes & diseases 2019 Mar;6(1):56-67
WDFY2 restrains matrix metalloproteinase secretion and cell invasion by controlling VAMP3-dependent recycling.
Sneeggen M, Pedersen NM, Campsteijn C, Haugsten EM, Stenmark H, Schink KO
Nature communications 2019 Jun 28;10(1):2850
Nature communications 2019 Jun 28;10(1):2850
Genome-wide, high-content siRNA screening identifies the Alzheimer's genetic risk factor FERMT2 as a major modulator of APP metabolism.
Chapuis J, Flaig A, Grenier-Boley B, Eysert F, Pottiez V, Deloison G, Vandeputte A, Ayral AM, Mendes T, Desai S, Goate AM, Kauwe JSK, Leroux F, Herledan A, Demiautte F, Bauer C, Checler F, Petersen RC, Blennow K, Zetterberg H, Minthon L, Van Deerlin VM, Lee VM, Shaw LM, Trojanowski JQ, Albert M, Moghekar A, O'Brien R, Peskind ER, Malmanche N, Schellenberg GD, Dourlen P, Song OR, Cruchaga C, Amouyel P, Deprez B, Brodin P, Lambert JC, ADGC, Alzheimer’s Disease Neuroimaging Initiative
Acta neuropathologica 2017 Jun;133(6):955-966
Acta neuropathologica 2017 Jun;133(6):955-966
Dynamic internalization and recycling of a metal ion transporter: Cu homeostasis and CTR1, the human Cu⁺ uptake system.
Clifford RJ, Maryon EB, Kaplan JH
Journal of cell science 2016 Apr 15;129(8):1711-21
Journal of cell science 2016 Apr 15;129(8):1711-21
No comments: Submit comment
Supportive validation
- Submitted by
- Invitrogen Antibodies (provider)
- Main image

- Experimental details
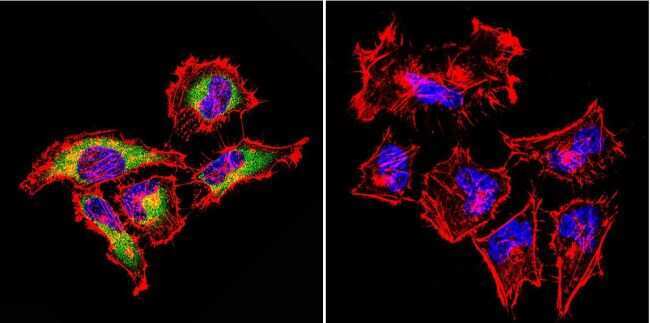
- Immunofluorescent analysis of RAB4 in HeLa Cells. Cells were grown on chamber slides and fixed with formaldehyde prior to staining. Cells were probed without (control) or with a RAB4 polyclonal antibody (Product # PA3-912) at a dilution of 1:100 overnight at 4 C, washed with PBS and incubated with a DyLight-488 conjugated secondary antibody (Product # 35552). RAB4 staining (green), F-Actin staining with Phalloidin (red) and nuclei with DAPI (blue) is shown. Images were taken at 60X magnification.
- Submitted by
- Invitrogen Antibodies (provider)
- Main image

- Experimental details
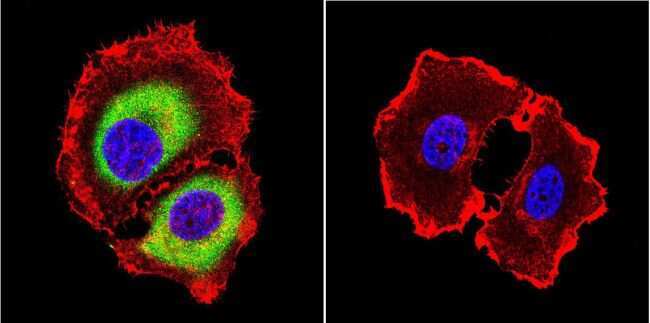
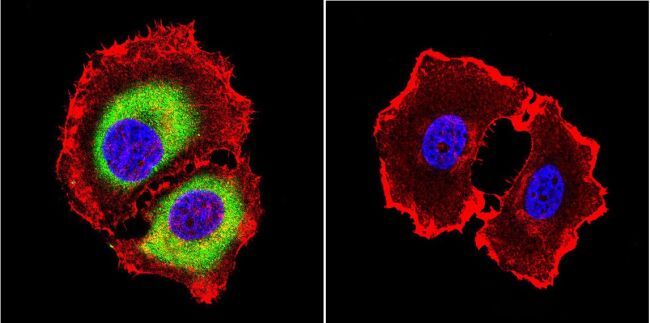
- Immunofluorescent analysis of RAB4 in MCF-7 Cells. Cells were grown on chamber slides and fixed with formaldehyde prior to staining. Cells were probed without (control) or with a RAB4 polyclonal antibody (Product # PA3-912) at a dilution of 1:20 overnight at 4 C, washed with PBS and incubated with a DyLight-488 conjugated secondary antibody (Product # 35552). RAB4 staining (green), F-Actin staining with Phalloidin (red) and nuclei with DAPI (blue) is shown. Images were taken at 60X magnification.
- Submitted by
- Invitrogen Antibodies (provider)
- Main image

- Experimental details
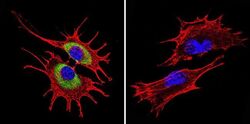
- Immunofluorescent analysis of RAB4 in NIH-3T3 Cells. Cells were grown on chamber slides and fixed with formaldehyde prior to staining. Cells were probed without (control) or with a RAB4 polyclonal antibody (Product # PA3-912) at a dilution of 1:20 overnight at 4 C, washed with PBS and incubated with a DyLight-488 conjugated secondary antibody (Product # 35552). RAB4 staining (green), F-Actin staining with Phalloidin (red) and nuclei with DAPI (blue) is shown. Images were taken at 60X magnification.

- Submitted by
- Invitrogen Antibodies (provider)
- Main image
- Experimental details
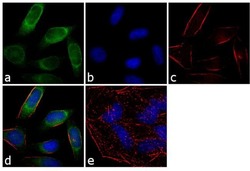
- Immunofluorescence analysis of RAB4A was performed using 70% confluent log phase HeLa cells. The cells were fixed with 4% paraformaldehyde for 10 minutes, permeabilized with 0.1% Triton™ X-100 for 10 minutes, and blocked with 1% BSA for 1 hour at room temperature. The cells were labeled with RAB4A Rabbit polyclonal Antibody (Product # PA3-912) at 1:250 dilution in 0.1% BSA and incubated for 3 hours at room temperature and then labeled with Goat anti-Rabbit IgG (H+L) Superclonal™ Secondary Antibody, Alexa Fluor® 488 conjugate (Product # A27034) at a dilution of 1:2000 for 45 minutes at room temperature (Panel a: green). Nuclei (Panel b: blue) were stained with SlowFade® Gold Antifade Mountant with DAPI (Product # S36938). F-actin (Panel c: red) was stained with Rhodamine Phalloidin (Product # R415, 1:300). Panel d represents the merged image showing cytoplasmic localization. Panel e shows the no primary antibody control. The images were captured at 60X magnification.

- Submitted by
- Invitrogen Antibodies (provider)
- Main image

- Experimental details
- Immunofluorescent analysis of RAB4 in MCF-7 Cells. Cells were grown on chamber slides and fixed with formaldehyde prior to staining. Cells were probed without (control) or with a RAB4 polyclonal antibody (Product # PA3-912) at a dilution of 1:20 overnight at 4 C, washed with PBS and incubated with a DyLight-488 conjugated secondary antibody (Product # 35552). RAB4 staining (green), F-Actin staining with Phalloidin (red) and nuclei with DAPI (blue) is shown. Images were taken at 60X magnification.
- Submitted by
- Invitrogen Antibodies (provider)
- Main image
- Experimental details
- Immunofluorescent analysis of RAB4 in NIH-3T3 Cells. Cells were grown on chamber slides and fixed with formaldehyde prior to staining. Cells were probed without (control) or with a RAB4 polyclonal antibody (Product # PA3-912) at a dilution of 1:20 overnight at 4 C, washed with PBS and incubated with a DyLight-488 conjugated secondary antibody (Product # 35552). RAB4 staining (green), F-Actin staining with Phalloidin (red) and nuclei with DAPI (blue) is shown. Images were taken at 60X magnification.

- Submitted by
- Invitrogen Antibodies (provider)
- Main image

- Experimental details
- Immunofluorescence analysis of RAB4A was performed using 70% confluent log phase HeLa cells. The cells were fixed with 4% paraformaldehyde for 10 minutes, permeabilized with 0.1% Triton™ X-100 for 10 minutes, and blocked with 1% BSA for 1 hour at room temperature. The cells were labeled with RAB4A Rabbit polyclonal Antibody (Product # PA3-912) at 1:250 dilution in 0.1% BSA and incubated for 3 hours at room temperature and then labeled with Goat anti-Rabbit IgG (Heavy Chain) Superclonal™ Secondary Antibody, Alexa Fluor® 488 conjugate (Product # A27034) at a dilution of 1:2000 for 45 minutes at room temperature (Panel a: green). Nuclei (Panel b: blue) were stained with SlowFade® Gold Antifade Mountant with DAPI (Product # S36938). F-actin (Panel c: red) was stained with Rhodamine Phalloidin (Product # R415, 1:300). Panel d represents the merged image showing cytoplasmic localization. Panel e shows the no primary antibody control. The images were captured at 60X magnification.

Supportive validation
- Submitted by
- Invitrogen Antibodies (provider)
- Main image
- Experimental details
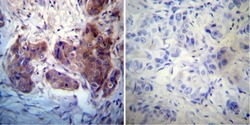
- Immunohistochemistry was performed on cancer biopsies of deparaffinized human Breast carcinoma tissue. To expose target proteins, heat induced antigen retrieval was performed using 10mM sodium citrate (pH6.0) buffer, microwaved for 8-15 minutes. Following antigen retrieval tissues were blocked in 3% BSA-PBS for 30 minutes at room temperature. Tissues were then probed at a dilution of 1:50 with a rabbit polyclonal antibody recognizing RAB4 (Product # PA3-912) or without primary antibody (negative control) overnight at 4°C in a humidified chamber. Tissues were washed extensively with PBST and endogenous peroxidase activity was quenched with a peroxidase suppressor. Detection was performed using a biotin-conjugated secondary antibody and SA-HRP, followed by colorimetric detection using DAB. Tissues were counterstained with hematoxylin and prepped for mounting.

- Submitted by
- Invitrogen Antibodies (provider)
- Main image
- Experimental details
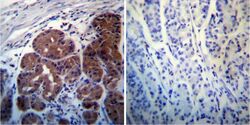
- Immunohistochemistry was performed on normal deparaffinized human Stomach tissue. To expose target proteins, heat induced antigen retrieval was performed using 10mM sodium citrate (pH6.0) buffer, microwaved for 8-15 minutes. Following antigen retrieval tissues were blocked in 3% BSA-PBS for 30 minutes at room temperature. Tissues were then probed at a dilution of 1:200 with a rabbit polyclonal antibody recognizing RAB4 (Product # PA3-912) or without primary antibody (negative control) overnight at 4°C in a humidified chamber. Tissues were washed extensively with PBST and endogenous peroxidase activity was quenched with a peroxidase suppressor. Detection was performed using a biotin-conjugated secondary antibody and SA-HRP, followed by colorimetric detection using DAB. Tissues were counterstained with hematoxylin and prepped for mounting.

Supportive validation
- Submitted by
- Invitrogen Antibodies (provider)
- Main image
- Experimental details
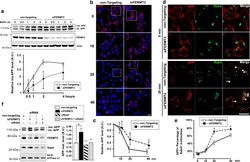
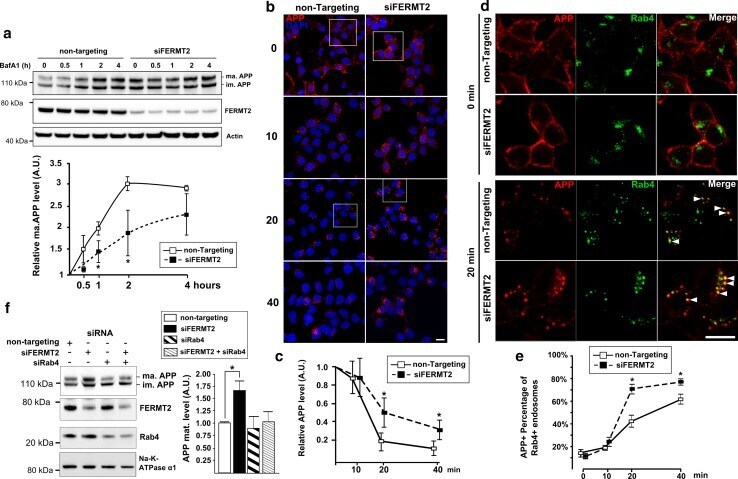
- Fig. 5 FERMT2 silencing inhibits APP degradation and promotes APP recycling at the plasma membrane. a HEK293-APP 695WT cells transiently transfected with siFERMT2 or non-targeting siRNA were treated with bafilomycin A1 (BafA1, 50 nM) for the indicated times. Cell extracts were then analyzed by WB. Densitometric analyses and mature APP levels for three independent experiments are shown. Graphs indicate the mean +- SD. * p < 0.05, non-parametric test. b The time course of APP endocytosis and degradation was indirectly visualized by internalization of 6E10 antibody. Cells were incubated with 6E10 antibody at 4 degC for 1 h. The temperature was then shifted to 37 degC, and cells were processed for immunofluorescence at the indicated times. Scale bar 10 um. c Relative fluorescence intensity from 6E10 staining, showing the time course of APP degradation. d A zoom-in (the square in b ) for the indicated times (0 and 20 min at 37 degC). Co-staining with anti-Rab4 antibody was used to visualize the APP within Rab4-positive endosomes involving in recycling. e Co-localization of 6E10 staining with Rab4 staining, as a guide to the APP level within recycling endosomes at the indicated times. f Cells transiently transfected with anti-FERMT2 in the presence or absence of siRab4. Extracts were analyzed by WB using anti-APP C-terminal, anti-FERMT2, anti-Rab4 or anti-actin antibodies
- Submitted by
- Invitrogen Antibodies (provider)
- Main image
- Experimental details
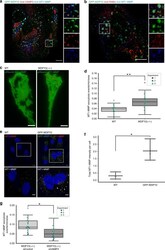
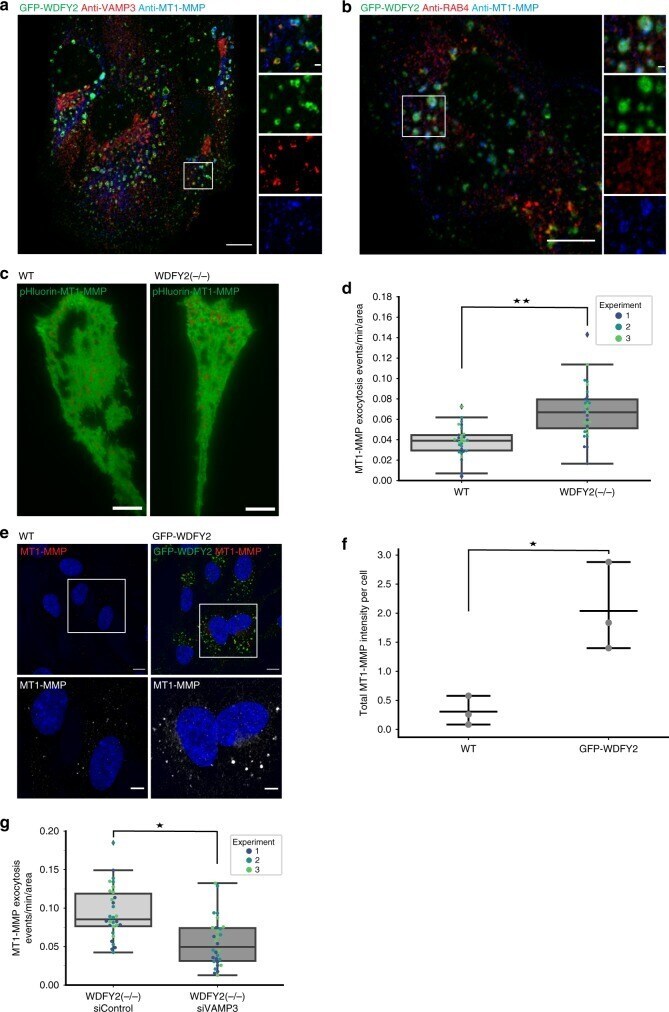
- Fig. 6 WDFY2 controls MT1-MMP trafficking. a Confocal images showing localization of MT1-MMP and VAMP3 to GFP-WDFY2-positive endosome. Representative image from 10 cells. Scale bar: 10 um, inset: 1 um. b Confocal images showing localization of MT1-MMP and RAB4 to GFP-WDFY2-positive endosome. Representative image from 10 cells. Scale bar: 10 um, inset: 1 um. c TIRF micrograph of WT and WDFY2(-/-) cells transfected with pHluorin-MT1-MMP. Individual exocytic events (summed over two minutes) are indicated with a red circle. Representative image from 30 observed cells per condition. Scale bar: 10 um, d Quantification of pHluorin-MT1-MMP exocytosis in WT and WDFY2(-/-) cells. Shown are events from three experiments, 10 cells per experiments per condition. Exocytosis events per minute are shown normalized to cell area. Student's unpaired t test, p = 0.0026. Shown are the median, quartiles (boxes), and 1.5 times the interquartile range (whiskers). * p < 0.05, ** p < 0.01, *** p < 0.001, n.s. not statistically significant. e Confocal micrographs of RPE1 (WT) and RPE1 cells stably expressing GFP-WDFY2. Cells overexpressing WDFY2 accumulates MT1-MMP in endosome positive for WDFY2. Scale bar: 10 um, insets: 5 um. f Quantification of MT1-MMP spots based on high-content microscopy show a significant increase in total intensity of MT1-MMP in hTERT-RPE1 GFP-WDFY2 cells when compared to hTERT-RPE1 parental cells. Shown are quantifications from three independent experiments, cells in total: hT
- Submitted by
- Invitrogen Antibodies (provider)
- Main image
- Experimental details
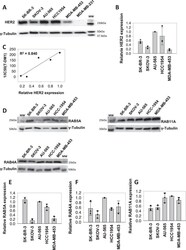
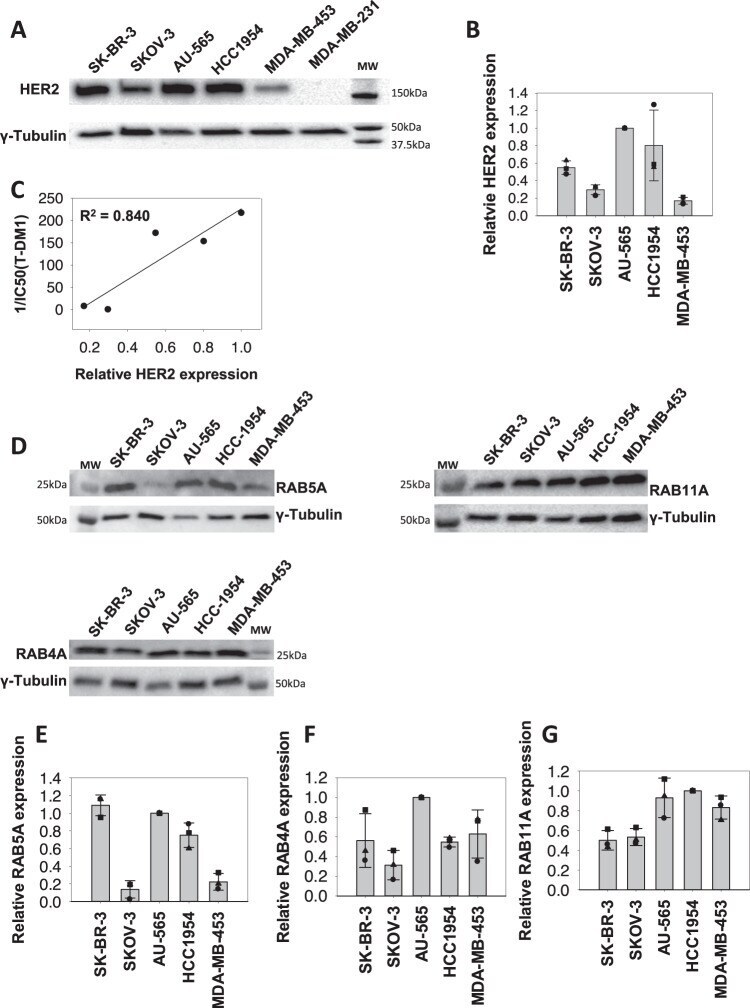
- Fig. 2 HER2 and RAB GTPase expression in cell lines. A Representative Western blot of HER2 and gamma-tubulin expression in SK-BR-3, SKOV-3, HCC1954, AU-565, MDA-MB-453, and MDA-MB-231 cells ( n = 3). B Quantification of the HER2 Western blots relative to those of gamma-tubulin. Data points represent the values of three independent experiments, the bars represent the average and the error bars represent the SD of the mean. C Linear regression analysis curve of HER2 protein expression and T-DM1 sensitivity (1/IC 50 (T-DM1)). D Representative western blot ( n = 3) of RAB4A, RAB5A, RAB11A, and gamma-tubulin expression in SK-BR-3, SKOV-3, AU-565, HCC1954, and MDA-MB-453 cells. E - G Quantification of the RAB4, RAB5, and RAB11 Western blots relative to those of gamma-tubulin. Data points represent the values of three independent experiments, the bars represent the average and the error bars represent the SD of the mean. Source data are provided as a Source Data file.
- Submitted by
- Invitrogen Antibodies (provider)
- Main image

- Experimental details
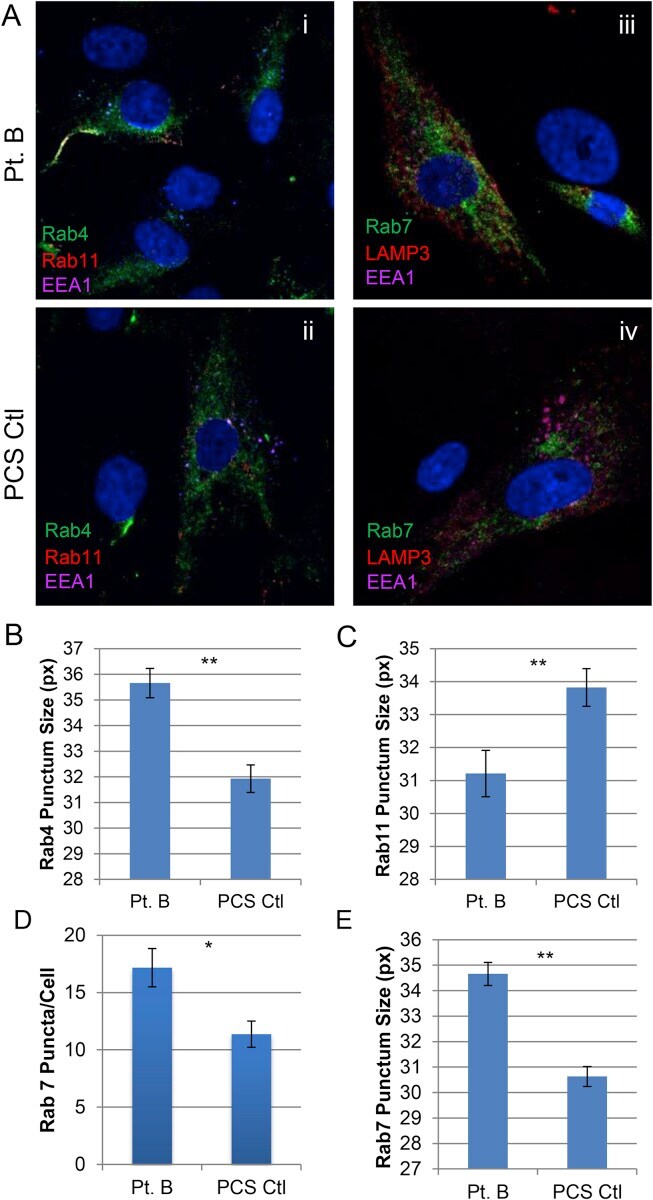
- Fig. 3 Endosomal trafficking and recycling pathways. Immunofluorescence staining for fast (Rab4, green) and slow (Rab11, red) endosome recycling components with early endosome marker EEA1 (magenta) in patient B (Pt. B) and control (PCS Ctl) cells (A i-ii) or lysosomal trafficking (Rab7, green) and lysosomal protein LAMP3 (red) with EEA1 (magenta) in Pt. B and PCS Ctl cells (A iii-iv). Quantification of punctum size (in pixels, px) for Rab4 fast recycling endosomes (p = 2.0E-6) (B) and Rab11 slow recycling endosomes (p = 0.004) (C) from steady state cells. Quantification of the Rab7 lysosome trafficking puncta count per cell (p = 0.0111) (D) and size in pixels (p = 1.74E-13) (E) also in steady state cells. Error bars represent SEM. ** = p < 0.01 * = p < 0.025. Fig. 3