Explore
 Validate
 Learn
Learn Western blot
 Immunocytochemistry
Antibody data
- Antibody Data
- Antigen structure
- References [12]
- Comments [0]
- Validations
- Immunocytochemistry [2]
- Immunoprecipitation [1]
- Other assay [15]
Submit
Validation data
Reference
Comment
Report error
- Product number
- 41-3200 - Provider product page

- Provider
- Invitrogen Antibodies
- Product name
- CEP170 Monoclonal Antibody (72-413-1)
- Antibody type
- Monoclonal
- Antigen
- Recombinant full-length protein
- Reactivity
- Human
- Host
- Mouse
- Isotype
- IgG
- Antibody clone number
- 72-413-1
- Vial size
- 100 μg
- Concentration
- 0.5 mg/mL
- Storage
- -20°C
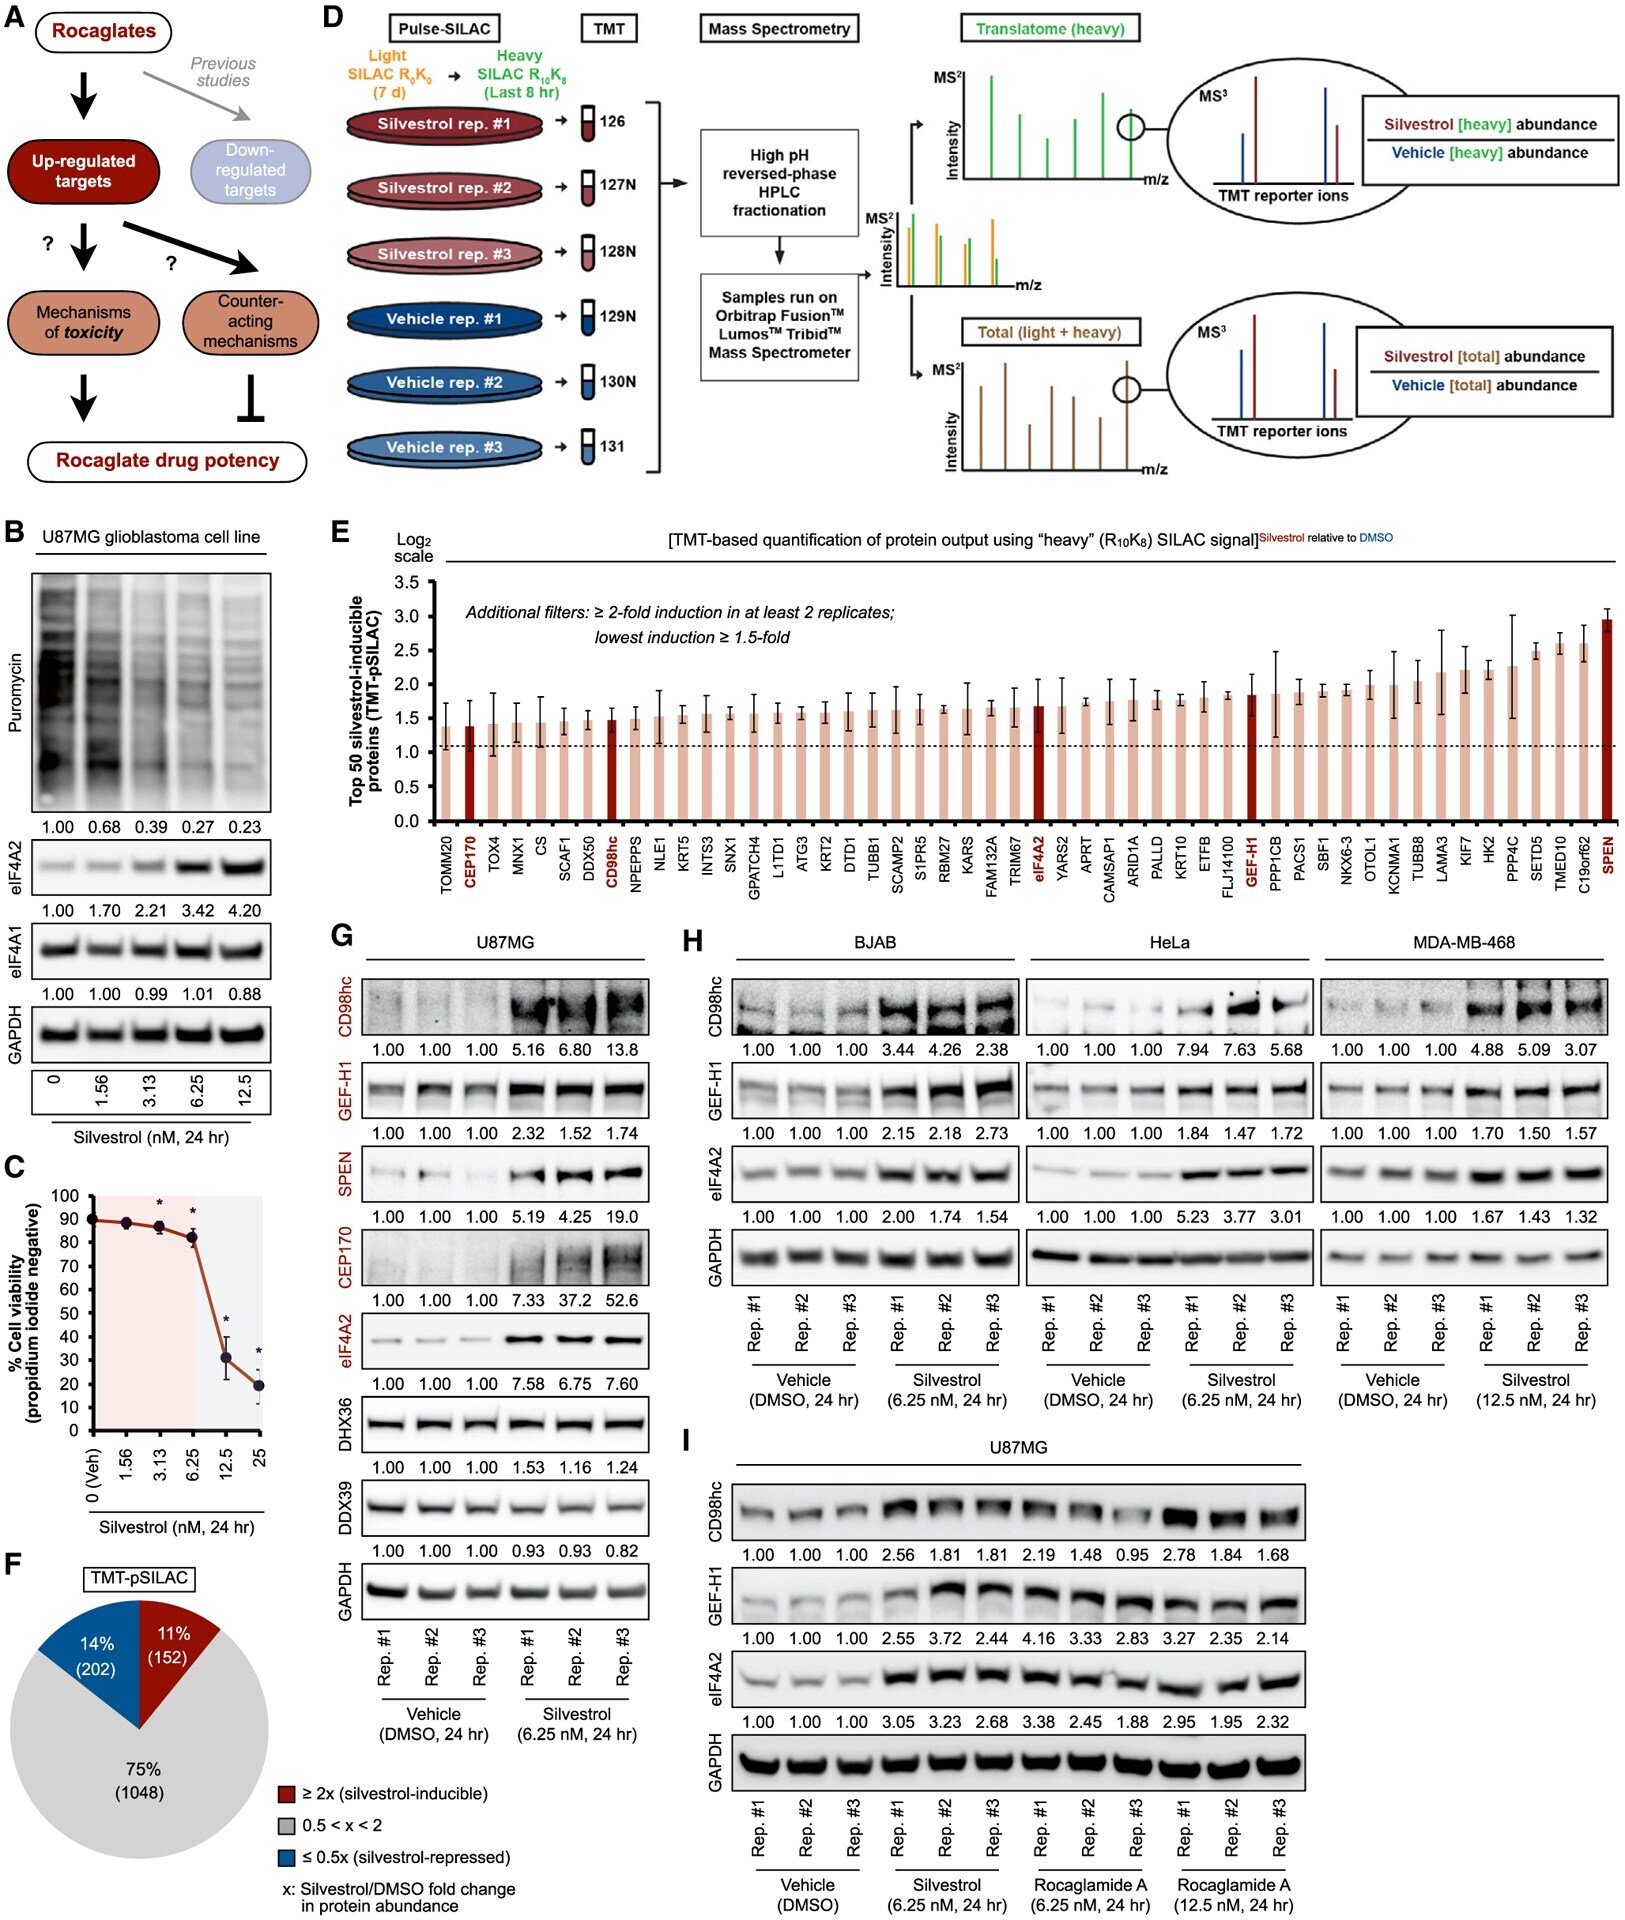
Submitted references Proteomics reveal cap-dependent translation inhibitors remodel the translation machinery and translatome.
Cep128 associates with Odf2 to form the subdistal appendage of the centriole.
Centriole Overduplication is the Predominant Mechanism Leading to Centrosome Amplification in Melanoma.
Nesprin-1α-Dependent Microtubule Nucleation from the Nuclear Envelope via Akap450 Is Necessary for Nuclear Positioning in Muscle Cells.
CDKL5 localizes at the centrosome and midbody and is required for faithful cell division.
The CEP19-RABL2 GTPase Complex Binds IFT-B to Initiate Intraflagellar Transport at the Ciliary Base.
STAR syndrome-associated CDK10/Cyclin M regulates actin network architecture and ciliogenesis.
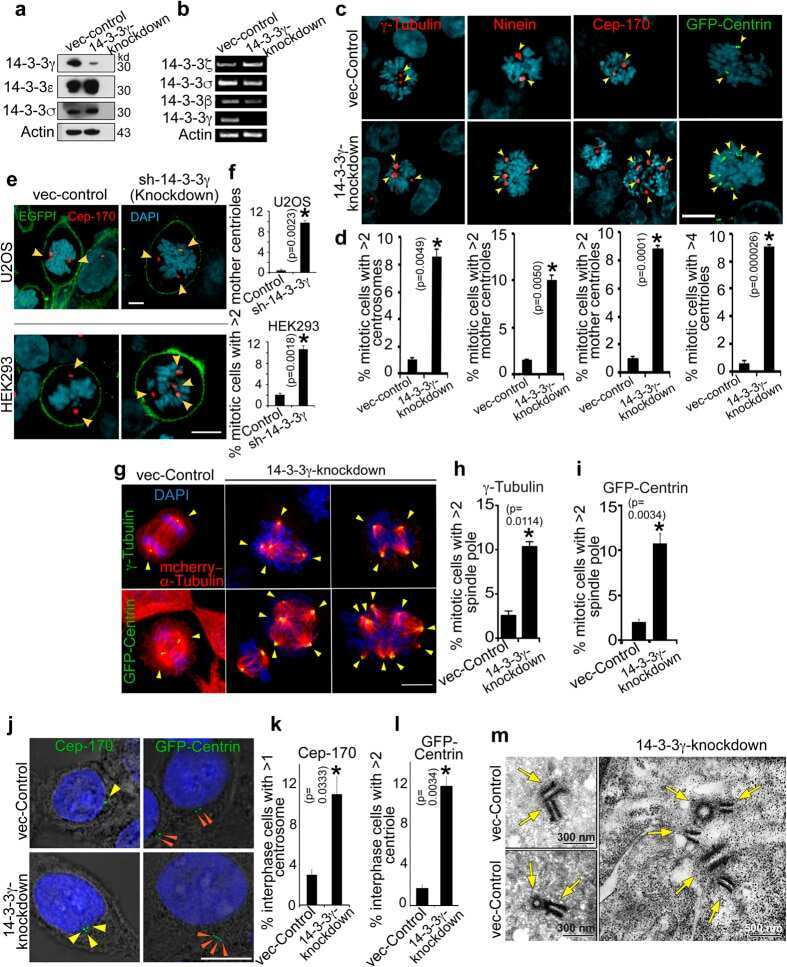
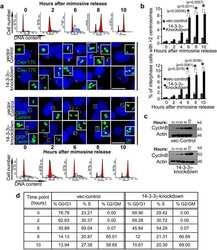
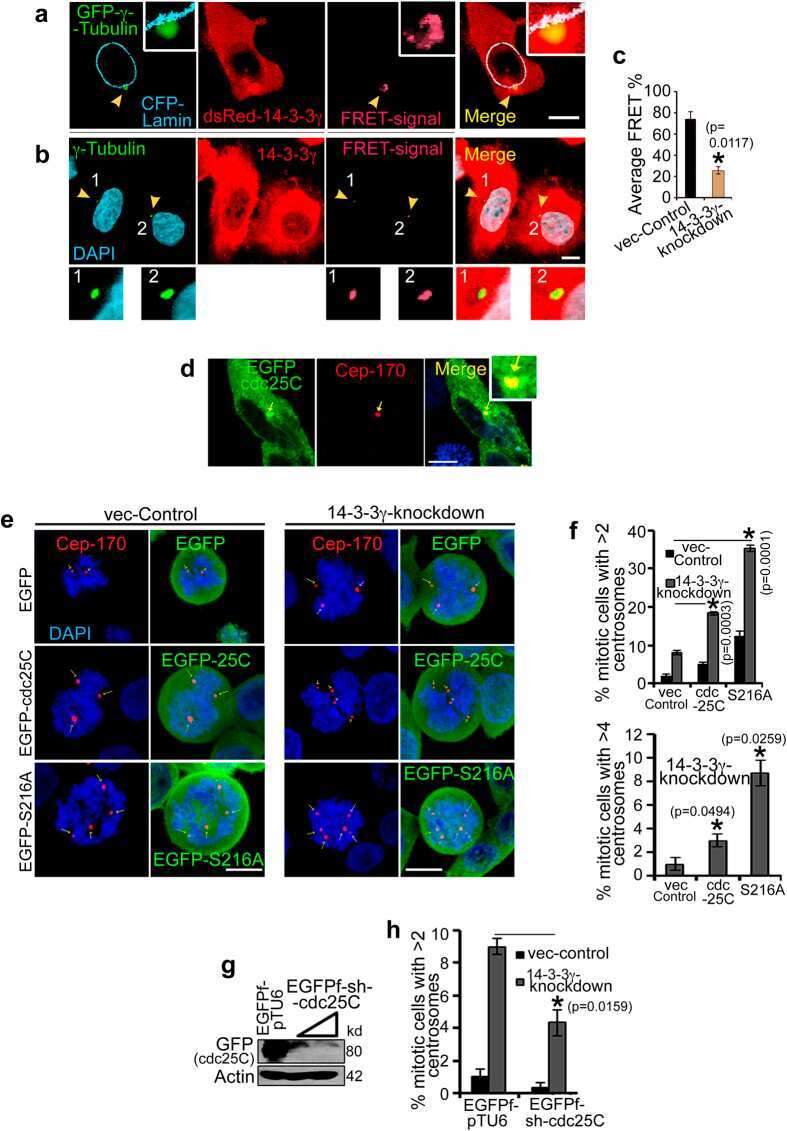
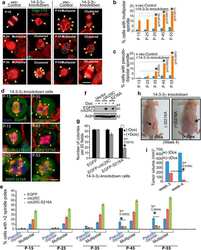
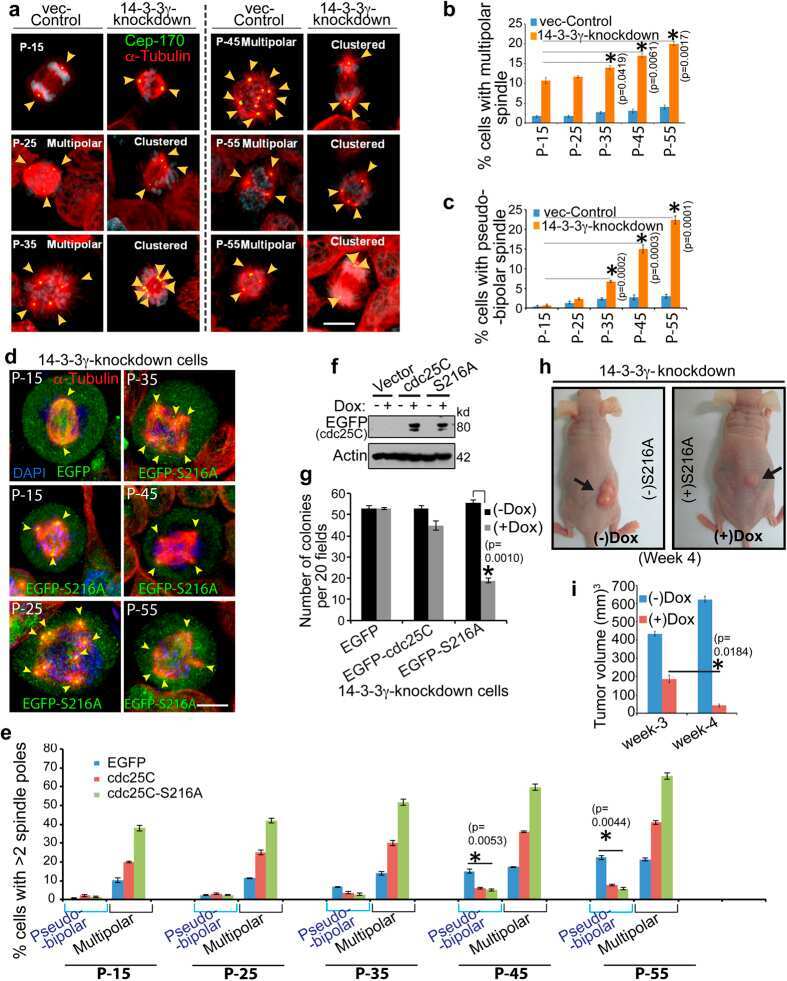
14-3-3γ Prevents Centrosome Amplification and Neoplastic Progression.
A Role for the Chaperone Complex BAG3-HSPB8 in Actin Dynamics, Spindle Orientation and Proper Chromosome Segregation during Mitosis.
Tank binding kinase 1 is a centrosome-associated kinase necessary for microtubule dynamics and mitosis.
Link between DNA damage and centriole disengagement/reduplication in untransformed human cells.
PACSIN proteins bind tubulin and promote microtubule assembly.
Ho JJD, Cunningham TA, Manara P, Coughlin CA, Arumov A, Roberts ER, Osteen A, Kumar P, Bilbao D, Krieger JR, Lee S, Schatz JH
Cell reports 2021 Oct 12;37(2):109806
Cell reports 2021 Oct 12;37(2):109806
Cep128 associates with Odf2 to form the subdistal appendage of the centriole.
Kashihara H, Chiba S, Kanno SI, Suzuki K, Yano T, Tsukita S
Genes to cells : devoted to molecular & cellular mechanisms 2019 Mar;24(3):231-243
Genes to cells : devoted to molecular & cellular mechanisms 2019 Mar;24(3):231-243
Centriole Overduplication is the Predominant Mechanism Leading to Centrosome Amplification in Melanoma.
Denu RA, Shabbir M, Nihal M, Singh CK, Longley BJ, Burkard ME, Ahmad N
Molecular cancer research : MCR 2018 Mar;16(3):517-527
Molecular cancer research : MCR 2018 Mar;16(3):517-527
Nesprin-1α-Dependent Microtubule Nucleation from the Nuclear Envelope via Akap450 Is Necessary for Nuclear Positioning in Muscle Cells.
Gimpel P, Lee YL, Sobota RM, Calvi A, Koullourou V, Patel R, Mamchaoui K, Nédélec F, Shackleton S, Schmoranzer J, Burke B, Cadot B, Gomes ER
Current biology : CB 2017 Oct 9;27(19):2999-3009.e9
Current biology : CB 2017 Oct 9;27(19):2999-3009.e9
CDKL5 localizes at the centrosome and midbody and is required for faithful cell division.
Barbiero I, Valente D, Chandola C, Magi F, Bergo A, Monteonofrio L, Tramarin M, Fazzari M, Soddu S, Landsberger N, Rinaldo C, Kilstrup-Nielsen C
Scientific reports 2017 Jul 24;7(1):6228
Scientific reports 2017 Jul 24;7(1):6228
The CEP19-RABL2 GTPase Complex Binds IFT-B to Initiate Intraflagellar Transport at the Ciliary Base.
Kanie T, Abbott KL, Mooney NA, Plowey ED, Demeter J, Jackson PK
Developmental cell 2017 Jul 10;42(1):22-36.e12
Developmental cell 2017 Jul 10;42(1):22-36.e12
STAR syndrome-associated CDK10/Cyclin M regulates actin network architecture and ciliogenesis.
Guen VJ, Gamble C, Perez DE, Bourassa S, Zappel H, Gärtner J, Lees JA, Colas P
Cell cycle (Georgetown, Tex.) 2016;15(5):678-88
Cell cycle (Georgetown, Tex.) 2016;15(5):678-88
14-3-3γ Prevents Centrosome Amplification and Neoplastic Progression.
Mukhopadhyay A, Sehgal L, Bose A, Gulvady A, Senapati P, Thorat R, Basu S, Bhatt K, Hosing AS, Balyan R, Borde L, Kundu TK, Dalal SN
Scientific reports 2016 Jun 2;6:26580
Scientific reports 2016 Jun 2;6:26580
A Role for the Chaperone Complex BAG3-HSPB8 in Actin Dynamics, Spindle Orientation and Proper Chromosome Segregation during Mitosis.
Fuchs M, Luthold C, Guilbert SM, Varlet AA, Lambert H, Jetté A, Elowe S, Landry J, Lavoie JN
PLoS genetics 2015 Oct;11(10):e1005582
PLoS genetics 2015 Oct;11(10):e1005582
Tank binding kinase 1 is a centrosome-associated kinase necessary for microtubule dynamics and mitosis.
Pillai S, Nguyen J, Johnson J, Haura E, Coppola D, Chellappan S
Nature communications 2015 Dec 10;6:10072
Nature communications 2015 Dec 10;6:10072
Link between DNA damage and centriole disengagement/reduplication in untransformed human cells.
Douthwright S, Sluder G
Journal of cellular physiology 2014 Oct;229(10):1427-36
Journal of cellular physiology 2014 Oct;229(10):1427-36
PACSIN proteins bind tubulin and promote microtubule assembly.
Grimm-Günter EM, Milbrandt M, Merkl B, Paulsson M, Plomann M
Experimental cell research 2008 Jun 10;314(10):1991-2003
Experimental cell research 2008 Jun 10;314(10):1991-2003
No comments: Submit comment
Supportive validation
- Submitted by
- Invitrogen Antibodies (provider)
- Main image
- Experimental details
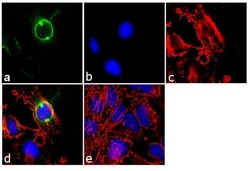
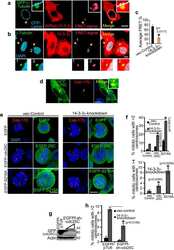
- Immunofluorescence analysis of CEP170 was performed using 70% confluent log phase HeLa cells. The cells were fixed with 4% paraformaldehyde for 10 minutes, permeabilized with 0.1% Triton™ X-100 for 10 minutes, and blocked with 1% BSA for 1 hour at room temperature. The cells were labeled with CEP170 (72-413-1) Mouse Monoclonal Antibody (Product # 41-3200) at 2µg/mL in 0.1% BSA and incubated for 3 hours at room temperature and then labeled with Goat anti-Mouse IgG (H+L) Superclonal™ Secondary Antibody, Alexa Fluor® 488 conjµgate (Product # A28175) at a dilution of 1:2000 for 45 minutes at room temperature (Panel a: green). Nuclei (Panel b: blue) were stained with SlowFade® Gold Antifade Mountant with DAPI (Product # S36938). F-actin (Panel c: red) was stained with Alexa Fluor® 555 Rhodamine Phalloidin (Product # R415, 1:300). Panel d represents the merged image showing cytoplasmic localization. Panel e shows the no primary antibody control. The images were captured at 60X magnification.

- Submitted by
- Invitrogen Antibodies (provider)
- Main image

- Experimental details
- Immunofluorescence analysis of CEP170 was performed using 70% confluent log phase HeLa cells. The cells were fixed with 4% paraformaldehyde for 10 minutes, permeabilized with 0.1% Triton™ X-100 for 10 minutes, and blocked with 1% BSA for 1 hour at room temperature. The cells were labeled with CEP170 (72-413-1) Mouse Monoclonal Antibody (Product # 41-3200) at 2µg/mL in 0.1% BSA and incubated for 3 hours at room temperature and then labeled with Goat anti-Mouse IgG (H+L) Superclonal™ Secondary Antibody, Alexa Fluor® 488 conjµgate (Product # A28175) at a dilution of 1:2000 for 45 minutes at room temperature (Panel a: green). Nuclei (Panel b: blue) were stained with SlowFade® Gold Antifade Mountant with DAPI (Product # S36938). F-actin (Panel c: red) was stained with Alexa Fluor® 555 Rhodamine Phalloidin (Product # R415, 1:300). Panel d represents the merged image showing cytoplasmic localization. Panel e shows the no primary antibody control. The images were captured at 60X magnification.

Supportive validation
- Submitted by
- Invitrogen Antibodies (provider)
- Main image
- Experimental details
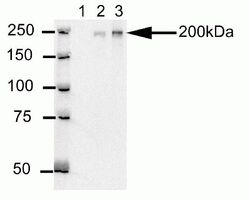
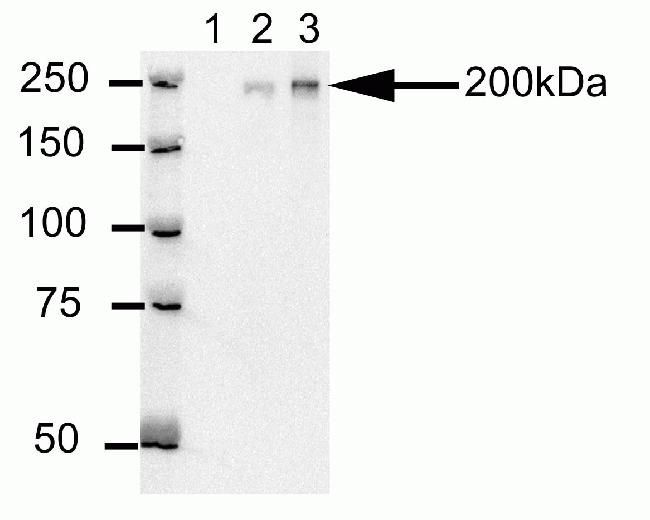
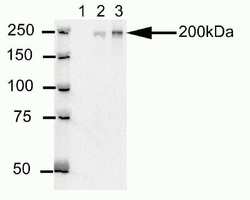
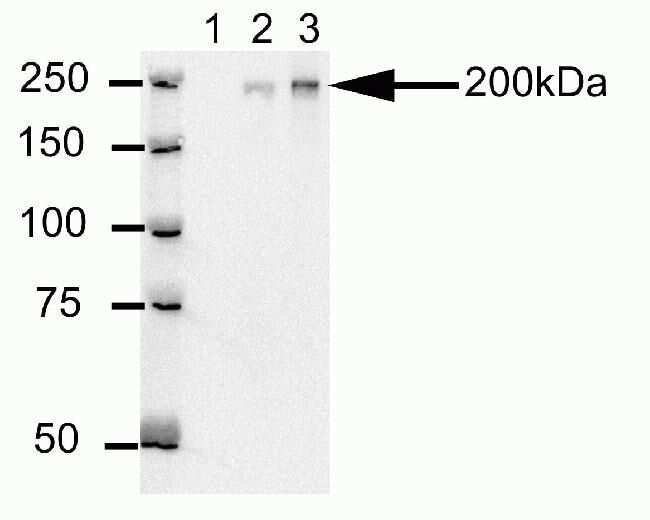
- Western blot analysis of U20S cell lysates after immunoprecipitation (IP) using mouse anti-Cep170 antibody (Product # 41-3200). Lane 1: Sample IP carried using non-Cep170 antibody. Lane 2: Sample IP carried using hybridoma cell culture supernatant containing Cep170 antibody. Lane 3: Sample IP carried using purified Cep170 antibody.
Supportive validation
- Submitted by
- Invitrogen Antibodies (provider)
- Main image
- Experimental details
- Western blot analysis of U20S cell lysates after immunoprecipitation (IP) using mouse anti-Cep170 antibody (Product # 41-3200). Lane 1: Sample IP carried using non-Cep170 antibody. Lane 2: Sample IP carried using hybridoma cell culture supernatant containing Cep170 antibody. Lane 3: Sample IP carried using purified Cep170 antibody.
- Submitted by
- Invitrogen Antibodies (provider)
- Main image
- Experimental details
- NULL
- Submitted by
- Invitrogen Antibodies (provider)
- Main image
- Experimental details
- NULL
- Submitted by
- Invitrogen Antibodies (provider)
- Main image
- Experimental details
- NULL
- Submitted by
- Invitrogen Antibodies (provider)
- Main image
- Experimental details
- NULL
- Submitted by
- Invitrogen Antibodies (provider)
- Main image
- Experimental details
- NULL
- Submitted by
- Invitrogen Antibodies (provider)
- Main image
- Experimental details
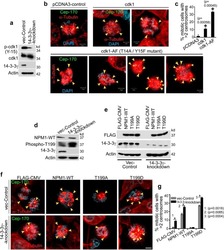
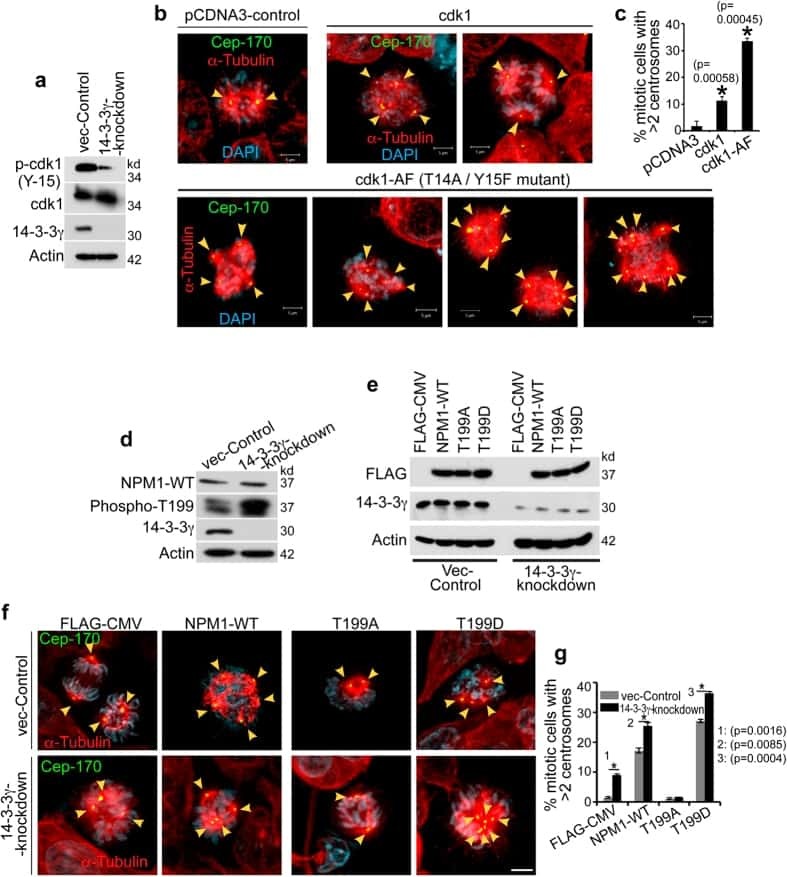
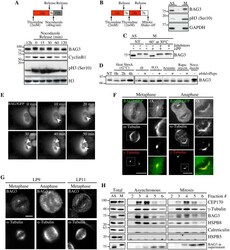
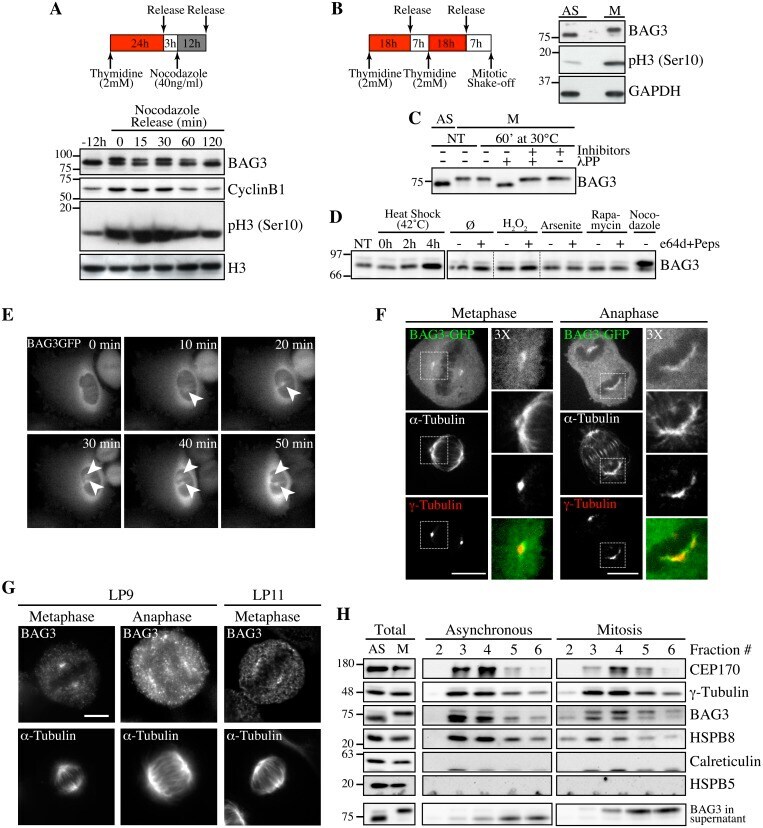
- Fig 1 Hyperphosphorylation and centrosomal localization of BAG3 in mitotic cells. (A) HeLa cells were harvested at different times during release from a Thymidine/nocodazole block (time 0). Cell lysates were immunoblotted with the indicated antibodies. (B) Mitotic HeLa-GFP-H2B cells synchronized by the double Thymidine block method and recovered by mitotic shake off were lysed and processed for immunoblotting for BAG3, phospho-histone H3 (p-H3) and GAPDH as loading control; AS, asynchronous; M, mitotic. (C) BAG3 immunoprecipitates (IPs) were prepared from asynchronous HeLa cells (AS) or from HeLa cells arrested in mitosis by incubation with nocodazole for 16 h (M, 400 ng/ml). BAG3 IPs were left untreated (NT) or incubated at 30degC in the presence of phosphatase (lPP) with (+) or without (-) phosphatase inhibitors for 60 min and were analyzed by Western blot. (D) Western blot of 293T cell lysates that have been treated as followed: heat shock at 42degC for the indicated times; H 2 O 2 (500 mM, 4 h); arsenite (200 mM, 4 h); rapamycin (200 nM, 4 h); nocodazole (400 ng/ml, 16 h), with (+) or without (-) inhibitors of lysosomal proteases (E64d, 10 mug/ml; pepstatin, 10 mug/ml). (E) HeLa-BAG3-GFP cells were imaged by time-lapse fluorescence microscopy; arrowheads designate the centrosomes and surrounding perinuclear material. (F) Confocal images of mitotic HeLa-BAG3-GFP cells synchronized by a 24 h-Thymidine block and released in fresh medium for 8 h, showing staining of a-tubulin
- Submitted by
- Invitrogen Antibodies (provider)
- Main image
- Experimental details
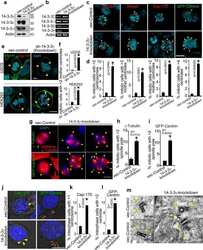
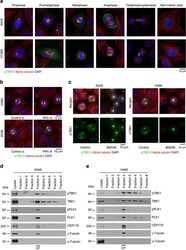
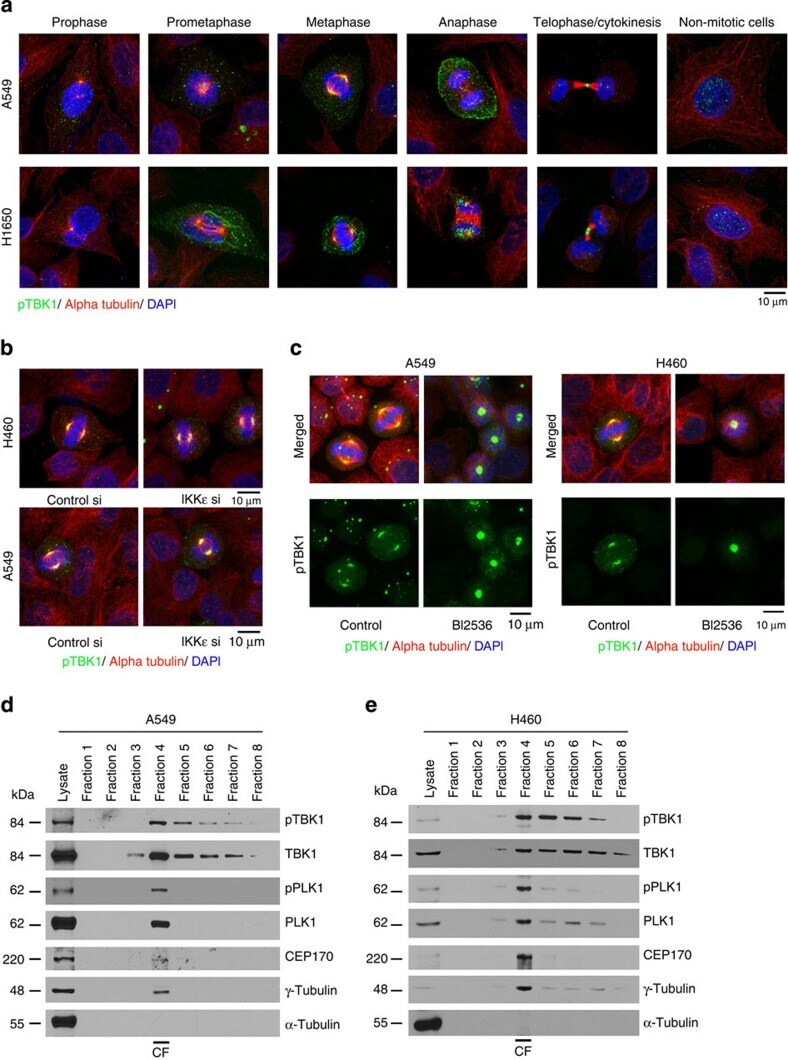
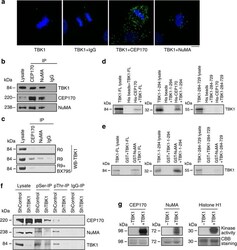
- Figure 1 Phospho-S172 TBK1 localizes to centrosomes and mitotic spindles. ( a ) Confocal microscopy images of A549, H1650 and H460 cells progressing through different mitotic stages. Cells were stained for phospho-TBK1 (green), alpha tubulin (red) and DNA (DAPI, Blue). Scale bar, 10 mum. ( b ) Confocal microscopy images from H460 and A549 cells stained for phospho-TBK1 (green), alpha tubulin (red) and DNA (DAPI, Blue) after depleting IKKe using siRNAs ( c ) PLK1 using the inhibitor BI2536 in H460 and A549 cells. A non-targeting control siRNA was used as control. Depletion of IKKe or inhibition of PLK1 does not affect the localization of pTBK1 and alpha tubulin. ( d , e ) Western blots for pTBK1, TBK1, pPLK1, PLK1, CEP170, gamma-tubulin and alpha tubulin from different fractions collected during centrosome isolation from H460 and A549 cells. pTBK1 and TBK1 are enriched in the centrosomal fraction (Fraction-4). Purity of the centrosomal fraction is indicated by high levels of gamma-Tubulin in Fraction-4. CF indicates the centrosomal fraction. Lysate lane represents whole cell lysate prepared from asynchronously growing H460 or A549 cells. Experiments were repeated three times and representative images are presented.
- Submitted by
- Invitrogen Antibodies (provider)
- Main image
- Experimental details
- Figure 5 TBK1 directly binds to and phosphorylates CEP170 and NuMA. ( a ) Detection of co-localization of TBK1 and CEP170 as well as TBK1 and NuMA using proximity ligation assay (PLA). Green fluorescent foci represent co-localization of TBK1 and CEP170 or TBK1 and NuMA. TBK1 antibody alone or TBK1 antibody along with IgG were used as negative controls. ( b ) Immunoprecipitation-western blot analysis showing the interaction of endogenous TBK1 with endogenous CEP170 and NuMA in lysates of asynchronously growing H1650 cells. ( c ) Immunoprecipitation-western blot analysis of H460 cell lysates showing the binding of TBK1 with NuMA and CEP170 when released from G1/S block. This interaction was inhibited when cells were released from double-thymidine block in the presence of BX795. ( d , e ) In vitro binding of full-length TBK1, the kinase domain of TBK1 (1-294) or the TBK1 C terminus (TBK1-284-729) with CEP170 ( d ) or NuMA ( e ). The data presented are representative of three independent experiments. Lysate/ input lane represents 20% of the input 35 S-methionine-labelled TBK1 used in the pull-down assay. ( f ) Immunoprecipitation-western blot analysis showing inhibition in serine and threonine phosphorylation of CEP170 and NuMA when TBK1 was depleted following transduction of cells with lentivirus expressing shRNA targeting TBK1. ( g ) In vitro kinase assays showing the phosphorylation of NuMA and CEP170 by TBK1. Coomassie brilliant blue (CBB) staining shows the amount of protein

- Submitted by
- Invitrogen Antibodies (provider)
- Main image
- Experimental details
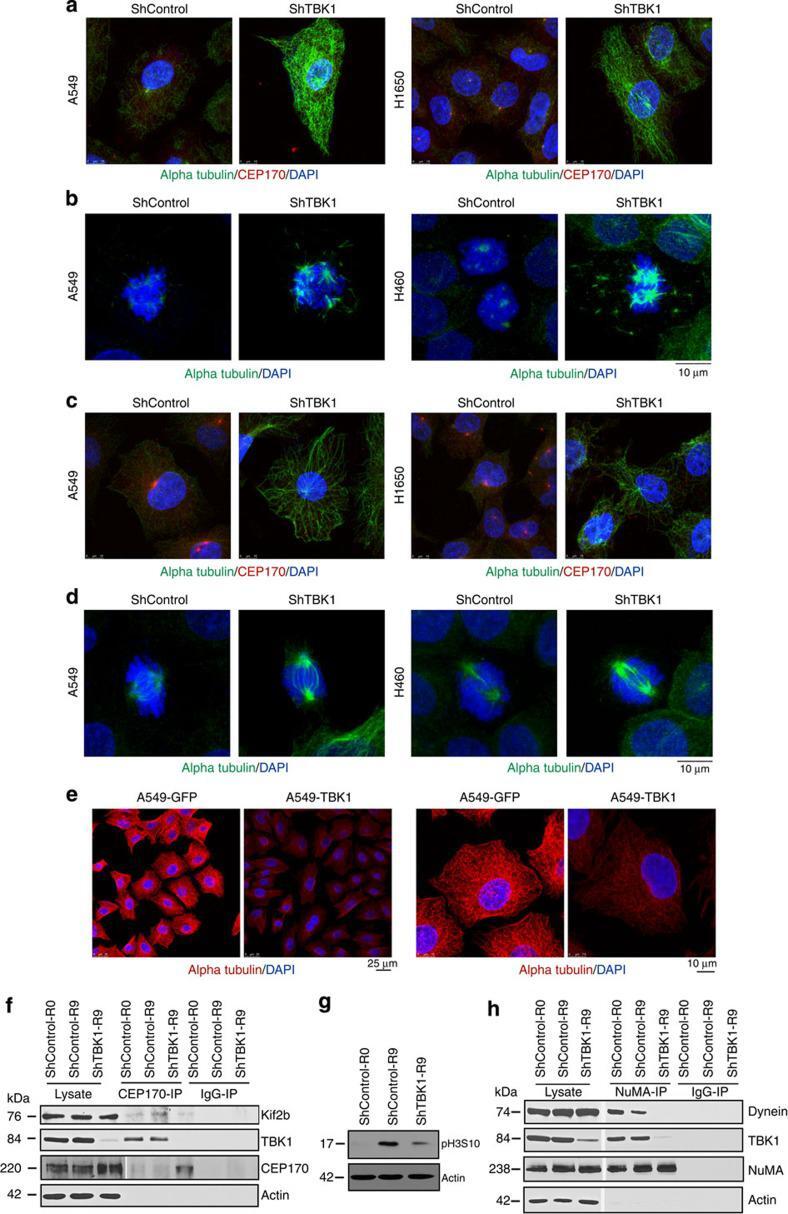
- Figure 6 TBK1 depletion alters microtubule dynamics. ( a ) Shcontrol A549 or H1650 cells treated with 0.1 muM nocodazole for 15 min showed complete disruption of microtubules, while TBK1-depleted shTBK1 A549 or H1650 cells retained stable microtubules as seen by staining for alpha tubulin (green) and CEP170 (red). ( b ) Mitotic spindles in TBK1-depleted A549 and H460 cells were more stable after nocodazole treatment as compared to control cells. Alpha tubulin (green) shows mitotic spindles. ( c ) shTBK1 A549 or H1650 cells when subjected to cold temperature (4 degC) and subsequent incubation at warm temperature (37 degC) had stable microtubules versus analogously treated shcontrol A549 or H1650 cells. Alpha Tubulin (green), CEP170 (red) and DNA (DAPI, Blue). ( d ) Similar results were observed in mitotic cells where mitotic spindles of TBK1-depleted A549 or H460 cells were more stable compared to control shRNA-treated cells. Alpha tubulin (green). ( e ) Stability of microtubules were drastically reduced in A549 cells overexpressing TBK1 when treated with 5 muM nocodazole and allowed to regrow for 7 min; Scale bar, 10 mum for e . ( f ) Low magnification images of cells in c . Scale bar, 25 mum. ( g - i ) TBK1 is required for the binding of CEP170 with Kif2b ( g ) as well as for the association of NuMA with dynein ( i ), as seen by immunoprecipitation-western blot analysis. ( h ) Western blot for pH3S10 to confirm mitotic fractions.
- Submitted by
- Invitrogen Antibodies (provider)
- Main image
- Experimental details
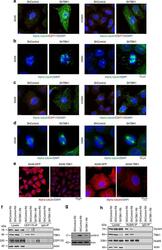
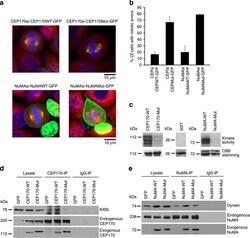
- Figure 8 Phosphorylation site mutants of CEP170 and NuMA induce mitotic defects. ( a ) HeLa cells were transfected with CEP170 or NuMA siRNA to deplete the endogenous levels of these proteins and subsequently transfected with GFP-tagged wild-type or mutant constructs of CEP170 or NuMA. Cells were fixed and subsequently stained for Alpha tubulin (red). Mutant CEP170 or mutant NuMA transfected cells showed mitotic defects compared to wild-type CEP170 or NuMA transfected cells. ( b ) Quantification of cells with mitotic defects. Graphs represent average of two experiments. Error bars represent s.d. ( c ) Kinase assay with wild-type or mutant GST tagged CEP170 or NuMA as substrates. Images shown are representative of three independent experiments. ( d ) Immunoprecipitation-western blot analysis demonstrating the binding of Kif2b and wild-type or mutant CEP170 ( e ) Immunoprecipitation-western blot analysis demonstrating the binding of dynein and wild type or mutant NuMA.

- Submitted by
- Invitrogen Antibodies (provider)
- Main image
- Experimental details
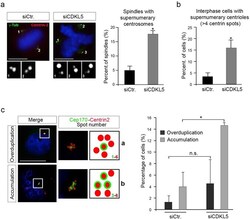
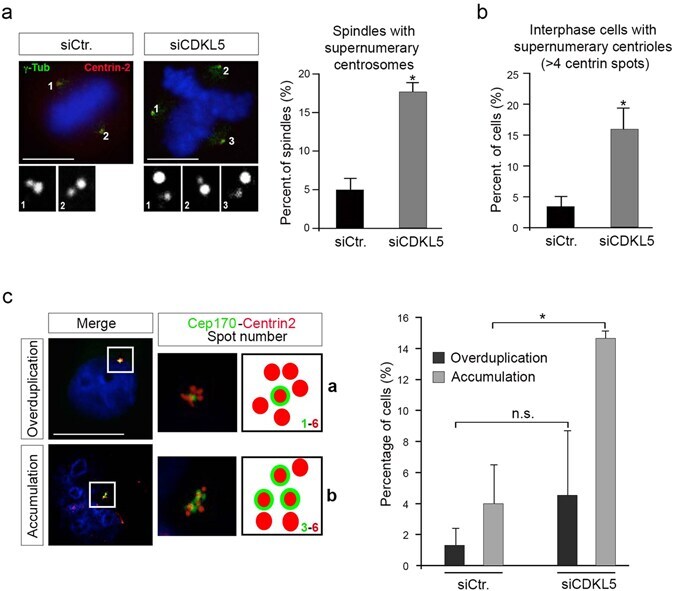
- Figure 5 Spindle multipolarity in CDKL5 depleted cells is due to centrosome accumulation. ( a - c ) HeLa cells were silenced as in Fig. 4a and analyzed by IF 60 h after transfection. In ( a ) cells were stained with Abs anti-gamma-tubulin and anti-centrin-2 to mark the spindle poles and the centrioles, respectively. DAPI staining (blue) was used to visualize DNA. The insets below show the magnified centrin-2 signal in the correspondingly numbered poles. The percentage of spindles with supernumerary centrosomes is reported to the right as mean +- S.E.M. (n = 2; *p < 0.05; unpaired t-test; approximately 70 spindles were analyzed per condition). In ( b ) cells were immunostained with centrin-2 and the percentage of interphase cells with more than 4 centrioles was reported as mean +- S.E.M. (n = 3; *p < 0.05; unpaired t-test; approximately 100 cells were analyzed per condition). In c cells were stained with anti-cep170 (green) and anti-centrin-2 (red) Abs. DAPI staining (blue) was used to visualize DNA. Representative images of different siCDKL5 phenotypes are shown on the left. The percentage of cells with the indicated phenotypes is reported to the right as mean +- S.E.M (n = 2; *p < 0.05; unpaired t-test; approximately 200 cells were analyzed per condition). n.s. = not significant. Scale bar, 10 um.
- Submitted by
- Invitrogen Antibodies (provider)
- Main image
- Experimental details
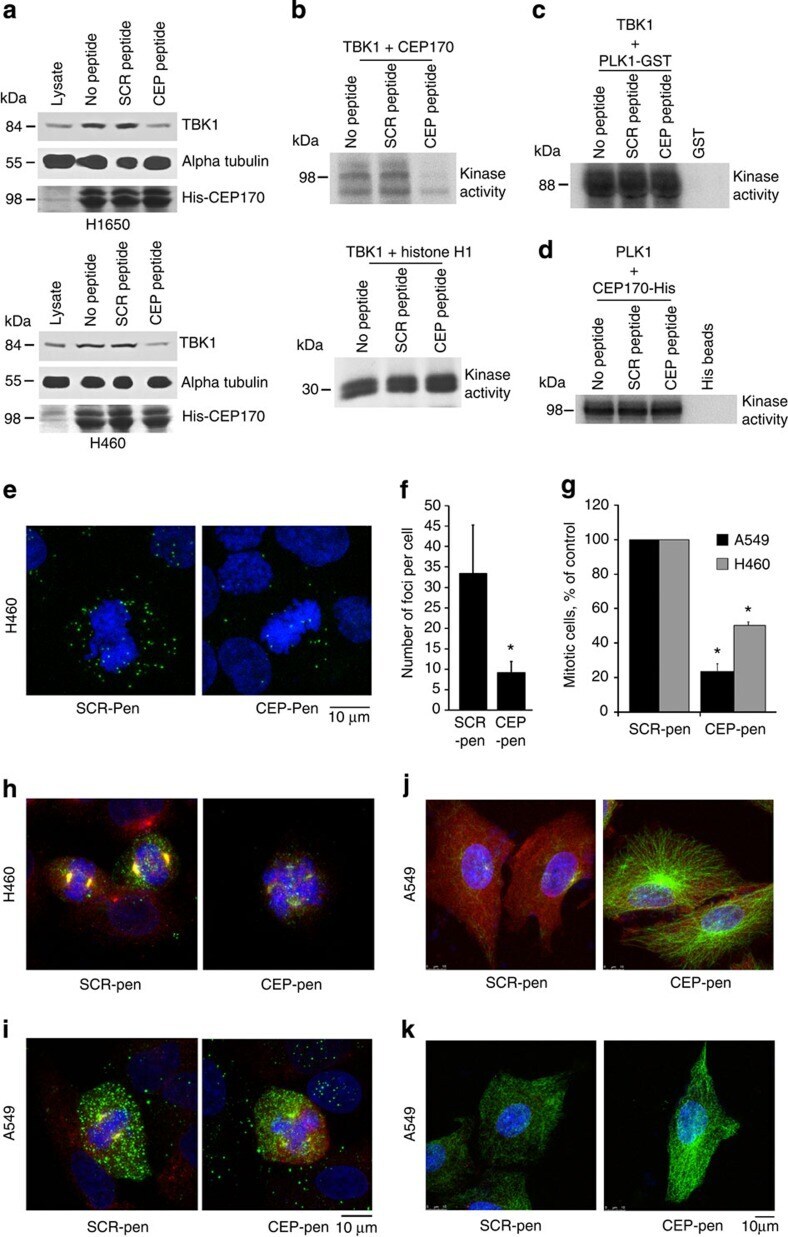
- Figure 7 CEP peptide disrupts binding of CEP170 and TBK1 and provokes mitotic defects. ( a ) H460 or H1650 cell lysates were incubated with 5 muM CEP or scrambled peptide along with His-tagged CEP170 beads. Western blotting shows that binding of TBK1 to CEP170 was specifically disrupted by the CEP peptide, but binding of His-CEP170 to alpha tubulin was not. ( b ) Scrambled or CEP peptides (1 muM) were preincubated with TBK1 for 15 min and used in a kinase reaction with His6-CEP170 as a substrate. In vitro kinase assay showed that the CEP170 peptide effectively inhibits His-CEP170 phosphorylation by TBK1 but not the phosphorylation of Histone H1. ( c ) In vitro kinase assays showing that CEP-peptide specifically inhibits TBK1-mediated phosphorylation of CEP170 but not PLK1, where a kinase dead PLK1 was used as substrate. ( d ) PLK1-mediated phosphorylation of CEP170 is not affected by CEP170-peptide in kinase assays; His6-tagged CEP170 was used as a substrate. ( e ) CEP170 peptide conjugated to penetratin (CEP-Pen) inhibited the CEP170-TBK1 interaction in H460 cells but a scrambled peptide-penetratin conjugate did not, as seen by a proximity ligation assay. Green signal indicate points of co-localization between TBK1 and CEP170. Scale bar, 10 mum. ( f ) Quantification of signal from cells treated with peptides (*= P
- Submitted by
- Invitrogen Antibodies (provider)
- Main image
- Experimental details
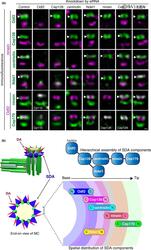
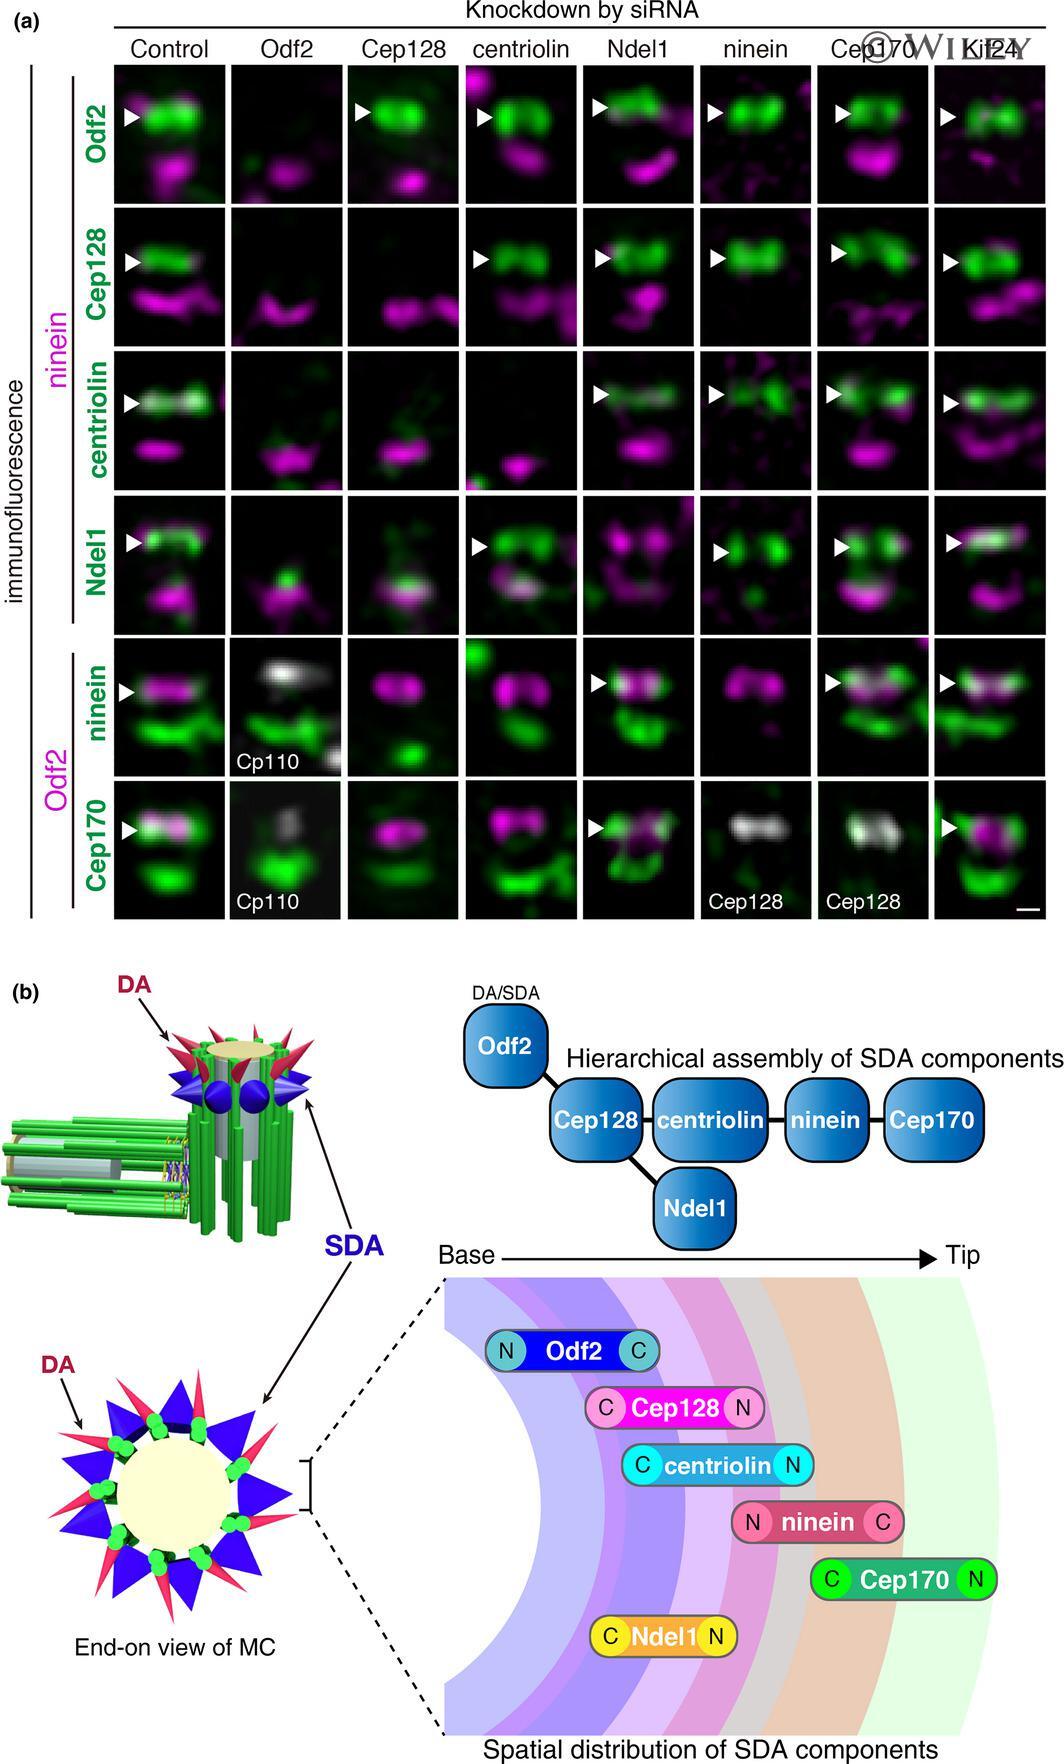
- Hierarchical analyses of Cep128 in relation to Odf2 and other SDA components. (a) Hierarchical analyses of SDA components. Representative SR-SIM fluorescence images of SDA proteins (Odf2, Cep128, centriolin, Ndel1, ninein and Cep170) in RPE1 cells treated with the indicated siRNAs. Immunofluorescence images for each SDA protein (green) costained with ninein (magenta), Odf2 (magenta), CP110 (gray) or Cep128 (gray). Side views of MCs. Note that each siRNA efficiently decreased the expression level of its corresponding gene product. The siRNA specific for Kif24, a protein belonging to the Kif13 family and known to be a centriolar distal-end protein, was used as a negative control. Arrowheads indicate the SDAs. Scale bar: 100 nm. (b) Schematic drawing showing the hierarchical assembly and the spatial distribution of SDA components
- Submitted by
- Invitrogen Antibodies (provider)
- Main image
- Experimental details
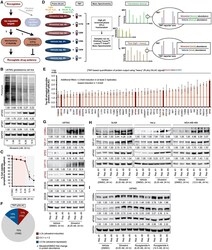
- Figure 1. TMT-pSILAC reveals rocaglate-dependent translatome remodeling (A) Schematic of this study's focus on rocaglate-inducible proteins and the functional significance. (B) Representative immunoblots of U87MG treated with indicated concentrations of silvestrol for 24 h. Samples were loaded based on equal cell number. Densitometry values (mean of three independent experiments) are normalized to loading control. 0 nM, vehicle (DMSO). (C) Percent cell viability based on propidium iodide exclusion in U87MG treated with indicated concentrations of silvestrol for 24 h. Data represent mean +- SEM (error bars) of three independent experiments. *p < 0.05 compared to vehicle. Pink-shaded area highlights concentrations at which cell viability was largely maintained (>80%). (D) TMT-pSILAC workflow to identify silvestrol-induced (6.25 nM, 24 h) changes in protein output. (E) Top 50 silvestrol-inducible proteins identified by TMT-pSILAC. The following criteria were applied: >=2-fold induction in at least two replicates, with a minimum induction of >=1.5-fold. Data represent mean +- SEM (error bars) of three independent experiments. Targets validated by immunoblot are highlighted in red. (F) Silvestrol-induced remodeling of global protein output. (G and H) Representative immunoblots of (G) U87MG and (H) BJAB, HeLa, and MDA-MB-468 treated with indicated concentrations of silvestrol or vehicle (DMSO) for 24 h. Silvestrol-inducible proteins are indicated in red. (I) Representative immunobl