 Explore
 Validate
 Learn
LearnPA5-113440
antibody from Invitrogen Antibodies
Targeting: MCM9
C6orf61, dJ329L24.3, FLJ20170, MCMDC1, MGC35304
 Western blot
 ELISA
ELISA Other assay
Antibody data
- Antibody Data
- Antigen structure
- References [1]
- Comments [0]
- Validations
- Other assay [1]
Submit
Validation data
Reference
Comment
Report error
- Product number
- PA5-113440 - Provider product page

- Provider
- Invitrogen Antibodies
- Product name
- MCM9 Polyclonal Antibody
- Antibody type
- Polyclonal
- Antigen
- Recombinant full-length protein
- Reactivity
- Human, Mouse
- Host
- Rabbit
- Isotype
- IgG
- Vial size
- 100 μg
- Concentration
- 1 mg/mL
- Storage
- -20°C or -80°C if preferred
Submitted references A multi-functional role for the MCM8/9 helicase complex in maintaining fork integrity during replication stress.
Griffin WC, McKinzey DR, Klinzing KN, Baratam R, Eliyapura A, Trakselis MA
Nature communications 2022 Aug 30;13(1):5090
Nature communications 2022 Aug 30;13(1):5090
No comments: Submit comment
Supportive validation
- Submitted by
- Invitrogen Antibodies (provider)
- Main image
- Experimental details
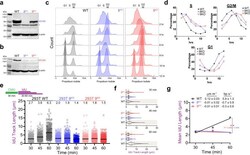
- Fig. 1 DNA replication rates are reduced in the absence of MCM8/9, leading to delayed cell cycle progression. Western blots showing the absence of a MCM8 or b MCM9 in their respective knockout cell lines ( n = 2 independent blots). B-actin was used as a loading control. *indicates the presence of a nonspecific band. c Cells were synchronized with a double thymidine block, released into S-phase, and then the chromosome content was monitored by FACS. d After gating and quantification of S, G2/M, and G1 populations, the percentages were plotted as a function of time. e Dual labeling DNA fiber assay with a constant 30 min CldU pulse followed by a variable 30-60 min IdU pulse. The IdU track lengths adjacent to a constant CldU track (>400 fibers each) were measured as a readout of replication progression for 293T WT (gray circles, *), 8 KO (8B2 clone, blue circles, *), 9 KO (9D6 clone, red circles, *) cells. IdU lengths were measured with ImageJ software and the corresponding mean value of each time point are indicated above the plot and with a black bar. f Violin plots comparing the IdU track lengths at each time point to the WT values (beige box and lines) with mean (solid line) and quartiles (dashed lines) indicated. g Mean IdU track length values were plotted as a function of time to obtain apparent overall replication rates. A two-sided t test was used to calculate P values between the slopes for either WT and 8 KO or 9 KO (* P < 0.05).
