Explore
 Validate
 Learn
Learn Western blot
 ELISA
ELISA Immunocytochemistry
Antibody data
- Antibody Data
- Antigen structure
- References [1]
- Comments [0]
- Validations
- Immunocytochemistry [2]
- Other assay [1]
Submit
Validation data
Reference
Comment
Report error
- Product number
- MA5-15646 - Provider product page

- Provider
- Invitrogen Antibodies
- Product name
- ETV5 Monoclonal Antibody (3H3)
- Antibody type
- Monoclonal
- Antigen
- Purifed from natural sources
- Description
- MA5-15646 targets ETV5 in indirect ELISA, WB applications and shows reactivity with Human samples. The MA5-15646 immunogen is purified recombinant fragment of human ETV5 expressed in E. Coli. . MA5-15646 detects ETV5 which has a predicted molecular weight of approximately 58kDa.
- Reactivity
- Human, Mouse
- Host
- Mouse
- Isotype
- IgG
- Antibody clone number
- 3H3
- Vial size
- 100 μL
- Concentration
- Conc. Not Determined
- Storage
- Store at 4°C short term. For long term storage, store at -20°C, avoiding freeze/thaw cycles.
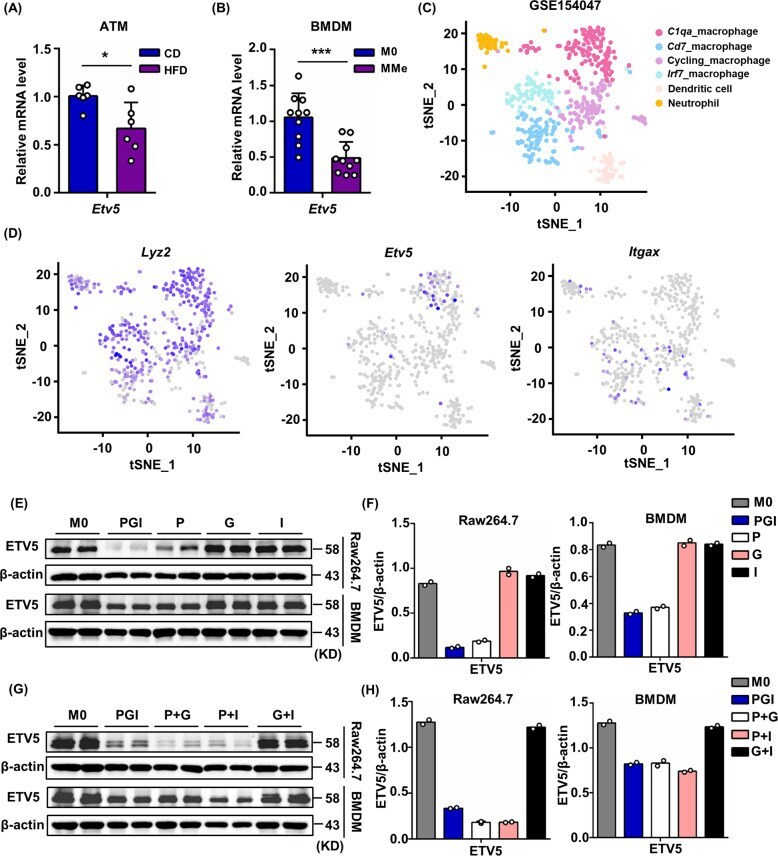
Submitted references Chromatin accessibility analysis identifies the transcription factor ETV5 as a suppressor of adipose tissue macrophage activation in obesity.
Hu RD, Zhang W, Li L, Zuo ZQ, Ma M, Ma JF, Yin TT, Gao CY, Yang SH, Zhao ZB, Li ZJ, Qiao GB, Lian ZX, Qu K
Cell death & disease 2021 Oct 29;12(11):1023
Cell death & disease 2021 Oct 29;12(11):1023
No comments: Submit comment
Supportive validation
- Submitted by
- Invitrogen Antibodies (provider)
- Main image

- Experimental details
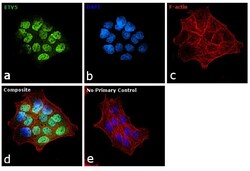
- Immunofluorescence analysis of ETV5 was performed using 70% confluent log phase A-431 cells. The cells were fixed with 4% paraformaldehyde for 10 minutes, permeabilized with 0.1% Triton™ X-100 for 15 minutes, and blocked with 1% BSA for 1 hour at room temperature. The cells were labeled with ETV5 Monoclonal Antibody (3H3) (Product # MA5-15646) at 1:200 dilution in 0.1% BSA, incubated at 4 degree Celsius overnight and then labeled with Goat anti-Mouse IgG (H+L) Superclonal™ Secondary Antibody, Alexa Fluor® 488 conjugate (Product # A28175) at a dilution of 1:2000 for 45 minutes at room temperature (Panel a: green). Nuclei (Panel b: blue) were stained with SlowFade® Gold Antifade Mountant with DAPI (Product # S36938). F-actin (Panel c: red) was stained with Rhodamine Phalloidin (Product # R415, 1:300). Panel d represents the merged image showing predominantly nuclear localization. Panel e represents control cells with no primary antibody to assess background. The images were captured at 60X magnification. .

- Submitted by
- Invitrogen Antibodies (provider)
- Main image
- Experimental details
- Immunofluorescence analysis of ETV5 was performed using 70% confluent log phase A-431 cells. The cells were fixed with 4% paraformaldehyde for 10 minutes, permeabilized with 0.1% Triton™ X-100 for 15 minutes, and blocked with 1% BSA for 1 hour at room temperature. The cells were labeled with ETV5 Monoclonal Antibody (3H3) (Product # MA5-15646) at 1:200 dilution in 0.1% BSA, incubated at 4 degree Celsius overnight and then labeled with Goat anti-Mouse IgG (H+L) Superclonal™ Secondary Antibody, Alexa Fluor® 488 conjugate (Product # A28175) at a dilution of 1:2000 for 45 minutes at room temperature (Panel a: green). Nuclei (Panel b: blue) were stained with SlowFade® Gold Antifade Mountant with DAPI (Product # S36938). F-actin (Panel c: red) was stained with Rhodamine Phalloidin (Product # R415, 1:300). Panel d represents the merged image showing predominantly nuclear localization. Panel e represents control cells with no primary antibody to assess background. The images were captured at 60X magnification. .

Supportive validation
- Submitted by
- Invitrogen Antibodies (provider)
- Main image
- Experimental details
- Fig. 3 ETV5 expression was downregulated in ATMs from HFD-fed mice and in in vitro induced MMe. A Etv5 mRNA levels in ATMs from CD- ( n = 6) and HFD-fed ( n = 6) mice. B Etv5 mRNA levels in BMDMs after 24 h of stimulation with palmitate (P, 0.4 mM), glucose (G, 30 mM), and insulin (I, 10 nM). Gene expression levels were assessed by RT-qPCR. Data were pooled from two independent experiments. C Single-cell RNA-sequencing data of stromal vascular fraction from mouse iWAT. tSNE plot showing myeloid cell clusters. D Featureplot showing Lyz2 , Etv5 and Itgax expression by different myeloid cell clusters. E ETV5 protein levels and F quantification in Raw264.7 cells and BMDMs after treatment with P, G, I alone or in combination for 24 h. G ETV5 protein levels and H quantification in Raw264.7 cells and BMDMs after treatment with P, G, and I in pairs for 24 h. Data in E and G were representative of three independent experiments. * p < 0.05, ** p < 0.01, *** p < 0.001, Student's t test.