 Explore
 Validate
 Learn
Learn Western blot
Antibody data
- Antibody Data
- Antigen structure
- References [1]
- Comments [0]
- Validations
- Western blot [5]
- Immunocytochemistry [4]
- Chromatin Immunoprecipitation [2]
Submit
Validation data
Reference
Comment
Report error
- Product number
- PA5-30023 - Provider product page

- Provider
- Invitrogen Antibodies
- Product name
- ETV5 Polyclonal Antibody
- Antibody type
- Polyclonal
- Antigen
- Recombinant full-length protein
- Description
- Recommended positive controls: ERM-transfected 293T. Predicted reactivity: Mouse (98%), Rat (95%), Pig (98%), Chicken (88%), Bovine (98%). Store product as a concentrated solution. Centrifuge briefly prior to opening the vial.
- Reactivity
- Human
- Host
- Rabbit
- Isotype
- IgG
- Vial size
- 100 μL
- Concentration
- 0.48 mg/mL
- Storage
- Store at 4°C short term. For long term storage, store at -20°C, avoiding freeze/thaw cycles.
Submitted references ETV5 Regulates Hepatic Fatty Acid Metabolism Through PPAR Signaling Pathway.
Mao Z, Feng M, Li Z, Zhou M, Xu L, Pan K, Wang S, Su W, Zhang W
Diabetes 2021 Jan;70(1):214-226
Diabetes 2021 Jan;70(1):214-226
No comments: Submit comment
Supportive validation
- Submitted by
- Invitrogen Antibodies (provider)
- Main image
- Experimental details
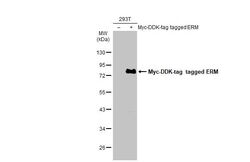
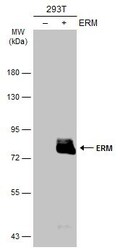
- Western Blot using ETV5 Polyclonal Antibody (Product # PA5-30023). Non-transfected (–) and transfected (+) 293T whole cell extracts (30 µg) were separated by 10% SDS-PAGE, and the membrane was blotted with ETV5 Polyclonal Antibody (Product # PA5-30023) diluted at 1:5,000. The HRP-conjugated anti-rabbit IgG antibody was used to detect the primary antibody.
- Submitted by
- Invitrogen Antibodies (provider)
- Main image
- Experimental details
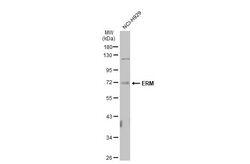
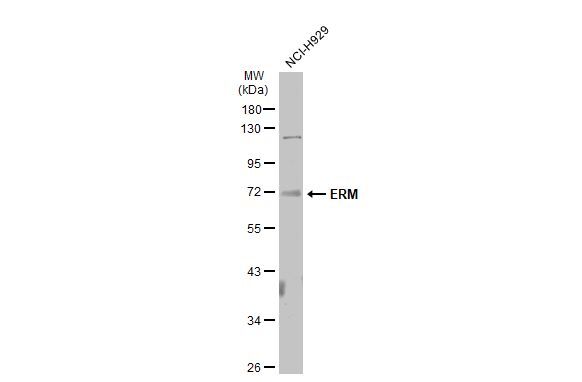
- Western Blot using ETV5 Polyclonal Antibody (Product # PA5-30023). Whole cell extract (30 µg) was separated by 10% SDS-PAGE, and the membrane was blotted with ETV5 Polyclonal Antibody (Product # PA5-30023) diluted at 1:500. The HRP-conjugated anti-rabbit IgG antibody was used to detect the primary antibody.
- Submitted by
- Invitrogen Antibodies (provider)
- Main image
- Experimental details
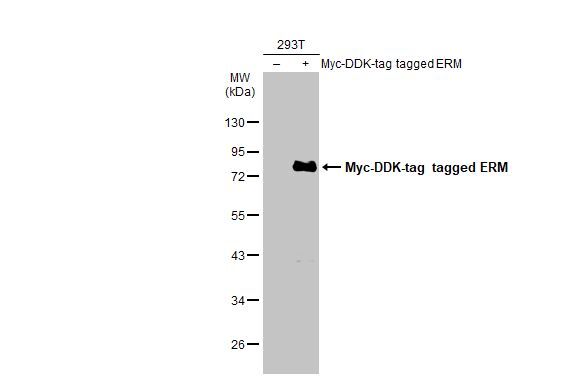
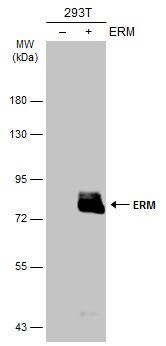
- Western Blot analysis of ETV5 was performed by separating 30 µg of non-transfected (–) and transfected (+) 293T whole cell extracts by 10% SDS-PAGE. Proteins were transferred to a membrane and probed with a ETV5 Polyclonal Antibody (Product # PA5-30023) at a dilution of 1:5000. The HRP-conjugated anti-rabbit IgG antibody was used to detect the primary antibody.
- Submitted by
- Invitrogen Antibodies (provider)
- Main image
- Experimental details
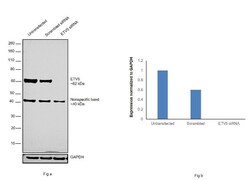
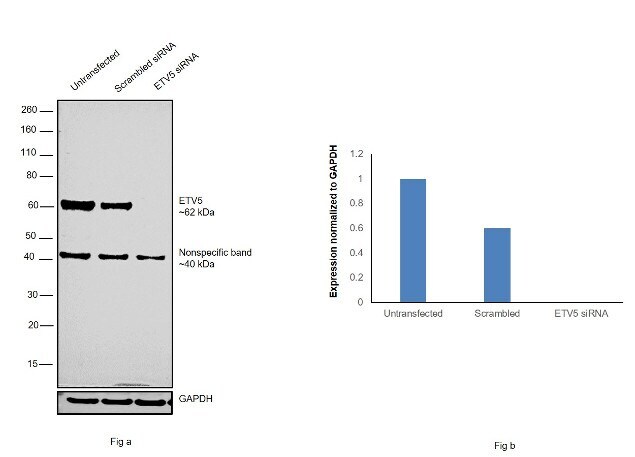
- KD of ETV5 was achieved by transfecting PC-3 with ETV5 specific siRNAs (Silencer® select Product # s4863, s4864). Western blot analysis (Fig. a) was performed using whole cell extracts from the ETV5 KD cells (Lane 3), non-specific scrambled siRNA transfected cells (Lane 2) and untransfected cells (Lane 1). The blot was probed with ETV5 Polyclonal Antibody (Product # PA5-30023, 1:2000 dilution) and Goat Anti-Rabbit IgG Secondary Antibody, HRP conjugate (Product # A27036, 1:4000 dilution). Densitometric analysis of this western blot is shown in histogram (Fig. b). Loss of signal upon siRNA mediated knock down confirms that antibody is specific to ETV5. An uncharacterized band was observed at ~40kDa..
- Submitted by
- Invitrogen Antibodies (provider)
- Main image
- Experimental details
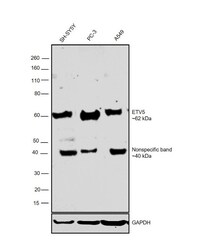
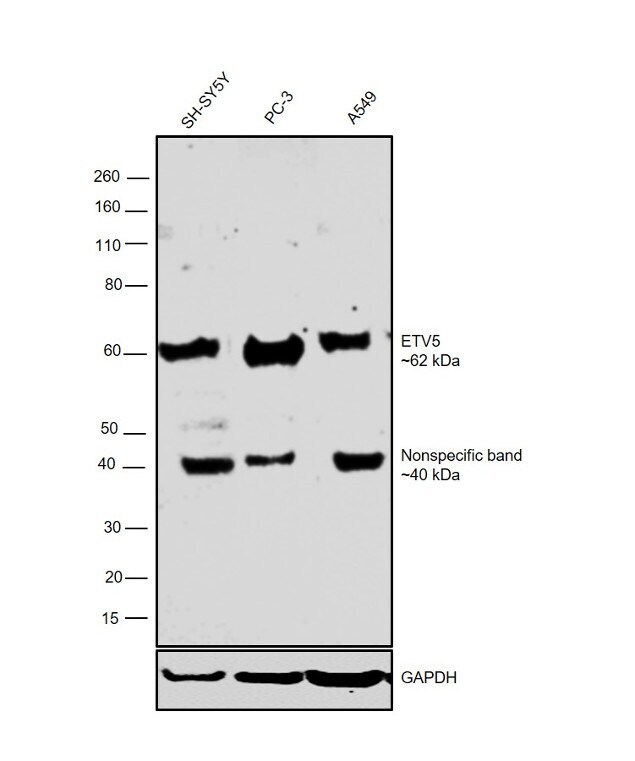
- Western blot was performed using Anti-ETV5 Polyclonal Antibody (Product # PA5-30023) and a 62kDa band corresponding to ETV5 was observed across cell lines tested. An uncharacterized band was observed at 40kDa in the samples. Whole cell extracts (30 µg lysate) of SH-SY5Y (Lane 1), PC-3 (Lane 2) and A549 (Lane 3) were electrophoresed using NuPAGE™ 4-12% Bis-Tris Protein Gel (Product # NP0322BOX). Resolved proteins were then transferred onto a nitrocellulose membrane (Product # IB23001) by iBlot® 2 Dry Blotting System (Product # IB21001). The blot was probed with the primary antibody (1:2000 dilution) and detected by chemiluminescence Goat Anti-Rabbit IgG Secondary Antibody, HRP conjugate (Product # A27036, 1:4000 dilution) using the iBright FL 1000 (Product # A32752). Chemiluminescent detection was performed using Novex® ECL Chemiluminescent Substrate Reagent Kit (Product # WP20005)..
Supportive validation
- Submitted by
- Invitrogen Antibodies (provider)
- Main image

- Experimental details
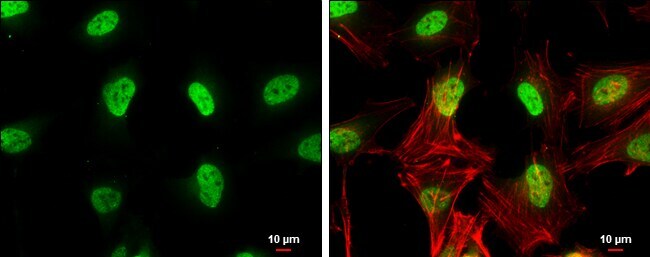
- Immunocytochemistry-Immunofluorescence analysis of ETV5 was performed in HeLa cells fixed in 4% paraformaldehyde at RT for 15 min. Green: ETV5 Polyclonal Antibody (Product # PA5-30023) diluted at 1:500. Red: Phalloidin, a cytoskeleton marker. Blue: Hoechst 33342 staining. Scale bar = 10 µm.

- Submitted by
- Invitrogen Antibodies (provider)
- Main image
- Experimental details
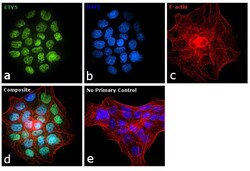
- Immunofluorescence analysis of ETV5 was performed using 70% confluent log phase A-431 cells. The cells were fixed with 4% paraformaldehyde for 10 minutes, permeabilized with 0.1% Triton™ X-100 for 15 minutes, and blocked with 1% BSA for 1 hour at room temperature. The cells were labeled with ETV5 Polyclonal Antibody (Product # PA5-30023) at 1:100 dilution in 0.1% BSA, incubated at 4 degree Celsius overnight and then labeled with Goat anti-Rabbit IgG (H+L) Superclonal™ Secondary Antibody, Alexa Fluor® 488 conjugate (Product # A27034) at a dilution of 1:2000 for 45 minutes at room temperature (Panel a: green). Nuclei (Panel b: blue) were stained with SlowFade® Gold Antifade Mountant with DAPI (Product # S36938). F-actin (Panel c: red) was stained with Rhodamine Phalloidin (Product # R415, 1:300). Panel d represents the merged image showing nuclear localization. Panel e represents control cells with no primary antibody to assess background. The images were captured at 60X magnification. .

- Submitted by
- Invitrogen Antibodies (provider)
- Main image

- Experimental details
- Immunocytochemistry-Immunofluorescence analysis of ETV5 was performed in HeLa cells fixed in 4% paraformaldehyde at RT for 15 min. Green: ETV5 Polyclonal Antibody (Product # PA5-30023) diluted at 1:500. Red: Phalloidin, a cytoskeleton marker. Blue: Hoechst 33342 staining. Scale bar = 10 µm.
- Submitted by
- Invitrogen Antibodies (provider)
- Main image

- Experimental details
- Immunofluorescence analysis of ETV5 was performed using 70% confluent log phase A-431 cells. The cells were fixed with 4% paraformaldehyde for 10 minutes, permeabilized with 0.1% Triton™ X-100 for 15 minutes, and blocked with 1% BSA for 1 hour at room temperature. The cells were labeled with ETV5 Polyclonal Antibody (Product # PA5-30023) at 1:100 dilution in 0.1% BSA, incubated at 4 degree Celsius overnight and then labeled with Goat anti-Rabbit IgG (Heavy Chain) Superclonal™ Secondary Antibody, Alexa Fluor® 488 conjugate (Product # A27034) at a dilution of 1:2000 for 45 minutes at room temperature (Panel a: green). Nuclei (Panel b: blue) were stained with SlowFade® Gold Antifade Mountant with DAPI (Product # S36938). F-actin (Panel c: red) was stained with Rhodamine Phalloidin (Product # R415, 1:300). Panel d represents the merged image showing nuclear localization. Panel e represents control cells with no primary antibody to assess background. The images were captured at 60X magnification. .

Supportive validation
- Submitted by
- Invitrogen Antibodies (provider)
- Main image
- Experimental details
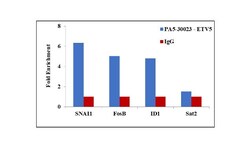
- Chromatin Immunoprecipitation (ChIP) assay of endogenous ETV5 protein using Anti-ETV5 Antibody: ChIP was performed using Anti-ETV5 Rabbit Polyclonal Antibody (Product # PA5-30023, 5 µg) on sheared chromatin from A-431 cells using the MAGnify ChIP System kit (Product # 49-2024). Normal Rabbit IgG was used as a negative IP control. The purified DNA was analyzed by qPCR using primers binding to ID1 promoter, SNAI1 and FOSB transcriptional start sites, and SAT2 satellite repeats. Data is presented as fold enrichment of the antibody signal versus the negative control IgG using the comparative CT method.

- Submitted by
- Invitrogen Antibodies (provider)
- Main image

- Experimental details
- Chromatin Immunoprecipitation (ChIP) assay of endogenous ETV5 protein using Anti-ETV5 Antibody: ChIP was performed using Anti-ETV5 Rabbit Polyclonal Antibody (Product # PA5-30023, 5 µg) on sheared chromatin from A-431 cells using the MAGnify ChIP System kit (Product # 49-2024). Normal Rabbit IgG was used as a negative IP control. The purified DNA was analyzed by qPCR using primers binding to ID1 promoter, SNAI1 and FOSB transcriptional start sites, and SAT2 satellite repeats. Data is presented as fold enrichment of the antibody signal versus the negative control IgG using the comparative CT method.
