 Explore
 Validate
 Learn
Learn Flow cytometry
Antibody data
- Antibody Data
- Antigen structure
- References [0]
- Comments [0]
- Validations
- Flow cytometry [2]
- Other assay [2]
Submit
Validation data
Reference
Comment
Report error
- Product number
- CD0329 - Provider product page

- Provider
- Invitrogen Antibodies
- Product name
- CD3e Monoclonal Antibody (UCHT1), Alexa Fluor™ 700
- Antibody type
- Monoclonal
- Antigen
- Other
- Description
- The Alexa Fluor® 700 dye conjugate provides an excellent spectral match to the common long-wavelength excitation sources, with a high extinction coefficient.
- Reactivity
- Human
- Host
- Mouse
- Conjugate
- Near infrared dye
- Isotype
- IgG
- Antibody clone number
- UCHT1
- Vial size
- 500 µL
- Storage
- 4° C, store in dark
No comments: Submit comment
Supportive validation
- Submitted by
- Invitrogen Antibodies (provider)
- Main image

- Experimental details
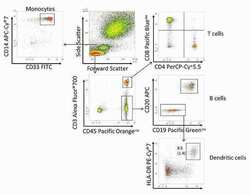
- Human PBMCs stained with: CD45 Pacific Orange™ (Product # MHCD4530TR), CD4 PerCP-Cy®5.5 (Product # A15858), CD20 APC, CD14 APC-Cy®7 (Product # A15453), CD19 Pacific Green™ (Product # C11210), CD3 Alexa Fluor® 700 (CD0329), HLA-DR PE-Cy®7 (Product # A18558), CD8 Pacific Blue™ (Product # MHCD0828), CD33 FITC (Product # A16185), and CD11c PE (Product # A18674) using the Attune® NxT Acoustic Focusing Cytometer with 405 nm excitation and 440/50 emission filter (Pacific Blue™), 512/25 emission filter (Pacific Green™), and 603/48 emission filter (Pacific Orange™); 488 nm excitation and 530/30 emission filter (FITC) and 695/50 emission filter (PerCP-Cy®5.5); 561 nm excitation and 585/16 emission filter (PE) and 780/60 emission filter (PE-Cy®7); 637 nm excitation and 660/20 emission filter (APC), 720/30 emission filter (Alexa Fluor®700), and 780/60 emission filter (APC-Cy®7). Within the CD3 negative CD45 positive gate, B cells can be identified based on expression of CD19 and CD20. Conventional dendritic cells in peripheral blood are generally negative for T and B cell lineage markers and co-express the integrin CD11c and HLA-DR. Values noted are a percent of the parent CD19 negative CD20 negative gate (top value, no parenthesis) or percent of FSC/SSC lymphocyte gate (bottom value, in parentheses).
- Conjugate
- Near infrared dye

- Submitted by
- Invitrogen Antibodies (provider)
- Main image
- Experimental details
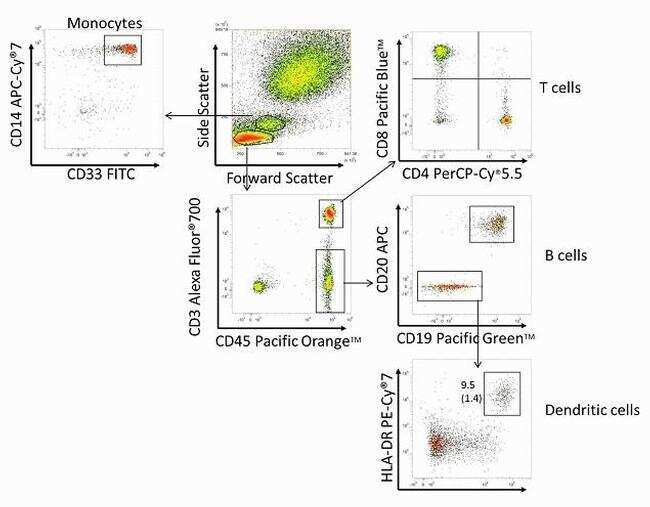
- Human PBMCs stained with: CD45 Pacific Orange™ (Product # MHCD4530TR), CD4 PerCP-Cy®5.5 (Product # A15858), CD20 APC, CD14 APC-Cy®7 (Product # A15453), CD19 Pacific Green™ (Product # C11210), CD3 Alexa Fluor® 700 (CD0329), HLA-DR PE-Cy®7 (Product # A18558), CD8 Pacific Blue™ (Product # MHCD0828), CD33 FITC (Product # A16185), and CD11c PE (Product # A18674) using the Attune® NxT Acoustic Focusing Cytometer with 405 nm excitation and 440/50 emission filter (Pacific Blue™), 512/25 emission filter (Pacific Green™), and 603/48 emission filter (Pacific Orange™); 488 nm excitation and 530/30 emission filter (FITC) and 695/50 emission filter (PerCP-Cy®5.5); 561 nm excitation and 585/16 emission filter (PE) and 780/60 emission filter (PE-Cy®7); 637 nm excitation and 660/20 emission filter (APC), 720/30 emission filter (Alexa Fluor®700), and 780/60 emission filter (APC-Cy®7). Within the CD3 negative CD45 positive gate, B cells can be identified based on expression of CD19 and CD20. Conventional dendritic cells in peripheral blood are generally negative for T and B cell lineage markers and co-express the integrin CD11c and HLA-DR. Values noted are a percent of the parent CD19 negative CD20 negative gate (top value, no parenthesis) or percent of FSC/SSC lymphocyte gate (bottom value, in parentheses).
- Conjugate
- Near infrared dye
Supportive validation
- Submitted by
- Invitrogen Antibodies (provider)
- Main image

- Experimental details
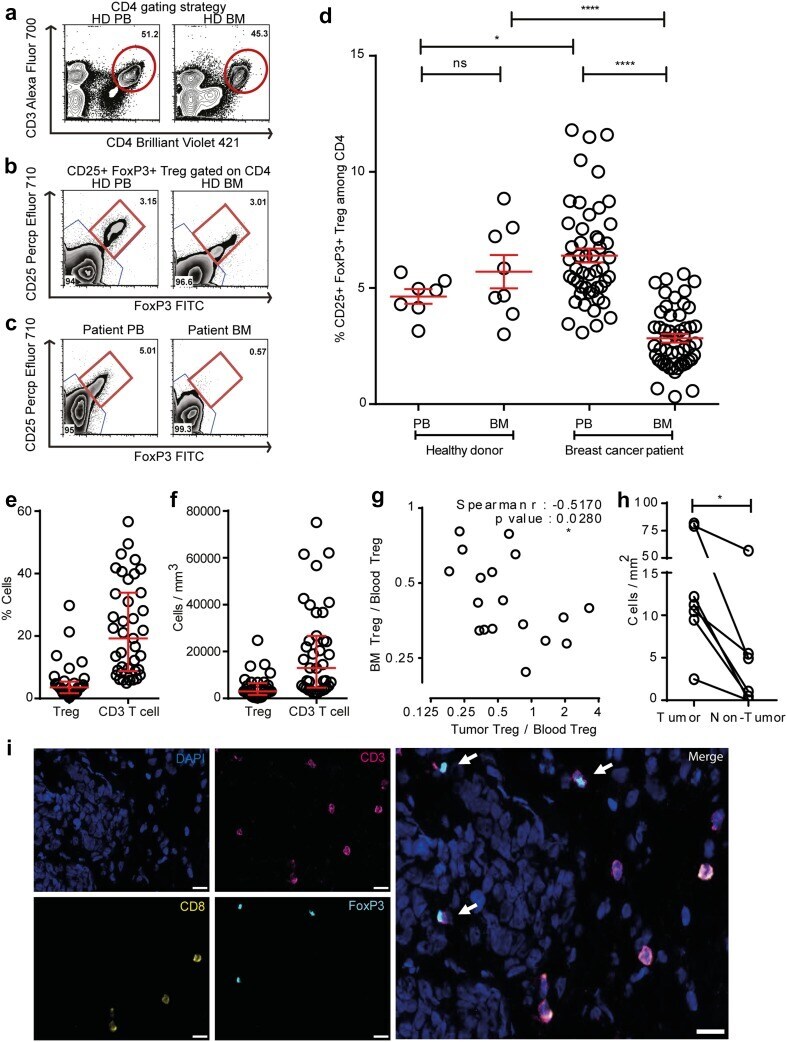
- Fig. 1 Decreased frequencies of Treg subpopulations in the BM of breast cancer patients. a Representative plot of a healthy donor showing the CD4+ T-cell gating strategy. b-c CD4+ cells were analyzed for FoxP3 and CD25 expression. CD25+ FoxP3+ cells were gated as Treg, and CD25- FoxP3- cells were gated as Tcon. Representative plots illustrating Treg frequencies in BM and PB of a healthy donor ( b ) and a breast cancer patient ( c ). Red circle and square represents the CD4 gate and CD25+ FoxP3+ Treg gate, respectively. d Cumulative data of CD25+ FoxP3+ Treg frequencies in PB and BM of all patients and healthy donors analyzed--Healthy donor PB ( n = 7) and BM ( n = 8), patients with matched PB and BM samples ( n = 50). Data distribution in 1 d is represented by mean with SEM. For healthy donors unpaired t test and for patient samples, paired t test was used for statistical analysis. Epigenetic PCR was performed on DNA isolated from tumor areas from FFPE sections obtained from 42 patients. Samples that passed quality control [Treg ( n = 33) and CD3 ( n = 40)] were taken into analysis. e, f Treg and CD3 T-cell percentage ( e ) and counts per mm 3 volume of tumor ( f ). Data distribution is represented by median with interquartile range in e and f. g Graph bridging data of Treg frequencies in BM, PB, and tumor--ratio of Treg in BM to PB correlated to ratio of Treg in tumor to PB [for all patients with Treg frequencies >4.6% in PB ( n = 18)]. Non-parametric Spearman Correlation wa
- Conjugate
- Near infrared dye
- Submitted by
- Invitrogen Antibodies (provider)
- Main image
- Experimental details
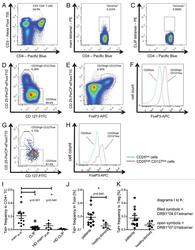
- Figure 3. Tetramer staining of conventional and regulatory T cells from breast cancer patients. ( A-G ) Peripheral blood mononuclear cells (PBMCs) of a breast cancer patient were analyzed, upon gating on living CD3 + CD4 + T cells. The patient sample was stained with tetramers presenting either mam 34-48 ( B ) or the CLIP peptide ( C ). Numbers indicate the percentage of cells in the respective gate, referring to lymphocytes ( A ) or CD3 + CD4 + T cells ( B ) and ( C ). Within CD3 + CD4 + T cells, regulatory T cells (Tregs) were identified as CD25 high CD127 low ( D ) and ( G ) and CD25 high CD127 low FOXP3 + ( E ), ( F ) and ( H ). ( G ) reports the percentage of Tregs within tetramer-positive cells in a representative patient. ( I ) Frequency of mam 34-48 - and CLIP-presenting tetramer-positive cells among CD3 + CD4 + T cells of breast cancer patients and healthy donors (HD) (p values as per Mann-Whitney U tests are indicated). ( J and K ) Frequency of mam 34-48 -specific Tcon ( J ) cells and Tregs ( K ) of breast cancer patients and HDs.
- Conjugate
- Near infrared dye
